Dkoderweb repainting issue fix strategyHarmonic Pattern Recognition Trading Strategy
This TradingView strategy called "Dkoderweb repainting issue fix strategy" is designed to identify and trade harmonic price patterns with optimized entry and exit points using Fibonacci levels. The strategy implements various popular harmonic patterns including Bat, Butterfly, Gartley, Crab, Shark, ABCD, and their anti-patterns.
Key Features
Pattern Recognition: Identifies 17+ harmonic price patterns including standard and anti-patterns
Fibonacci-Based Entries and Exits: Uses customizable Fibonacci levels for precision entries, take profits, and stop losses
Alternative Timeframe Analysis: Option to use higher timeframes for pattern identification
Heiken Ashi Support: Optional use of Heiken Ashi candles instead of regular candlesticks
Visual Indicators:
Pattern visualization with ZigZag indicator
Buy/sell signal markers
Color-coded background to highlight active trade zones
Customizable Fibonacci level display
How It Works
The strategy uses a ZigZag-based pattern identification system to detect pivot points
When a valid harmonic pattern forms, the strategy calculates the optimal entry window using the specified Fibonacci level (default 0.382)
Entries trigger when price returns to the entry window after pattern completion
Take profit and stop loss levels are automatically set based on customizable Fibonacci ratios
Visual alerts notify you of entries and exits
The strategy tracks active trades and displays them with background color highlights
Customizable Settings
Trade size
Entry window Fibonacci level (default 0.382)
Take profit Fibonacci level (default 0.618)
Stop loss Fibonacci level (default -0.618)
Alert messages for entries and exits
Display options for specific Fibonacci levels
Alternative timeframe selection
This strategy is designed to fix repainting issues that are common in harmonic pattern strategies, ensuring more reliable signals and backtesting results.
"zigzag"に関するスクリプトを検索

SemaforThis is the 4 Level Semafor indicator with Daily Open Line and Average Session Range. Also on the chart is the EMA Ribbon indicator.
Credit to:
Devlucem for the Semafor indicator
Quantvue for the Average Session Range
Shusterivi for the Daily Open Line
MYNAMEISBRANDON for the EMA Ribbon
The Semafors are based on the ZigZag indicator and show higher highs/lower lows of a specified period, determined by the user and applied in settings.
The default periods I use are:
10 period (hidden on this chart)
50 period-blue dots
250 period-white dots
615 period-black dots
Just as the ZigZag indicator will recalculate so to will the semafors, as additional candles are built. The semafor indicator is never to be used as a stand alone signal. It must be combined with other indicators to be used effectively. What we look for are the semafor patterns of a large white dot followed by a 1st blue dot opposite of the white. Then a 2nd blue dot in agreement with the white dot. In theory, the 2nd blue dot is seen as confirmation of the establishment of the white semafor..
When combined with Daily Open Line, ADR (Average Sessions Range), EMA cross and VWAP anchored to your 250 semafors, your odds are greatly increased. Add to that the knowledge of basic market structure and the wisdom that comes from patience and you have a very powerful weapon.
The Daily Open...I trade the M1 chart and also draw a H4 Open Line on my chart for the smaller time frames. Price will tend to trade away from the Daily Open Line. In many cases until it reaches certain levels...Fib, Gann, ADR, etc., then runs through a pullback cycle. I like the ADR levels. The ADR can give clues when entering a consolidation phase, ie trading between the buy side and sell side 15% levels. Trading away from the Daily Open(or H4 open) along with breaking the 15% level, while in agreement with a semafor pattern is a good sign.
Add to that confluence the agreement of your MA cross and the 250 semafor Anchored VWAP and you have a solid signal to help determine your actions. This trend following layout will work on any time frame. I just really like the M1 for its precision, not for crazy back and forth all day. With the exception of some strong pull back signals, I don't enter any more trades on the M1 than on M5, 15 or 30.
This is based on and follows the teachings of Xard and his trading strategy. Just as I don't want to take anyone's credit for these indicators, I won't take credit for what I have been taught either.
The trader can obviously use their favorite MA cross indicator. But this one is visually beautiful AND displays the current time frame and 1 time frame higher on the chart...awesome!
Of note, I do run into trouble at times with the 615 period semafor. I have been told it is because TradingView has trouble with extended period indicators. As a matter of fact, I would like a much higher period for my biggest semafor. I would like it set at 1250, but that seems to be a no starter. If anyone has a solution, that would be welcomed news.

Williams Fractals Ultimate (Donchian Adjusted)Williams Fractals Ultimate (Donchian Adjusted)
Understanding Williams Fractals
Williams Fractals are a simple yet powerful tool used to identify potential turning points in the market. They highlight local highs (up fractals) and local lows (down fractals) based on a set period.
An up fractal appears when a price peak is higher than the surrounding prices.
A down fractal appears when a price low is lower than the surrounding prices.
Fractals help traders spot support and resistance levels, potential trend reversals, and price breakout zones.
Why Adjust Fractals with the Donchian Channel?
The standard Williams Fractals method identifies local highs and lows without considering broader market context. This script enhances fractal accuracy by integrating the Donchian Channel, which tracks the highest highs and lowest lows over a set period.
- The Donchian Baseline is calculated as the average of the highest high and lowest low over a selected period.
- Fractals are filtered based on this baseline:
Up Fractals are only shown if they are above the Donchian baseline.
Down Fractals are only shown if they are below the Donchian baseline.
This filtering method removes weak signals and ensures that only relevant fractals aligned with market structure are displayed.
Key Features of the Script
Customizable Fractal & Donchian Periods – Allows traders to fine-tune fractal sensitivity.
Donchian-Based Filtering – Reduces noise and highlights meaningful fractals.
Fractal ZigZag Line (Optional) – Helps visualize price swings more clearly.
Why Is This So Effective?
Stronger trend signals – Filtering with the Donchian baseline eliminates unreliable fractals.
Clearer price action – The optional ZigZag line visually connects significant highs and lows.
Easy trend identification – Helps traders confirm breakout zones and key price levels.
This script is a technical analysis tool and does not guarantee profitable trades. Always combine it with other indicators and risk management strategies before making trading decisions.

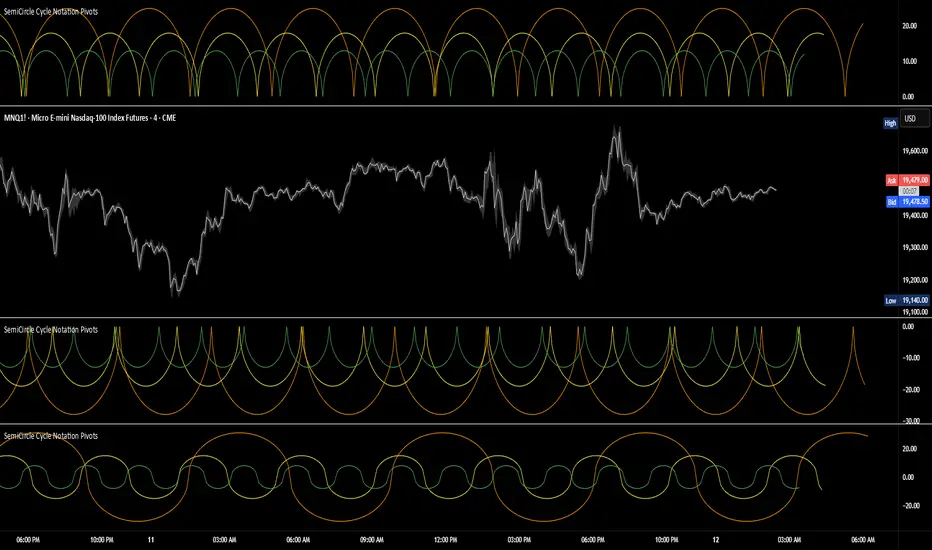
SemiCircle Cycle Notation PivotsFor decades, traders have sought to decode the rhythm of the markets through cycle theory. From the groundbreaking work of HM Gartley in the 1930s to modern-day cycle trading tools on TradingView, the concept remains the same: markets move in repeating waves with larger cycles influencing smaller ones in a fractal-like structure, and understanding their timing gives traders an edge to better anticipate future price movements🔮.
Traditional cycle analysis has always been manual, requiring traders to painstakingly plot semicircles, diamonds, or sine waves to estimate pivot points and time reversals. Drawing tools like semicircle & sine wave projections exist on TradingView, but they lack automation—forcing traders to adjust cycle lengths by eye, often leading to inconsistencies.
This is where SemiCircle Cycle Notation Pivots indicator comes in. Semicircle cycle chart notation appears to have evolved as a practical visualization tool among cycle theorists rather than being pioneered by a single individual; some key influences include HM Gartley, WD Gann, JM Hurst, Walter Bressert, and RayTomes. Built upon LonesomeTheBlue's foundational ZigZag Waves indicator , this indicator takes cycle visualization to the next level by dynamically detecting price pivots and then automatically plotting semicircles based on real-time cycle length calculations & expected rhythm of price action over time.
Key Features:
Automated Cycle Detection: The indicator identifies pivot points based on your preference—highs, lows, or both—and plots semicircle waves that correspond to Hurst's cycle notation.
Customizable Cycle Lengths: Tailor the analysis to your trading strategy with adjustable cycle lengths, defaulting to 10, 20, and 40 bars, allowing for flexibility across various timeframes and assets.
Dynamic Wave Scaling: The semicircle waves adapt to different price structures, ensuring that the visualization remains proportional to the detected cycle lengths and aiding in the identification of potential reversal points.
Automated Cycle Detection: Dynamically identifies price pivot points and automatically adjusts offsets based on real-time cycle length calculations, ensuring precise semicircle wave alignment with market structure.
Color-Coded Cycle Tiers: Each cycle tier is distinctly color-coded, enabling quick differentiation and a clearer understanding of nested market cycles.
Fibonacci 3-D🟩 The Fibonacci 3-D indicator is a visual tool that introduces a three-dimensional approach to Fibonacci projections, leveraging market geometry. Unlike traditional Fibonacci tools that rely on two points and project horizontal levels, this indicator leverages slopes derived from three points to introduce a dynamic element into the calculations. The Fibonacci 3-D indicator uses three user-defined points to form a triangular structure, enabling multi-dimensional projections based on the relationships between the triangle’s sides.
This triangular framework forms the foundation for the indicator’s calculations, with each slope (⌳AB, ⌳AC, and ⌳BC) representing the rate of price change between its respective points. By incorporating these slopes into Fibonacci projections, the indicator provides an alternate approach to identifying potential support and resistance levels. The Fibonacci 3-D expands on traditional methods by integrating both historical price trends and recent momentum, offering deeper insights into market dynamics and aligning with broader market geometry.
The indicator operates across three modes, each defined by the triangular framework formed by three user-selected points (A, B, and C):
1-Dimensional (1-D): Fibonacci levels are based on a single side of the triangle, such as AB, AC, or BC. The slope of the selected side determines the angle of the projection, allowing users to analyze linear trends or directional price movements.
2-Dimensional (2-D): Combines two slopes derived from the sides of the triangle, such as AB and BC or AC and BC. This mode adds depth to the projections, accounting for both historical price swings and recent market momentum.
3-Dimensional (3-D): Integrates all three slopes into a unified projection. This mode captures the full geometric relationship between the points, revealing a comprehensive view of geometric market structure.
🌀 THEORY & CONCEPT 🌀
The Fibonacci 3-D indicator builds on the foundational principles of traditional Fibonacci analysis while expanding its scope to capture more intricate market structures. At its core, the indicator operates based on three user-selected points (A, B, and C), forming the vertices of a triangle that provides the structural basis for all calculations. This triangle determines the slopes, projections, and Fibonacci levels, aligning with the unique geometric relationships between the chosen points. By introducing multiple dimensions and leveraging this triangular framework, the indicator enables a deeper examination of price movements.
1️⃣ First Dimension (1-D)
In technical analysis, traditional Fibonacci retracement and extension tools operate as one-dimensional instruments. They rely on two price points, often a swing high and a swing low, to calculate and project horizontal levels at predefined Fibonacci ratios. These levels identify potential support and resistance zones based solely on the price difference between the selected points.
A one-dimensional Fibonacci showing levels derived from two price points (B and C).
The Fibonacci 3-D indicator extends this one-dimensional concept by introducing Ascending and Descending projection options. These options calculate the levels to align with the directional movement of price, creating sloped projections instead of purely horizontal levels.
1-D mode with an ascending projection along the ⌳BC slope aligned to the market's slope. Potential support is observed at 0.236 and 0.382, while resistance appears at 1.0 and 0.5.
2️⃣ Second Dimension (2-D)
The second dimension incorporates a second side of the triangle, introducing relationships between two slopes (e.g., ⌳AB and ⌳BC) to form a more dynamic three-point structure (A, B, and C) on the chart. This structure enables the indicator to move beyond the single-axis (price) calculations of traditional Fibonacci tools. The sides of the triangle (AB, AC, BC) represent slopes calculated as the rate of price change over time, capturing distinct components of market movement, such as trend direction and momentum.
2-D mode of the Fibonacci 3-D indicator using the ⌳AC slope with a descending projection. The Fibonacci projections align closely with observed market behavior, providing support at 0.236 and resistance at 0.618. Unlike traditional zigzag setups, this configuration uses two swing highs (A and B) and a swing low (C). The alignment along the descending slope highlights the geometric relationships between selected points in identifying potential support and resistance levels.
3️⃣ Third Dimension (3-D)
The third dimension expands the analysis by integrating all three slopes into a unified calculation, encompassing the entire triangle structure formed by points A, B, and C. Unlike the second dimension, which analyzes pairwise slope relationships, the 3-D mode reflects the combined geometry of the triangle. Each slope contributes a distinct perspective: AB and AC provide historical context, while BC emphasizes the most recent price movement and is given greater weight in the calculations to ensure projections remain responsive to current dynamics.
Using this integrated framework, the 3-D mode dynamically adjusts Fibonacci projections to balance long-term patterns and short-term momentum. The projections extend outward in alignment with the triangle’s geometry, offering a comprehensive framework for identifying potential support and resistance zones and capturing market structures beyond the scope of simpler 1-D or 2-D modes.
Three-dimensional Fibonacci projection using the ⌳AC slope, aligning closely with the market's directional movement. The projection highlights key levels: resistance at 0.0 and 0.618, and support at 1.0, 0.786, and 0.382.
By leveraging all three slopes simultaneously, the 3-D mode introduces a level of complexity particularly suited for volatile or non-linear markets. The weighted slope calculations ensure no single price movement dominates the analysis, allowing the projections to adapt dynamically to the broader market structure while remaining sensitive to recent momentum.
Three-dimensional ascending projection. In 3D mode, the indicator integrates all three slopes to calculate the angle of projection for the Fibonacci levels. The resulting projections adapt dynamically to the overall geometry of the ABC structure, aligning with the market’s current direction.
🔂 Interactions: Dimensions. Slope Source, Projections, and Orientation
The Dimensions , Projections , and Orientation settings work together to define Fibonacci projections within the triangular framework. Each setting plays a specific role in the geometric analysis of price movements.
♾️ Dimension determines which of the three modes (1-D, 2-D, or 3-D) is used for Fibonacci projections. In 1-D mode, the projections are based on a single side of the triangle, such as AB, AC, or BC. In 2-D mode, two sides are combined, producing levels based on their geometric relationship. The 3-D mode integrates all three sides of the triangle, calculating projections using weighted averages that emphasize the BC side for its relevance to recent price movement while maintaining historical context from the AB and AC sides.
A one-dimensional Fibonacci projection using the ⌳AB slope with a neutral projection. Important levels of interaction are highlighted: repeated resistance at Level 1.0 and repeated support at Levels 0.5 and 0.618. The projection aligns horizontally, reflecting the relationship between points A, B, and C while identifying recurring zones of market structure.
🧮 Slope Source determines which side of the triangle (AB, AC, or BC) serves as the foundation for Fibonacci projections. This selection directly impacts the calculations by specifying the slope that anchors the geometric relationships within the chosen Dimension mode (1-D, 2-D, or 3-D).
In 1-D mode, the selected Source defines the single side used for the projection. In 2-D and 3-D modes, the Source works in conjunction with other settings to refine projections by integrating the selected slope into the multi-dimensional framework.
One-dimensional Fibonacci projection using the ⌳AC Slope Source and Ascending projection. The projection continues on the AC slope line.
🎯 Projection controls the direction and alignment of Fibonacci levels. Neutral projections produce horizontal levels, similar to traditional Fibonacci tools. Ascending and Descending projections adjust the levels along the calculated slope to reflect market trends. These options allow the indicator’s outputs to align with different market behaviors.
An ascending projection along the ⌳BC slope aligns with resistance levels at 1.0, 0.618, and 0.236. The geometric relationship between points A, B, and C illustrates how the projection adapts to market structure, identifying resistance zones that may not be captured by traditional Fibonacci tools.
🧭 Orientation modifies the alignment of the setup area defined by points A, B, and C, which influences Fibonacci projections in 2-D and 3-D modes. In Default mode, the triangle aligns naturally based on the relative positions of points B and C. In Inverted mode, the geometric orientation of the setup area is reversed, altering the slope calculations while preserving the projection direction specified in the Projection setting. In 1-D mode, Orientation has no effect since only one side is used for the projection.
Adjusting the Orientation setting provides alternative views of how Fibonacci levels align with the market's structure. By recalibrating the triangle’s setup, the inverted orientation can highlight different relationships between the sides, providing additional perspectives on support and resistance zones.
2-D inverted. The ⌳AC slope defines the projection, and the inverted orientation adjusts the alignment of the setup area, altering the angles used in level calculations. Key levels are highlighted: resistance at 0.786, strong support at 0.5 and 0.236, and a resistance-turned-support interaction at 0.618.
🛠️ CONFIGURATION AND SETTINGS 🛠️
The Fibonacci 3-D indicator includes configurable settings to adjust its functionality and visual representation. These options include customization of the dimensions (1-D, 2-D, or 3-D), slope calculations, orientations, projections, Fibonacci levels, and visual elements.
When adding the indicator to a new chart, select three reference points (A, B, and C). These are usually set to recent swing points. All three points can be easily changed at any time by clicking on the reference point and dragging it to a new location.
By default, all settings are set to Auto . The indicator uses an internal algorithm to estimate the projections based on the orientation and relative positions of the reference points. However, all values can be overridden to reflect the user's interpretation of the current market geometry.
⚙️ Core Settings
Dimensions : Defines how many sides of the triangle formed by points A, B, and C are incorporated into the calculations for Fibonacci projections. This setting determines the level of complexity and detail in the analysis. 1-D : Projects levels along the angle of a single user-selected side of the triangle.
2-D : Projects levels based on a composite slope derived from the angles of two sides of the triangle.
3-D : Projects levels based on a composite slope derived from all three sides of the triangle (A-B, A-C, and B-C), providing a multi-dimensional projection that adapts to both historical and recent market movements.
Slope Source : Determines which side of the triangle is used as the basis for slope calculations. A–B: The slope between points A and B. In 1-D mode, this determines the projection. In 2-D and 3-D modes, it contributes to the composite slope calculation.
A–C: The slope between points A and C. In 1-D mode, this determines the projection. In 2-D and 3-D modes, it contributes to the composite slope calculation.
B--C: The slope between points B and C. In 1-D mode, this determines the projection. In 2-D and 3-D modes, it contributes to the composite slope calculation.
Orientation : Defines the triangle's orientation formed by points A, B, and C, influencing slope calculations. Auto : Automatically determines orientation based on the relative positions of points B and C. If point C is to the right of point B, the orientation is "normal." If point C is to the left, the orientation is inverted.
Inverted : Reverses the orientation set in "Auto" mode. This flips the triangle, reversing slope calculations ⌳AB becomes ⌳BA).
Projection : Determines the direction of Fibonacci projections: Auto : Automatically determines projection direction based on the triangle formed by A, B, and C.
Ascending : Projects the levels upward.
Neutral : Projects the levels horizontally, similar to traditional Fibonacci retracements.
Descending : Projects the levels downward.
⚙️ Fibonacci Level Settings Show or hide specific levels.
Level Value : Adjust Fibonacci ratios for each level. The 0.0 and 1.0 levels are fixed.
Color : Set level colors.
⚙️ Visibility Settings Show Setup : Toggle the display of the setup area, which includes the projected lines used in calculations.
Show Triangle : Toggle the display of the triangle formed by points A, B, and C.
Triangle Color : Set triangle line colors.
Show Point Labels : Toggle the display of labels for points A, B, and C.
Show Left/Right Labels : Toggle price labels on the left and right sides of the chart.
Fill % : Adjust the fill intensity between Fibonacci levels (0% for no fill, 100% for full fill).
Info : Set the location or hide the Slope Source and Dimension. If Orientation is Inverted , the Slope Source will display with an asterisk (*).
⚙️ Time-Price Points : Set the time and price for points A, B, and C, which define the Fibonacci projections.
A, B, and C Points : User-defined time and price coordinates that form the foundation of the indicator's calculations.
Interactive Adjustments : Changes made to points on the chart automatically synchronize with the settings panel and update projections in real time.
Notes
Unlike traditional Fibonacci tools that include extensions beyond 1.0 (e.g., 1.618 or 2.618), the Fibonacci 3-D indicator restricts Fibonacci levels to the range between 0.0 and 1.0. This is because the projections are tied directly to the proportional relationships along the sides of the triangle formed by points A, B, and C, rather than extending beyond its defined structure.
The indicator's calculations dynamically sort the user-defined A, B, and C points by time, ensuring point A is always the earliest, point C the latest, and point B the middle. This automatic sorting allows users to freely adjust the points directly on the chart without concern for their sequence, maintaining consistency in the triangular structure.
🖼️ ADDITIONAL CHART EXAMPLES 🖼️
Three-dimensional ⌳AC slope is used with an ascending projection, even as the broader market trend moves downward. Despite the apparent contradiction, the projected Fibonacci levels align closely with price action, identifying zones of support and resistance. These levels highlight smaller countertrend movements, such as pullbacks to 0.382 and 0.236, followed by continuations at resistance levels like 0.618 and 0.786.
In 2-D mode, an ascending projection based on the BC slope highlights the market's geometric structure. A setup triangle, defined by a swing high (A), a swing low (B), and another swing high (C), reveals Fibonacci projections aligning with support at 0.236, 0.382, and 0.5, and resistance at 0.618, 0.786, and 1.0, as shown by the green and red arrows. This demonstrates the ability to uncover dynamic support and resistance levels not calculated in traditional Fibonacci tools.
In 2-D mode with an ascending projection from the ⌳AB slope, price movement is contained within the 0.5 and 0.786 levels. The 0.5 level serves as support, while the 0.786 level acts as resistance, with price action consistently interacting with these boundaries.
An AC (2-D) ascending projection is derived from two swing highs (A and B) and a swing low (C), reflecting a non-linear market structure that deviates from traditional zigzag patterns. The ascending projection aligns closely with the market's upward trajectory, forming a channel between the 0.0 and 0.5 Fibonacci levels. Note how price action interacts with the projected levels, showing support at 0.236 and 0.382, with the 0.5 level acting as a mid-channel equilibrium.
Two-dimensional ascending Fibonacci projection using the ⌳AC slope. Arrows highlight resistance at 0.786 and support at 0.0 and 0.236. The projection follows the ⌳AC slope, reflecting the geometric relationship between points A, B, and C to identify these levels.
Three-dimensional Fibonacci projection using the ⌳AC slope, aligned with the actual market's directional trend. By removing additional Fibonacci levels, the image emphasizes key areas: resistance at Level 0.0 and support at Levels 1.0 and 0.5. The projection dynamically follows the ⌳AC slope, adapting to the market's structure as defined by points A, B, and C.
A three-dimensional configuration uses the ⌳AB slope as the baseline for projections while incorporating the geometric influence of point C. Only the 0.0 and 0.618 levels are enabled, emphasizing the relationship between support at 0.0 and resistance at 0.618. Unlike traditional Fibonacci tools, which operate in a single plane, this setup reveals levels that rely on the triangular relationship between points A, B, and C. The third dimension allows for projections that align more closely with the market’s structure and reflect its multi-dimensional geometry.
The Fibonacci 3-D indicator can adapt to non-traditional point selection. Point A serves as a swing low, while points B and C are swing highs, forming an unconventional configuration. ⌳The BC slope is used in 2-D mode with an inverted orientation, flipping the projection direction and revealing resistance at Level 0.786 and support at Levels 0.618 and 0.5.
⚠️ DISCLAIMER ⚠️
The Fibonacci 3-D indicator is a visual analysis tool designed to illustrate Fibonacci relationships. While the indicator employs precise mathematical and geometric formulas, no guarantee is made that its calculations will align with other Fibonacci tools or proprietary methods. Like all technical and visual indicators, the Fibonacci projections generated by this tool may appear to visually align with key price zones in hindsight. However, these projections are not intended as standalone signals for trading decisions. This indicator is intended for educational and analytical purposes, complementing other tools and methods of market analysis.
🧠 BEYOND THE CODE 🧠
The Fibonacci 3-D indicator, like other xxattaxx indicators , is designed to encourage both education and community engagement. Your feedback and insights are invaluable to refining and enhancing the Fibonacci 3-D indicator. We look forward to the creative applications, adaptations, and observations this tool inspires within the trading community.

Waldo RSI :oWaldo RSI :o Indicator Guide
The Waldo RSI :o indicator is designed to complement the "Waldo RSI Overlay :o" by providing an RSI-based analysis on TradingView, focusing on macro shifts in market trends. Here's a comprehensive guide on how to use this indicator:
Key Features:
RSI Settings:
RSI Source: Choose from ON RSI, ON HIGH, ON LOW, ON CLOSE, or ON OPEN to determine how RSI calculates pivots.
RSI Settings:
Source: Default is (H+L)/2, but you can select any price for RSI calculation.
Length: Default RSI length is 7, which can be adjusted for sensitivity.
Trend Lines:
Show Trend Lines: Option to display trend lines based on RSI pivot points.
Zigzag Length: Determines pivot point sensitivity.
Confirm Length: Validates pivot points (default is 3).
Colors: Customize colors for Higher Highs (HH), Lower Highs (LH), Higher Lows (HL), and Lower Lows (LL) on the RSI.
Label Size and Line Width: Adjust the appearance of labels and lines.
Divergences:
Classic Divergences:
Show Classic Div: Toggle to reveal divergences where RSI and price move in opposite directions.
Colors: Set different colors for bullish and bearish divergence indicators.
Transparency and Line Width: Control the visual impact of divergence signals.
Hidden Divergences:
Similar settings for identifying hidden divergences, suggest trend continuation.
Breakout/Breakdown:
Show Breakout/Breakdown: Generates signals for RSI breakouts or breakdowns, used by "Waldo RSI Overlay :o" for visual chart signals.
Overbought/Oversold Zones:
Show Overbought and OverSold Zones: Highlights when RSI goes above 70 (overbought) or below 30 (oversold).
Moving Averages on RSI:
The default Moving Average (MA) settings are tailored to capture macro shifts in market trends:
Show Moving Averages: Option to overlay two MAs on the RSI for trend confirmation:
Fast RSI MA:
RSI Period: 50 (this is the period over which the RSI is calculated).
MA Length: 50 (the number of periods used for the moving average of the RSI).
Slow RSI MA:
RSI Period: 50 (same as fast for consistency in RSI calculation).
MA Length: 200 (longer term for capturing broader trends).
Crossover Signals: The RSI changes color from red to green based on these moving average crossovers:
When the Fast MA (50 period) crosses above the Slow MA (200 period), the RSI turns green, indicating potential bullish conditions or momentum shift.
Conversely, when the Fast MA crosses below the Slow MA, the RSI turns red, suggesting bearish conditions or a shift back towards a downtrend.
This 50-period RSI crossover setting is used to identify overall macro shifts in the market, providing a clear visual cue for traders looking at longer-term trends.
Ghost Lines (Optional):
Ghost Lines: Option to limit how far RSI trend lines extend, helping to keep the chart less cluttered.
How to Use the Indicator:
Setup:
Configure RSI by choosing the source and setting the length to match your trading style.
Set the zigzag and confirm lengths for appropriate pivot detection.
Trend Analysis:
Monitor the RSI for trend changes using the colored trend lines and labels.
Divergence Detection:
Look for RSI and price divergences to anticipate potential reversals or continuations.
Breakout/Breakdown:
Use these signals in conjunction with "Waldo RSI Overlay :o" for price action confirmation.
Overbought/Oversold:
Identify when the market might be due for a correction or continued momentum.
Moving Averages:
Focus on the color changes in RSI to understand macro trend shifts with the default 50/200 period setup.
Ghost Lines:
Enable for a cleaner chart if you don't need trend lines extending indefinitely.
Usage Tips:
Combine with other indicators for confirmation, as no single tool is foolproof.
Adjust settings to suit different market conditions or trading timeframes.
Use in tandem with "Waldo RSI Overlay :o" for a full trading signal system.
Remember, trading involves significant risk, and historical data does not guarantee future performance. Use this indicator as part of a broader trading strategy.

Waldo RSI Overlay :oWaldo RSI Overlay :o Indicator Guide
Welcome to the guide for the Waldo RSI Overlay :o indicator on TradingView. This tool enhances your trading analysis through RSI-based overlays for trend analysis, divergence detection, and breakout/breakdown signals when used with its companion indicator, Waldo RSI :o.
Key Features:
RSI Overlay:
• RSI Source: Choose from:
o ON RSI: Uses the RSI values directly to detect pivots, focusing on RSI highs and lows for trend analysis.
o ON HIGH, ON CLOSE, ON LOW, ON OPEN:
These options base pivot detection on price action at those specific points, offering an alternative market structure view.
• RSI Settings:
o Source: Default is (H+L)/2, but you can select any price for RSI calculation.
o Length: Default RSI length is 7, which you can adjust for sensitivity.
Trend Lines:
• Show Trend Lines: Toggle to display trend lines based on pivot points.
• Zigzag Length: Sets the sensitivity of pivot point detection.
• Confirm Length: Ensures the validity of pivot points (default is 3).
• Colors: Customize colors for Higher Highs (HH), Lower Highs (LH), Higher Lows (HL), and Lower Lows (LL).
• Transparency and Line Width: Control how trend lines and fills appear.
• Label Size: Adjust the size of labels identifying pivot points.
Divergences:
• Classic Divergences:
o Show Classic Div: Enable to highlight regular divergences where price and RSI move in opposite directions.
o Colors: Define colors for bullish and bearish divergence lines and labels.
o Transparency and Line Width: Adjust the visual impact of divergence signals.
• Hidden Divergences:
o Similar settings as classic, but these highlight divergences indicating trend continuation.
Breakout/Breakdown:
• Show Breakout/Breakdown: When activated, this feature signals when the price breaks through previous highs or lows. To activate these breakouts, you need the companion indicator Waldo RSI :o, select the SRC in the External section, and select the crossovers for each one.
This combination provides RSI confirmation for breakout/breakdown events.
Overbought/Oversold Zones:
• Show Overbought and Oversold Zones: Bars are colored when RSI exceeds 70 (purple) or falls below 30 (blue), indicating potential market extremes.
Moving Averages (Optional):
• Show Moving Averages: Option to overlay two moving averages for trend confirmation.
• Source, Type, Length: Customize each MA's configuration.
Ghost Lines (Optional):
• Ghost Lines: When enabled, trend lines extend for only a specified period (Ghost Length) instead of indefinitely.
How to Use the Indicator:
1. Setup:
o Configure RSI settings by choosing the RSI Source and adjusting the RSI Length to suit your trading style.
o Set the Zigzag Length and Confirm Length for trend line sensitivity based on market volatility.
2. Trend Analysis:
o Look at the colored horizontal lines and fills for HH, LH, HL, LL to discern market structure and potential reversal points.
3. Divergence Detection:
o Identify divergences where price and RSI diverge. Regular divergences might signal trend exhaustion, while hidden ones could indicate trend persistence.
4. Breakout/Breakdown Signals:
o Ensure you have both the Waldo RSI Overlay :o and Waldo RSI :o indicators applied. Green triangles below bars signal breakouts; red ones above indicate breakdowns, based on price movement with RSI confirmation from the companion indicator.
5. Overbought/Oversold:
o Use these colored zones to spot potential momentum shifts or reversal areas.
6. Moving Averages on RSI:
o If used, these can help confirm trends or identify crossover signals for additional trade confirmation.
7. Ghost Lines:
o For a less cluttered chart, enable this to limit how far trend lines extend.
Tips for Usage:
• Always combine this indicator with other analytical tools for better confirmation. No single indicator should guide all decisions.
• Adjust settings according to the asset's behavior and your trading timeframe.
• Regularly review your settings as market dynamics change.
Remember, trading involves risk, and past performance doesn't predict future outcomes. Use this indicator within a comprehensive trading strategy.

EMA with Bar Count
---
### **Key Features and Functionalities**
#### 1. **Multi-Timeframe Exponential Moving Averages (EMA)**
- The script calculates and plots EMAs for various timeframes (e.g., 1 minute, 5 minutes, 60 minutes, daily, and custom intervals).
- Users can customize the length and resolution of each EMA using inputs.
- Different colors are assigned to each EMA for easy identification on the chart.
#### 2. **Background Coloring**
- Optional background coloring (`bgcolor`) indicates whether the current price is above or below the 1-hour 20 EMA.
- Green indicates the price is above, and red indicates the price is below the EMA.
#### 3. **Bar Count Labeling**
- The script tracks bar counts and displays labels at specific intervals (e.g., every 3 bars).
- Label size and text color can be customized through user inputs.
#### 4. **Inside and Outside Bar Detection**
- Detects and highlights "Inside Bars" and "Outside Bars" on the chart.
- **Inside Bar**: The current bar's high and low are within the previous bar's range.
- **Outside Bar**: The current bar's range exceeds the previous bar's range.
- These patterns are marked with shapes for visual identification.
#### 5. **Bullish/Bearish Candle Streaks**
- Identifies and marks streaks of three consecutive bullish or bearish candles.
- **Bullish Streaks**: Marked with green shapes above the bar.
- **Bearish Streaks**: Marked with red shapes above the bar.
#### 6. **Time-Based Marking**
- The script includes an option to highlight specific time intervals (e.g., 7:30 AM) with a colored vertical line or background shading.
- Configurable time inputs allow flexibility.
#### 7. **Micro Gap Detection**
- Highlights gaps between the opening price of the current bar and the closing price of the previous bar.
- Blue shapes indicate bullish gaps.
- Purple shapes indicate bearish gaps.
#### 8. **TR (Trading Range) Detection**
- Identifies bars with significant overlap based on a user-defined threshold.
- Displays "TR" labels when overlap conditions are met.
#### 9. **Bar Coloring**
- Optionally colors bars based on specific conditions:
- Green: Bullish breakout (high and low higher than the previous bar, closing above the midpoint).
- Red: Bearish breakout (high and low lower than the previous bar, closing below the midpoint).
#### 10. **50% Midpoint Line**
- Displays a horizontal line at the 50% midpoint of the bar's range, customizable for the current or last bar only.
#### 11. **Pattern Detection**
- Recognizes specific candlestick patterns (e.g., IOI, OII, IOO).
- Provides alerts for detected patterns or predefined thresholds.
#### 12. **Alerts**
- Configurable alerts for:
- Specific patterns (e.g., IOI, OII, IOO).
- Bar range exceeding a user-defined threshold.
- Bullish or bearish streaks.
#### 13. **Gap Detector**
- Identifies gaps between bars and marks them with shaded boxes.
- Bullish gaps are shaded green, while bearish gaps are shaded red.
#### 14. **Advanced Customization**
- Extensive user inputs allow traders to tailor the indicator to their trading style.
- Includes support for various levels of detail (e.g., debug mode, label visibility, etc.).
#### 15. **ZigZag and Wedge Patterns**
- Optional zigzag lines to connect swing highs and lows.
- Detects wedge patterns using customizable settings for pivot points and angle differences.
---
### **Use Case Scenarios**
1. **Trend Identification**: Use multi-timeframe EMAs to confirm overall market direction.
2. **Range Trading**: Trade within ranges using detected inside and outside bars as key levels.
3. **Breakout Trading**: Use patterns like IOI and OII to anticipate breakouts.
4. **Scalping**: Exploit bullish and bearish streaks or micro gaps for quick trades.
5. **Pattern-Based Alerts**: Set up alerts for specific market conditions or candlestick patterns.
### **Why This Indicator Is Useful**
- Combines multiple trading tools into a single, customizable script.
- Saves time by automating complex calculations and pattern detections.
- Improves decision-making with clear visual cues and configurable alerts.
Let me know if you'd like any additional explanations or adjustments!

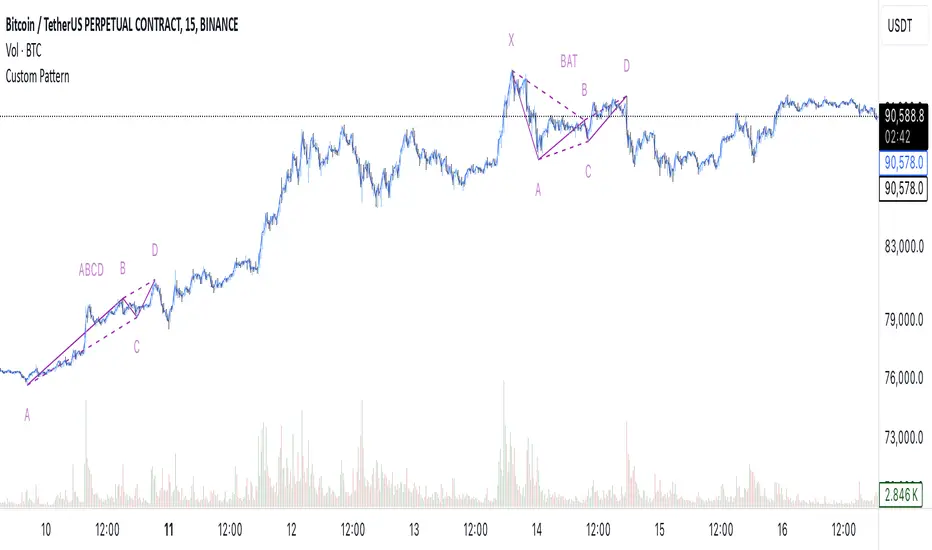
[EmreKb] Custom PatternCustom Pattern
With this indicator, you can create and display as many patterns as you want on the chart. The indicator works by taking two inputs. We can start the explanation by describing these inputs.
Inputs
Zigzag Length: Length for zigzag legs.
Patternscript Code: Patternscript code. (But what is patternscript?)
Explanation Of Patternscript
Patternscript (it's a completely fictional script language) is a scripting language that allows you to write your own patterns, and it operates within Pinescript). Let's take a look at the syntax of this language.
{
(, )
}
...
This means that the Fibonacci levels drawn from the from_point to the to_point must have the target_point between the min_fib_level and max_fib_level .
Let's see a few practical examples.
Patternscript Code For ABCD Pattern
ABCD{
ABC(0.618, 0.886)
BCD(1.272, 1.618)
}
ABC(0.618, 0.886): Fibonacci drawn from the A to B, must have the C between the 0.618 and 0.886
BCD(1.272, 1.618): Fibonacci drawn from the B to C, must have the D between the 1.272 and 1.618
Patternscript Code For Multiple Pattern
BAT{
XAB(0.382, 0.5)
ABC(0.382, 0.886)
BCD(1.618, 2.618)
XAD(0.382, 0.886)
}
ABCD{
ABC(0.618, 0.886)
BCD(1.272, 1.618)
}
Notes:
You can set the pattern name as you like, this is not related to the pattern rules.
There is no limit for pattern count, but remember pine limits.
Price Action Toolkit Lite [UAlgo]The Price Action Toolkit Lite is a comprehensive indicator designed to enhance your chart analysis with advanced price action tools. This powerful toolkit combines multiple technical analysis concepts to provide traders with a clear visualization of market structure, liquidity levels, order blocks, and trend lines. By integrating these elements, the indicator aims to offer a holistic view of price action, helping traders identify potential entry and exit points, as well as key levels of interest in the market.
🔶 Key Features
Market Structure Analysis: The indicator includes a ZigZag feature to highlight significant market highs and lows, aiding in the visualization of market structure changes and trends.
Liquidity Sweeps Detection: It identifies and displays liquidity sweeps, which are crucial for recognizing potential market reversals and areas of interest where significant price action is likely to occur.
Order Blocks: Automatically detects and draws order blocks, highlighting areas of institutional buying and selling pressure, which can serve as key support and resistance levels.
Trend Lines: The toolkit can draw and extend trend lines based on pivot points, providing a clear view of prevailing market trends and potential breakout points.
Customizable Settings: Users can adjust various settings, including the length of the ZigZag, liquidity detection sensitivity, the number of order blocks to display, and trend line detection parameters, allowing for a tailored analysis experience.
🔶 Disclaimer
The "Price Action Toolkit Lite " is intended for educational and informational purposes only.
It is not financial advice and should not be construed as such. Trading in financial markets involves substantial risk, including the risk of loss.
Past performance is not indicative of future results.
🔷 Similar Scripts

HH LL HL LH MarkerHH LL HL LH Marker
The "HH LL HL LH Marker" is a versatile technical analysis tool designed to help traders identify and visualize key pivot points in price action. It highlights four types of pivot points: Higher High (HH), Lower Low (LL), Higher Low (HL), and Lower High (LH), aiding in spotting potential trend reversals or continuations.
Features:
Customizable Inputs: Adjust the number of bars to look back on for pivot calculation, and choose which pivot types to display.
ZigZag Line: Optionally display a ZigZag line connecting the identified pivot points for a clearer visualization of price swings.
Visual Marker: Each pivot point type is marked with a distinct label, making it easy to identify on the chart.
How to Use:
Higher High (HH): Indicates when the current high is higher than the previous two highs, suggesting potential upward momentum.
Lower Low (LL): Signals when the current low is lower than the previous two lows, indicating potential downward momentum.
Higher Low (HL): Marks a higher low compared to the two previous lows, potentially signaling a bullish trend reversal.
Lower High (LH): Identifies a lower high compared to the two previous highs, potentially indicating a bearish trend reversal.
Usage Tips:
Combine with other technical indicators or chart patterns for comprehensive analysis.
Adjust input parameters according to the timeframe and asset being traded for optimal performance.
Note: This indicator is for educational purposes only and should be used alongside other tools and analysis techniques for making informed trading decisions.

ICT Silver Bullet with signals
The "ICT Silver Bullet with signals" indicator (inspired from the lectures of "The Inner Circle Trader" (ICT)),
goes a step further than the ICT Silver Bullet publication, which I made for LuxAlgo :
• uses HTF candles
• instant drawing of Support & Resistance (S/R) lines when price retraces into FVG
• NWOG - NDOG S/R lines
• signals
The Silver Bullet (SB) window which is a specific 1-hour interval where a Fair Value Gap (FVG) pattern can be formed.
When price goes back to the FVG, without breaking it, Support & Resistance lines will be drawn immediately.
There are 3 different Silver Bullet windows (New York local time):
The London Open Silver Bullet (03 AM — 04 AM ~ 03:00 — 04:00)
The AM Session Silver Bullet (10 AM — 11 AM ~ 10:00 — 11:00)
The PM Session Silver Bullet (02 PM — 03 PM ~ 14:00 — 15:00)
🔶 USAGE
This technique can visualise potential support/resistance lines, which can be used as targets.
The script contains 2 main components:
• forming of a Fair Value Gap (FVG)
• drawing support/resistance (S/R) lines
🔹 Forming of FVG
When HTF candles forms an FVG, the FVG will be drawn at the end (close) of the last HTF candle.
To make it easier to visualise the 2 HTF candles that form the FVG, you can enable
• SHOW -> HTF candles
During the SB session, when a FVG is broken, the FVG will be removed, together with its S/R lines.
The same goes if price did not retrace into FVG at the last bar of the SB session
Only exception is when "Remove broken FVG's" is disabled.
In this case a FVG can be broken, as long as price bounces back before the end of the SB session, it will remain to be visible:
🔹 Drawing support/resistance lines
S/R target lines are drawn immediately when price retraces into the FVG.
They will remain updated until they are broken (target hit)
Potential S/R lines are formed by:
• previous swings (swing settings (left-right)
• New Week Opening Gap (NWOG): close on Friday - weekly open
• New Day Opening Gap (NWOG): close previous day - current daily open
Only non-broken lines are included.
Broken =
• minimum of open and close below potential S/R line
• maximum of open and close above potential S/R line
NDOG lines are coloured fuchsia (as in the ICT lectures), NWOG are coloured white (darkmode) or black (lightmode ~ ICT lectures)
Swing line colour can be set as desired.
Here S/R includes NDOG lines:
The same situation, with "Extend Target-lines to their source" enabled:
Here with NWOG lines:
This publication contains a "Minimum Trade Framework (mTFW)", which represents the best-case expected price delivery, this is not your actual trade entry - exit range.
• 40 ticks for index futures or indices
• 15 pips for Forex pairs
The minimum distance (if applicable) can be shown by enabling "Show" - "Minimum Trade Framework" -> blue arrow from close to mTFW
Potential S/R lines needs to be higher (bullish) or lower (bearish) than mTFW.
🔶 SETTINGS
(check USAGE for deeper insights and explanation)
🔹 Only last x bars: when enabled, the script will do most of the calculations at these last x candles, potentially this can speeds calculations.
🔹 Swing settings (left-right): Sets the length, which will set the lookback period/sensitivity of the ZigZag patterns (which directs the trend and points for S/R lines)
🔹 FVG
HTF (minutes): 1-15 minutes.
• When the chart TF is equal of higher, calculations are based on current TF.
• Chart TF > 15 minutes will give the warning: "Please use a timeframe <= 15 minutes".
Remove broken FVG's: when enabled the script will remove FVG (+ associated S/R lines) immediately when FVG is broken at opposite direction.
FVG's still will be automatically removed at the end of the SB session, when there is no retrace, together with associated S/R lines,...
~ trend: Only include FVG in the same direction as the current trend
Note -> when set 'right' (swing setting) rather high ( > 3), he trend change will be delayed as well (default 'right' max 5)
Extend: extend FVG to max right side of SB session
🔹 Targets – support/resistance
Extend Target-lines to their source: extend lines to their origin
Colours (Swing S/R lines)
🔹 Show
SB session: show lines and labels of SB session (+ colour)
• Labels can be disabled separately in the 'Style' section, colour is set at the 'Inputs' section
Trend : Show trend (ZigZag, coloured ~ trend)
HTF candles: Show the 2 HTF candles that form the FVG
Minimum Trade Framework: blue arrow (if applicable)
🔶 ALERTS
There are 4 signals provided (bullish/bearish):
FVG Formed
FVG Retrace
Target reached
FVG cancelled
You can choose between dynamic alerts - only 1 alert needs to be set for all signals, or you can set specific alerts as desired.
💜 PURPLE BARS 😈
• Since TradingView has chosen to give away our precious Purple coloured Wizard Badge, bars are coloured purple 😊😉

Harmonic PatternsHarmonic Patterns
Harmonic Pattern utilizes the recognition of specific structures that possess distinct and consecutive Fibonacci ratio alignments that quantify and validate harmonic patterns. These patterns calculate the Fibonacci aspects of these price structures to identify highly probable reversal points in the financial markets. This methodology assumes that harmonic patterns, like many patterns and cycles in life, continually repeat.
Input Parameters:
Zigzag Setup:
These group of parameters are used to identify the swing points. The script also draws the Zigzag line and swing labels based on these parameters.
Harmonic Pattern Setup:
Ignore XD leg calculations – Optionally one can choose to ignore the XD leg calculation.
Fixed value leg offset % - Fixed value leg parameters are such parameters where single value Fibonacci value is used. This makes pattern identification very rare. To overcome this one can input % value which would be used to derive the range of Fibonacci numbers for pattern identification. E.g. XD leg in Bat pattern has fixed leg of 88.6%, If we input 5% as fixed value leg offset % then instead of fixed value of 88.6%, script calculates range as 88.6% + 5% (Value 1) and 88.6% - 5% (Value 2) and uses the same for pattern identification.
The script plots a diamond shape label on the last candle of the chart. The label has been enabled with a tooltip which shows number of patterns of each type along with the time where latest pattern is located.
This script covers harmonic patterns listed in the table below. Each harmonic pattern has bullish and bearish variants. All these patterns have 4 legs known as XABCD.
The Patterns have been configured as specified in the table below. Refer to Figure 1 and Figure 2 to understand how to read and interpret the table.
Figure 1
Figure 2

ICT Silver Bullet [LuxAlgo]The ICT Silver Bullet indicator is inspired from the lectures of "The Inner Circle Trader" (ICT) and highlights the Silver Bullet (SB) window which is a specific 1-hour interval where a Fair Value Gap (FVG) pattern can be formed.
When a FVG is formed during the Silver Bullet window, Support & Resistance lines will be drawn at the end of the SB session.
There are 3 different Silver Bullet windows (New York local time):
The London Open Silver Bullet (3 AM — 4 AM ~ 03:00 — 04:00)
The AM Session Silver Bullet (10 AM — 11 AM ~ 10:00 — 11:00)
The PM Session Silver Bullet (2 PM — 3 PM ~ 14:00 — 15:00)
🔶 USAGE
The ICT Silver Bullet indicator aims to provide users a comprehensive display as similar as possible to how anyone would manually draw the concept on their charts.
It's important to use anything below the 15-minute timeframe to ensure proper setups can display. In this section, we are purely using the 3-minute timeframe.
In the image below, we can see a bullish setup whereas a FVG was successfully retested during the Silver Bullet session. This was then followed by a move upwards to liquidity as our target.
Alternatively, you can also see below a bearish setup utilizing the ICT Silver Bullet indicator outlined.
At this moment, the indicator has removed all other FVGs within the Silver Bullet session & has confirmed this FVG as the retested one.
There is also a support level marked below to be used as a liquidity target as per the ICT Silver Bullet concept suggests.
In the below chart we can see 4 separate consecutive examples of bullish & bearish setups on the 3-minute chart.
🔶 CONCEPTS
This technique can visualize potential support/resistance lines, which can be used as targets.
The script contains 2 main components:
• forming of a Fair Value Gap (FVG)
• drawing support/resistance (S/R) lines
🔹 Forming of FVG
1 basic principle: when a FVG at the end of the SB session is not retraced, it will be made invisible.
Dependable on the settings, different FVG's will be shown.
• 'All FVG': all FVG's are shown, regardless the trend
• 'Only FVG's in the same direction of trend': Only FVG's are shown that are similar to the trend at that moment (trend can be visualized by enabling ' Show ' -> ' Trend ')
-> only bearish FVG when the trend is bearish vs. bullish FVG when trend is bullish
• 'strict': Besides being similar to the trend, only FVG's are shown when the closing price at the end of the SB session is:
– below the top of the FVG box (bearish FVG)
– above bottom of the FVG box (bullish FVG)
• 'super-strict': Besides being similar to the trend, only FVG's are shown when the FVG box is NOT broken
in the opposite direction AND the closing price at the end of the SB session is:
– below bottom of the FVG box (bearish FVG)
– above the top of the FVG box (bullish FVG)
' Super-Strict ' mode resembles ICT lectures the most.
🔹 Drawing support/resistance lines
When the SB session has ended, the script draws potential support/resistance lines, again, dependable on the settings.
• Previous session (any): S/R lines are fetched between current and previous session.
For example, when current session is ' AM SB Session (10 AM — 11 AM) ', then previous session is
' London Open SB (3 AM — 4 AM) ', S/R lines between these 2 sessions alone will be included.
• Previous session (similar): S/R lines are fetched between current and previous - similar - session.
For example, when current session is ' London Open SB (3 AM — 4 AM)' , only S/R lines between
current session and previous ' London Open SB (3 AM — 4 AM) ' session are included.
When a new session starts, S/R lines will be removed, except when enabling ' Keep lines (only in strict mode) '
This is not possible in ' All FVG ' or ' Only FVG's in the same direction of trend ' mode, since the chart would be cluttered.
Note that in ' All FVG ' or ' Only FVG's in the same direction of trend ' mode, both, Support/Resistance lines will be shown,
while in Strict/Super-Strict mode:
• only Support lines will be shown if a bearish FVG appears
• only Resistance lines if a bullish FVG is shown
The lines will still be drawn the the end of the SB session, when a valid FVG appears,
but the S/R lines will remain visible and keep being updated until price reaches that line.
This publication contains a "Minimum Trade Framework (mTFW)", which represents the best-case expected price delivery, this is not your actual trade entry - exit range.
• 40 ticks for index futures or indices
• 15 pips for Forex pairs.
When on ' Strict/Super-Strict ' mode, only S/R lines will be shown which are:
• higher than the lowest FVG bottom + mTFW, in a bullish scenario
• lower than the highest FVG bottom - mTFW, in a bearish scenario
When on ' All FVG/Only FVG's in the same direction of trend ' mode, or on non-Forex/Futures/Indices symbols, S/R needs to be higher/lower than SB session high/low.
🔶 SETTINGS
(Check CONCEPTS for deeper insights and explanation)
🔹 Swing settings (left): Sets the length, which will set the lookback period/sensitivity of the Zigzag patterns (which directs the trend)
🔹 Silver Bullet Session; Show SB session: show lines and labels of SB session
Labels can be disabled separately in the ' Style ' section, color is set at the ' Inputs ' section.
🔹 FVG
– Mode
• All FVG
• Only FVG's in the same direction of trend
• Strict
• Super-Strict
– Colors
– Extend: extend till last bar of SB session
🔹 Targets – support/resistance lines
– Previous session (any): S/R lines fetched between current and previous SB session
– Previous session (similar): S/R lines fetched between current and previous similar SB session
– Colors
– Keep lines (only in strict mode)
🔹 Show
– MSS ~ Session: Show Market Structure Shift , only when this happens during a SB session
– Trend: Show trend (Zigzag, colored ~ trend)

Elliott Wave [LuxAlgo]The Elliott Wave indicator allows users to detect Elliott Wave (EW) impulses as well as corrective segments automatically on the chart. These are detected and displayed serially, allowing users to keep track of the evolution of an impulse or corrective wave.
Fibonacci retracements constructed from detected impulse waves are also included.
This script additionally allows users to get alerted on a wide variety of trigger conditions (see the ALERTS section below).
🔶 SETTINGS
🔹 Source
• "high" -> options high, close, maximum of open/close
• "low" -> options low, close, minimum of open/close
🔹 ZigZag
• The source and length are used to check whether a new Pivot Point is found.
Example:
• source = high/low, length = 10:
• There is a new pivot high when:
- previous high is higher than current high
- the highs of 10 bars prior to previous high are all lower
• These pivot points are used to form the ZigZag lines, which in their turn are used for pattern recognition
🔶 USAGE
The basic principles we use to identify Elliott Wave impulses are:
• A movement in the direction of the trend ( Motive/Impulse wave ) is divided in 5 waves (Wave 1 -> 5)
• The Corrective Wave (against the trend) is divided in 3 waves (Wave A -> C)
• The waves can be subdivided in smaller waves
• Wave 2 can’t retrace more than the beginning of Wave 1
• Wave 4 does not overlap with the price territory of Wave 1
Here we see an example:
Let's look at the development:
• 1 bar after point (5) a confirmed 5 Motive Wave pattern is found (1 -> 5; The 5 Waves can also be seen as one large Wave 1 ).
• Next, the script draws a set of Fibonacci lines, which are area's where the Corrective Wave potentially will bounce.
Here we see the fifth wave is getting larger, the previous highest point is updated, and the Wave 5 is larger than Wave 3 :
(At this point, the pattern is invalidated, and it display as dotted)
Further progression in time:
At this point, a confirmed " 3 Corrective Wave pattern " is found (a -> c)
When a new high has developed, a circle is drawn (in the same color of the lines)
However, when the bottom of the drawn box has breached, a red cross will be visualized.
Further progression:
Later on, a bearish confirmed " 5 Motive Wave pattern " is found (1 -> 5):
When a Corrective Wave becomes invalidated, the ABC pattern will display as dashed (not dotted):
🔶 TECHNIQUES
Pine Script™ introduces methods!
• More information can be found here:
• Pine Script™ v5 User Manual 👉 Methods
• Pine Script™ language reference manual 👉 method
🔶 ALERTS
Dynamic alerts are included in the script, you only need to set 1 alert to receive following messages:
• When a new EW Motive Pattern is found (Bullish/Bearish )
• When a new EW Corrective Pattern is found (Bullish/Bearish )
• When an EW Motive Pattern is invalidated (Bullish/Bearish )
• When an EW Corrective Pattern is invalidated (Bullish/Bearish )
• When possible, a start of a new EW Motive Wave is found (Bullish/Bearish )
• Here is information how you can set these alerts()

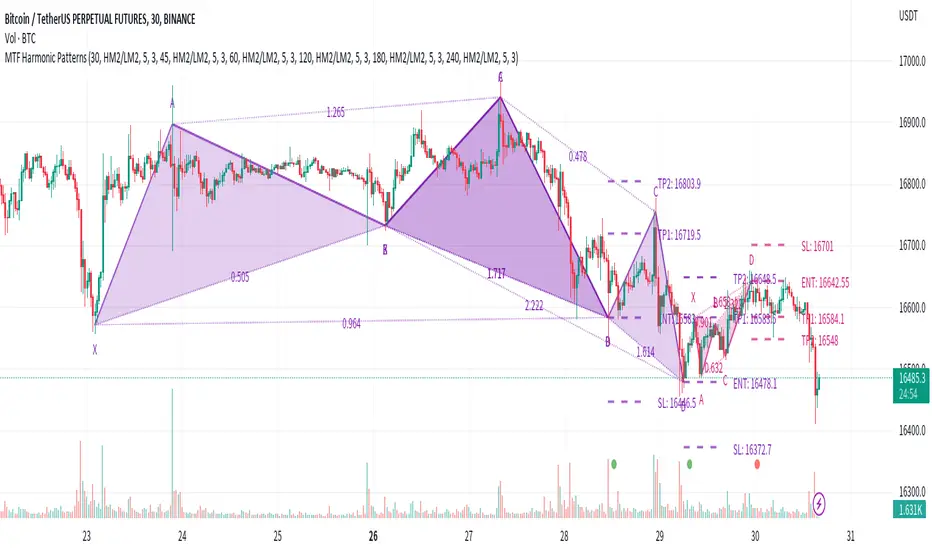
Multi-timeframe Harmonic PatternsHello friends. In recent months I have been busy with my academic research and haven't had much time to publish new scripts. To fill the gap of these months, I decided to publish the indicator Multi-timeframe Harmonic Patterns . Harmonic technical chart patterns can predict the next price trend and provide traders with clues to the price direction, which is one of the indicators widely used by professional traders.
(1) Indicator description
This indicator is built on ZigZag Multi Time Frame with Fibonacci Retracement@LonesomeTheBlue . Thanks to LonesomeTheBlue for contributing the awesome indicator
The indicator supports 6 different timeframes , and 25 different harmonic patterns
This indicator supports indicating key indicator prices: entry price, stop loss price, and two take profit prices
(2) Key parameters
timeframe resolution: The timeframe of the harmonic pattern
pivot high/low source: Calculation method of high/low pivot points
timeframe pivot period: Minimum period of high/low pivot points
delay for confirmations: Wait for N candles to confirm the chart pattern
bullish/bearish colors: Bullish/bearish pattern colors
enable harmonic patterns: Enable current harmonic patterns
show harmonic patterns: Show harmonic patterns found
show trading prices of patterns: Show key prices of harmonic patterns
(3) Supported Patterns:
Gartlay
Cypher
Bat
Deepcrab
Crab
Butterfly
Shark
0-5
AB=CD
3-Drives
Anti-Gartlay
Anti-Cypher
Anti-Bat
Anti-Crab
Anti-Butterfly
Anti-Shark
Black-Swan
White-Swan
Descending-Triangle
Ascending-Triangle
Symmetrical-Triangle
Headers&Shoulders
Inverse-Headers&Shoulders
Double-Top
Double-Bottom
————————————————————————————————————————
各位朋友大家好。最近几个月我忙于自己的学术研究没有过多时间更新脚本。为弥补这几个月的空缺,我决定发布该 多时间周期的谐波指标 。谐波技术图表形态在一定程度上可以预测下一个价格走势,为交易者提供价格方向的线索,是广大专业交易人员广泛使用的指标之一。
(1) 指标说明
该指标建立于 ZigZag Multi Time Frame with Fibonacci Retracement@LonesomeTheBlue ,感谢LonesomeTheBlue贡献的出色指标
该指标支持 6种不同的时间周期 ,以及 25种不同的谐波形态
该指标支持指示关键的指标价格:入场价格、止损价格、以及两种止盈价格
(2) 关键参数
timeframe resolution: 谐波形态的时间周期
pivot high/low source: 高/低枢纽点的计算方式
timeframe pivot period: 高/低枢纽点的最小周期
delay for confirmations: 等待N个蜡烛以确认图表形态
bullish/bearish colors: 看涨/看跌的形态颜色
enable harmonic patterns: 使能当前的谐波形态
show harmonic patterns: 显示被发现的谐波形态
show trading prices of patterns: 显示谐波形态的关键价格
(3) 支持形态:
Gartlay
Cypher
Bat
Deepcrab
Crab
Butterfly
Shark
0-5
AB=CD
3-Drives
Anti-Gartlay
Anti-Cypher
Anti-Bat
Anti-Crab
Anti-Butterfly
Anti-Shark
Black-Swan
White-Swan
Descending-Triangle
Ascending-Triangle
Symmetrical-Triangle
Headers&Shoulders
Inverse-Headers&Shoulders
Double-Top
Double-Bottom
Zig Zag+ (Macro + Internal Structure Tool)ZigZag+ (Macro + Internal Structure Tool)
ZigZag+ is a simple tool that helps traders to clearly identify and differentiate between macro and internal market structure, to help you keep your bearings of where you are currently in the overall picture.
It is especially difficult to keep your bearings within the larger structural trend when trading the lower timeframes, where for example, a bearish structural trend on a lower timeframe may simply be a retracement of an overall bullish structural trend on a higher timeframe. This indicator primarily aims to help traders maintain awareness of where they are in relationship to the higher timeframe / 'macro' structural trend, and their most significant swing point highs and lows.
The features of this indicator include:
- 2x Zig Zag lines drawn automatically onto your chart. One which has a longer length than the other, which can be used to help identify and differentiate the larger price swings from the smaller price swings found within it. Enabled by default.
- Customisable Zig Zag line color & width settings to help clearly differentiate the higher timeframe 'macro structure' apart from the lower timeframe 'internal structure' within it, enabling it to be tailored to suit your chart colour theme and personal preference.
- Customisable individual length settings for the 2x Zig Zag lines, to allow the fine tuning of each line to any timeframe and asset. By default one lines length is set to a higher value than the other, to illustrate a macro structure (higher length value) as well as the 'internal structure' (lower value length), seen within the larger macro structure.
- Up to a maximum of 500 lines can be drawn meaning you can zoom out considerably, and view historical price action with both Zig Zag lines continuing to print.
- Custom alerts for identifying candlesticks that can offer optimal entries where they are found within valid price markups or markdowns that are already underway. Further details can be found within the tooltips for these signals.
Note: The above list of features are accurate at the time of publishing, but may be updated or added to in future.
Structure
Understanding structure is arguably the foundation of all trading strategies, and therefore very important to understand where you are exactly in the bigger picture, since it can help identify levels at which there is a higher probability of price moving either upward or downward at a given point. Structural trend refers to the typical way that price tends to move in any given trending market, identified by the continuation of higher highs and higher lows in a typical bullish trending market, and lower highs and lower lows in a bearish trending market.
During other times price may not be trending in this way, for example when it is undergoing accumulation or distribution phases, where the consistent higher high & lower low / lower high and lower low patterns will not be evident.
What is Macro Structure?
Macro trend structure refers to the structural trend seen on higher timeframe charts.
What is Internal Structure?
Internal trend structure refers to the structural trend seen on lower timeframe charts, which is found within the higher timeframe structure.
Disclaimer: This indicator is adapted from an original script authored by Tr0sT . With special thanks.

Quasimodo Pattern by EmreKbThis indicator show the quasimodo patterns on the chart. Quasimodo pattern (QML) is the reversal pattern. This looks like head and shoulder pattern but this have two difference. On the quasimodo, second neck should be lower/higher (lower for the bearish, higher for the bullish) and quasimodo has no second shoulder. Usually QML line is an entry and head point is a stoplos.
Zigzag length is a length for the zigzag calculation.

WWV_LB pivotfix histogram jayy
This is a modification of LazyBear's WWV_LB which plots cumulative volume of waves. The reversal points are defined through relative closing prices. I made adjustments to the script to show waves turning on actual/true low or high pivots as opposed to the bar/candle identified in the LazyBear script. What I mean by that is that the actual/true low or high pivots are in fact the true WWV_LB pivots. The original WWV_LB script calculates cumulative volume from reversal confirmation bar to reversal confirmation bar as opposed to the true WWV_LB pivot bar to pivot bar. As such the waves can have slightly different start and end points. As such the cumulative volume can also be different from te WWV_LB script. This is because confirmation of a wave reversal can lag a few bars after the true reversal pivot bar. In the script notes, you will see the original key WWV_LB script lines that identify the true high or low pivots and confirm the wave direction has reversed. I have taken these lines from LazyBear's original script. I have included the LazyBear script within the script notes so that the original can be compared to what I have added/changed. Instead of "trendDetectionLength" I have inserted "Trend Detection Length". You can of course change the descriptor to what you wish by editing script line 33 to the original term or whatever you wish. You might also wish to set the default to the value "2" as per the original script. I have set the default to "3". This script should be used in conjunction with "WWV-LB zigzag pivot fix jayy" script which is shown on this screen for comparison.
Here is a link to the original LazyBear histogram script which can be used for comparison. The differences are subtle, however, the histograms will regularly be different by a bar or two:
The lowest panel has the original LazyBear WWV_LB script for comparison. All three scripts have been set to a Trend Detection Length of 3.jayy

Weis Pip Wave jayyWhat you see here is the Weis pip wave. The Weis pip wave shows how far in price a Weis wave has traveled through the duration of a Weis wave. The Weis pip wave is used in combination with the Weis cumulative volume wave. The two waves must be set to the same "wave size" and using the same method as described by Weis.
Using the traditional Weis method simply enter the desired wave size in the box "Select Weis Wave Size". In the example shown, it is set to 5 points. Each wave for each security and each timeframe requires its own wave size. Although not the traditional method a more automatic way to set wave size would be to use ATR. This is not the true Weis method but it does give you similar waves and, importantly, without the hassle of selecting a wave size for every chart. Once the Weis wave size is set then the pip wave will be shown.
I have put a zigzag of a 5 point Weis wave on the above bar chart. I have added it to allow your eye to get a better appreciation for Weis wave pivot points. You will notice that the wave is not in straight lines connecting wave tops to bottoms this is a function of the limitations of Pinescript version 1. This script would need to be in version 4 to allow straight lines. I will elaborate on the Weis pip zigzag script.
What is a Weis wave? David Weis has been recognized as a Wyckoff method analyst he has written two books one of which, Trades About to Happen, describes the evolution of the now popular Weis wave. The method employed by Weis is to identify waves of price action and to compare the strength of the waves on characteristics of wave strength. Chief among the characteristics of strength is the cumulative volume of the wave. There are other markers that Weis uses as well for example how the actual price difference between the start of the Weis wave from start to finish. Weis also uses time, particularly when using a Renko chart. Weis specifically uses candle/bar closes to define all wave action.
David Weis did a futures.io video which is a popular source of information about his method.
Cheers jayy
PS This script was published a day ago, however, I had included some links to the website of a person that uses Weis pip waves and also a dropbox link that contains the Weis wave chart for May 27, 2020, published by David Weis. Providing those links is against TV policy and so the script was hidden by TV. This is the identical script with the identical settings but without the offending links. If you want to see the pip Weis method in practice then search Weis pip wave. I have absolutely no affiliation. If you want to see Weis chart in pdf then message me and I will give a link or the Weis pdf. Why would you want to see the Weis chart for May 27, 2020? Merely to confirm the veracity of my algorithm. You could compare my chart () from the same period to the Weis chart. Both waves are for the ES!1 4 hour chart and both for a wave size of 5.

ZigiTrendThis indicator is a hybrid of super trend and percent zigzag of Ricardo Santos
The trend up seem by green dots
Trend down seen by red dots
and the zigzag line red or green
I Set this one for 1 hour chart , try to play with settings for better optimization
So it nice system to detect trends
Happy new year to all members of TradingView

[ICT] [SMC] True Market Structure [TDT]Introduction
The True Market Structure indicator is designed to help Smart Money Concepts (SMC) and ICT traders visualize the "True" mechanical structure of the market. Unlike standard ZigZag indicators that often repaint or react to minor noise, this script utilizes a strict Fractal Swing algorithm to identify valid Highs and Lows.
It automatically maps out the market trend by distinguishing between BOS (Break of Structure) for trend continuation and CHoCH (Change of Character) for trend reversals, while highlighting the "Protected" or "Strong" structural points.
How It Works
The indicator relies on a generic fractal calculation (Swing High/Low) determined by the user-defined length.
Trend Identification: The script tracks a state machine (Bullish/Bearish).
Weak Structure (Target): In a bullish trend, the recent High is the "Weak High" (the target to break).
Strong Structure (Protected): The Low responsible for breaking the High becomes the "Strong Low."
BOS vs. CHoCH:
BOS: When price breaks a Weak High (in an uptrend), it confirms continuation.
CHoCH: When price breaks a Strong Low (in an uptrend), it signals a potential reversal.
Key Features
True Fractal Detection: Uses a centered lookback period (Input: Swing Fractal Length) to find significant pivot points.
Confirmation Modes: Choose between candle Close (more conservative, filters wicks) or High/Low (more aggressive) for structure breaks.
Structure Mapping:
Solid Lines: Represent BOS (Trend Continuation).
Dashed Lines: Represent CHoCH (Trend Reversal).
Origin Dots (Protected Levels):
These dots mark the exact swing point that caused the break.
Usage: In an uptrend, the dot marks the Strong Low. If price closes below this dot, the trend flips.
Settings Guide
Swing Fractal Length: The lookback period to define a Swing High/Low.
Default: 3 (Standard ICT Intermediate Term High/Low).
Increase this number to see higher timeframe structure (e.g., set to 10-20 for major swings).
Break Confirmation:
Close: Price body must close beyond the structure level to confirm a break.
High/Low: A wick breaking the level is sufficient.
Visuals: Toggle lines and dots on/off and customize colors to fit your chart theme.
How to Use (Trading Strategy)
Trend Following: Wait for a BOS (Solid Line). Identify the Origin Dot created by that move. This is your "Protected Low/High." Look for entries (FVG/Order Blocks) between the current price and that Dot.
Reversal Trading: Watch for a CHoCH (Dashed Line). This indicates the "Strong Structure" has failed, and the bias has shifted.
Stop Placement: The Origin Dots serve as excellent invalidation points for Stop Losses.
Disclaimer
This tool is for educational purposes and market analysis only. It does not provide financial advice or guarantee future results. Always manage your risk.

Price Action - LegsRooted in Al Brooks' leg counting philosophy from "Trading Price Action Trends," this draws zigzag lines connecting swing points: green for up legs (until low < previous low), red for down legs (until high > previous high). Updates dynamically to new extremes, with optional count labels (0 resets on stronger pivots). Visualizes twists in channels or ranges—markets always test with two legs; use for pullback entries or reversals.
