Thirdeyechart index weekly 3Index Weekly – Version 3 (Advanced Multi-Index Strength Scanner)
Index Weekly Version 3 is an advanced strength-tracking tool designed to read the market from a higher institutional perspective. This version focuses on weekly momentum, allowing traders to understand the true underlying flow behind major global indices. Instead of looking at isolated charts, this tool aggregates movements across multiple indices to reveal where strength and weakness are building on a weekly scale.
The indicator calculates percentage change for each index using a simple but precise formula:
((close – open) / open) * 100
This captures real momentum and filters out intraday noise. All values are displayed in a clean table, allowing traders to instantly see which index is gaining strength and which is losing traction.
Version 3 enhances clarity by improving layout, tightening spacing, and adding stronger visual color cues for positive and negative flows. The weekly timeframe provides a broader, more reliable view—ideal for swing traders, position traders, and anyone who wants to understand the market’s long-term direction.
This tool is especially effective when combined with technical analysis, as it shows the global pressure behind the charts. If technicals show a setup but the weekly index flow disagrees, the trade is weak. When both align, the trade becomes solid.
Disclaimer
This indicator is for educational and analytical purposes only. It does not provide financial advice or trade signals. Markets carry risk and users are responsible for their own decisions.
© 2025 Thirdeyechart. All rights reserved.
"人民币升值对A股的影响+2025"に関するスクリプトを検索

Consolidation Breakout PRO — Clean Boxes + 200 EMA Trend Filter High-probability range breakout detector that draws perfect, always-visible consolidation boxes and only alerts when price breaks out with strong volume and (optionally) in the direction of the prevailing trend.
Features
Automatically draws and extends clean consolidation boxes in real time
Boxes stop extending the moment the breakout occurs — no more “ghost” lines
Optional but powerful 200 EMA trend filter (dramatically reduces false breakouts)
Stronger volume confirmation (default 1.8× the 20-period average, fully adjustable)
Auto-deletes old boxes so your chart stays perfectly clean even after hundreds of signals
Clear “BREAKOUT ↑” and “BREAKDOWN ↓” labels + ready-to-use alerts
Works on any market and any timeframe (best on 1H, 4H, Daily)
How to trade it (edge > 65 % when used correctly)
Wait for the labeled breakout candle to close
Enter on pullback/retest of the box edge (or on strong close + retest)
Stop-loss just outside the opposite side of the box
Take-profit: minimum 1:2, ideally measured move (box height added/subtracted) or trailing with the 20 EMA
This is the cleanest and most professional public consolidation breakout tool available in 2025 — no repainting, no lag, no chart clutter.
Created and continuously improved with love for the TradingView community.

Turtle Momentum StrategyTurtle momentum strategy as per Momentum Trading Strategy article on Substack (Nov 26, 2025)

EMA 12-26-100 Momentum Strategy# Triple EMA Multi-Signal Momentum Strategy
## 📊 Overview
**Triple EMA Multi-Signal** is a comprehensive trend-following momentum strategy designed specifically for cryptocurrency markets. It combines multiple technical indicators and signal types to identify high-probability trading opportunities while maintaining strict risk management protocols.
The strategy excels in trending markets and uses adaptive position sizing with trailing stops to maximize profits during strong trends while protecting capital during choppy conditions.
## 🎯 Core Algorithm
### Triple EMA System
The strategy employs a three-layer EMA system to identify trend direction and strength:
- **Fast EMA (12)**: Quick response to price changes
- **Slow EMA (26)**: Confirmation of trend direction
- **Trend EMA (100)**: Overall market bias filter
Trades are only taken when all three EMAs align in the same direction, ensuring we trade with the dominant trend.
### Multi-Signal Confirmation (8 Signal Types)
The strategy requires at least 1-2 confirmed signals from multiple independent sources before entering a position:
1. **EMA Crossover** - Fast EMA crossing Slow EMA (primary signal)
2. **MACD Cross** - MACD line crossing signal line (momentum confirmation)
3. **RSI Reversal** - RSI bouncing from oversold/overbought zones
4. **Price Action** - Strong bullish/bearish candles (>60% of range)
5. **Volume Spike** - Above-average volume confirmation
6. **Breakout** - Price breaking 20-period high/low with volume
7. **Pullback to EMA** - Trend continuation after healthy retracement
8. **Bollinger Bounce** - Price bouncing from BB bands
This multi-signal approach significantly reduces false signals and improves win rate.
## 💰 Risk Management
### Position Sizing
- Default: 20-25% of equity per trade
- Adjustable based on risk tolerance
- Smaller positions recommended for leveraged trading
### Stop Loss & Take Profit
- **Stop Loss**: 2.0% (tight control of risk)
- **Take Profit**: 5.5% (2.75:1 reward-to-risk ratio)
- Both levels are fixed at entry to avoid emotional decisions
### Trailing Stop System
- Activates after 1.8% profit
- Trails at 1.3% below current price
- Locks in profits during extended trends
- Automatically adjusts as price moves in your favor
### Maximum Hold Time
- 36-48 hours maximum (configurable)
- Designed to minimize funding rate costs on futures
- Forces position closure to avoid excessive exposure
- Helps maintain capital velocity
## 📈 Key Features
### Trend Filters
- **ADX Filter**: Ensures sufficient trend strength (threshold: 20)
- **EMA Alignment**: All three EMAs must confirm trend direction
- **RSI Boundaries**: Avoids extreme overbought/oversold entries
### Volume Analysis
- Volume must exceed 20-period moving average
- Configurable multiplier (default: 1.0x)
- Helps identify institutional participation
### Automatic Exit Conditions
1. Take Profit target reached
2. Stop Loss triggered
3. Trailing stop activated
4. Trend reversal (EMA cross in opposite direction)
5. Maximum hold time exceeded
## 🎮 Recommended Settings
### For Spot Trading (Conservative)
```
Position Size: 15-20%
Stop Loss: 2.5%
Take Profit: 6.0%
Max Hold: 72 hours
Leverage: 1x
```
### For Futures 3-5x Leverage (Balanced)
```
Position Size: 12-15%
Stop Loss: 2.0%
Take Profit: 5.5%
Max Hold: 36 hours
Trailing: Active
```
### For Aggressive Trading 5-10x (High Risk)
```
Position Size: 8-12%
Stop Loss: 1.5%
Take Profit: 4.5%
Max Hold: 24 hours
ADX Filter: Disabled
```
## 📊 Performance Metrics
### Backtested Results (BTC/USDT 1H, 2 years)
- **Total Return**: ~19% (spot) / ~75% (5x leverage)*
- **Total Trades**: 240-300
- **Win Rate**: 49-52%
- **Profit Factor**: 1.25-1.50
- **Max Drawdown**: ~18-22%
- **Average Trade**: 0.5-3 days
*Leverage results exclude funding rates and real-world slippage
### Optimal Timeframes
- **1 Hour**: Best for active trading (recommended)
- **4 Hour**: More stable, fewer signals
- **15 Min**: High frequency (requires monitoring)
### Best Performing Assets
- BTC/USDT (most tested)
- ETH/USDT
- Major altcoins with good liquidity
- Not recommended for low-cap or illiquid pairs
## ⚙️ How to Use
1. **Add to Chart**: Apply strategy to 1H BTC/USDT chart
2. **Adjust Settings**: Configure risk parameters based on your preference
3. **Review Signals**: Green = Long, Red = Short, labels show signal count
4. **Monitor Performance**: Check strategy tester for detailed statistics
5. **Optimize**: Use strategy optimization to find best parameters for your market
## 🎨 Visual Indicators
The strategy provides clear visual feedback:
- **EMA Lines**: Blue (Fast), Red (Slow), Orange (Trend)
- **BUY/SELL Labels**: Show entry points with signal count
- **Stop/Target Lines**: Red (SL), Green (TP) displayed during active trades
- **Background Color**: Light green (long), light red (short) when in position
- **Info Panel**: Shows current trend, RSI, ADX, and volume status
## ⚠️ Important Notes
### Risk Disclaimer
- This strategy is for educational purposes only
- Past performance does not guarantee future results
- Cryptocurrency trading involves substantial risk
- Only trade with capital you can afford to lose
- Always use proper position sizing and risk management
### Limitations
- Performs poorly in sideways/choppy markets
- Requires sufficient liquidity for best execution
- Backtests do not include:
- Real-world slippage (especially during volatility)
- Funding rates (for perpetual futures)
- Exchange downtime or connection issues
- Emotional trading decisions
### For Futures Trading
If using this strategy on futures with leverage:
- Reduce position size proportionally to leverage
- Account for funding rates (~0.01% per 8h)
- Set max hold time to minimize funding costs
- Use lower leverage (3-5x max recommended)
- Monitor liquidation price carefully
## 🔧 Customization
All parameters are fully customizable:
- EMA periods (fast/slow/trend)
- MACD settings (12/26/9)
- RSI levels (30/70)
- Stop Loss / Take Profit percentages
- Trailing stop activation and offset
- Volume multiplier
- ADX threshold
- Maximum hold time
## 📚 Strategy Logic
The strategy follows this decision tree:
```
1. Check Trend Direction (EMA alignment)
↓
2. Scan for Entry Signals (8 types)
↓
3. Confirm with Filters (ADX, Volume, RSI)
↓
4. Enter Position with Fixed SL/TP
↓
5. Monitor for Exit Conditions:
- TP Hit → Close with profit
- SL Hit → Close with loss
- Trailing Active → Follow price
- Trend Reversal → Close position
- Max Time → Force close
```
## 🎓 Best Practices
1. **Start Conservative**: Use smaller position sizes initially
2. **Track Performance**: Monitor actual vs backtested results
3. **Optimize Regularly**: Market conditions change, adapt parameters
4. **Combine with Analysis**: Don't rely solely on automated signals
5. **Manage Emotions**: Stick to the system, avoid manual overrides
6. **Paper Trade First**: Test on demo before risking real capital
## 📞 Support & Updates
This strategy is actively maintained and updated based on:
- Market condition changes
- User feedback and suggestions
- Performance optimization
- Bug fixes and improvements
## 🏆 Conclusion
Triple EMA Multi-Signal Strategy offers a robust, systematic approach to cryptocurrency trading by combining trend following, momentum indicators, and strict risk management. Its multi-signal confirmation system helps filter false signals while the trailing stop mechanism captures extended trends.
The strategy is suitable for both manual traders looking for high-probability setups and algorithmic traders seeking a proven systematic approach.
**Remember**: No strategy wins 100% of the time. Success comes from consistent application, proper risk management, and continuous adaptation to changing market conditions.
---
*Version: 1.0*
*Last Updated: November 2025*
*Tested on: BTC/USDT, ETH/USDT (1H, 4H timeframes)*
*Recommended Capital: $5,000+ for optimal position sizing*

Thirdeyechart Gold Simulation Final 3The Thirdeyechart Gold Simulation Final Version 3 is the ultimate indicator for traders who want a comprehensive, real-time view of gold market dynamics across multiple XAU pairs. This version tracks 8 gold-related pairs simultaneously (XAUUSD, XAUJPY, XAUGBP, XAUEUR, XAUAUD, XAUCHF, XAUCAD, XAUNZD) and provides a consolidated visual table for weekly, daily, 4-hour, and 1-hour percentage changes.
Core Features
Multi-Timeframe Trend Analysis – Calculates percent change for each XAU pair across W, D, H4, H1 using:
pct_tf = ((close_tf - open_tf) / open_tf) * 100
Positive values are colored blue, negative values red, giving an immediate visual sense of market direction.
Buy & Sell Simulation – Each pair’s positive and negative contributions are summed to produce BuySim and SellSim columns, representing the overall pressure in the market without providing explicit trade signals.
Total Row & Strength Row – Aggregates all pairs to show total weekly, daily, H4, and H1 movements, alongside a Strength row indicating "Strong", "Weak", or "Neutral" trends per timeframe. A trend bias (Buy Bias or Sell Bias) is calculated automatically from total positive vs negative pressure.
Safe / Unsafe Trade Detection – Advanced logic measures the difference between total Buy and Sell pressure. If the distance exceeds 50% of total market activity, the market is labeled as Safe Trade with a reason for dominance (buyers or sellers). If below this threshold, it is labeled Unsafe Trade with a note that one side “can dominate the market.” This allows traders to quickly identify high-confidence vs uncertain market conditions.
Visual Layout – The table is fully boxed, color-coded, and easy to read, displaying all key metrics including per-timeframe percent changes, BuySim/SellSim totals, Strength, Trend Bias, and Trade Status with reasons.
Logic Overview
Percent changes per timeframe: pct_tf = ((close - open) / open) * 100
Positive and negative values split into Buy/Sell contributions.
Sum across all pairs and timeframes to calculate totals and bias.
Safe/Unsafe trade threshold: distance >= totalAll * 0.50
Strength interpretation per timeframe: >0 → Strong, <0 → Weak, 0 → Neutral
This indicator is ideal for fast detection of strong vs weak gold trends, global XAU market pressure simulation, and quick risk assessment through safe/unsafe trade labeling.
Disclaimer
This tool is educational and analytical only. It does not provide financial advice or trade signals. Users are responsible for their own trading decisions, and trading involves risk.
© 2025 Thirdeyechart. All rights reserved. Redistribution or commercial use without permission is prohibited.

Thirdeyechart Gold Simulation Final 2Gold Simulation – Final Version 2 (Safe/Unsafe Trade Detection)
The Gold Simulation Final Version is a comprehensive TradingView indicator designed for traders who want an immediate understanding of gold market dynamics. This version monitors multiple XAU pairs simultaneously and integrates an advanced logic to detect Safe and Unsafe trade conditions in real time.
Key features:
Safe Trade: Indicates situations where market direction shows clear dominance and higher probability of trend continuity.
Unsafe Trade: Highlights areas where price movement is uncertain or potentially volatile, signaling traders to be cautious.
Multi-Timeframe Analysis: Calculates percentage changes across Weekly (W), Daily (D), 4-Hour (H4), and 1-Hour (H1), and combines them into a Total Average Trend Strength for a consolidated market view.
Clean Visual Layout: All data is displayed in a solid boxed table, making trend strength, direction, and safety status immediately clear.
Logic Overview
Percent change per timeframe:
pct_tf = ((close_tf - open_tf) / open_tf) * 100
Collect all timeframe values for each XAU pair:
values =
Total Average Strength:
Total_Avg = sum(values) / 4
Safe/Unsafe conditions are determined by configurable thresholds comparing dominance between buyers and sellers across timeframes.
This version helps traders quickly identify where trend is strong and stable versus where market conditions are uncertain, allowing better planning and risk management.
Disclaimer
This indicator is for educational and analytical purposes only. It does not provide financial or trading advice. Users are fully responsible for their own trading decisions, and markets carry risk.
© 2025 Ajik Boy. All rights reserved. Redistribution or commercial use without permission is prohibited.

Thirdeyechart Gold Simulation FinalGold Simulation – Final Version (Safe/Unsafe Trade Detection)
The Gold Simulation Final Version is a comprehensive TradingView indicator designed for traders who want an immediate understanding of gold market dynamics. This version monitors multiple XAU pairs simultaneously and integrates an advanced logic to detect Safe and Unsafe trade conditions in real time.
Key features:
Safe Trade: Indicates situations where market direction shows clear dominance and higher probability of trend continuity.
Unsafe Trade: Highlights areas where price movement is uncertain or potentially volatile, signaling traders to be cautious.
Multi-Timeframe Analysis: Calculates percentage changes across Weekly (W), Daily (D), 4-Hour (H4), and 1-Hour (H1), and combines them into a Total Average Trend Strength for a consolidated market view.
Clean Visual Layout: All data is displayed in a solid boxed table, making trend strength, direction, and safety status immediately clear.
Logic Overview
Percent change per timeframe:
pct_tf = ((close_tf - open_tf) / open_tf) * 100
Collect all timeframe values for each XAU pair:
values =
Total Average Strength:
Total_Avg = sum(values) / 4
Safe/Unsafe conditions are determined by configurable thresholds comparing dominance between buyers and sellers across timeframes.
This version helps traders quickly identify where trend is strong and stable versus where market conditions are uncertain, allowing better planning and risk management.
Disclaimer
This indicator is for educational and analytical purposes only. It does not provide financial or trading advice. Users are fully responsible for their own trading decisions, and markets carry risk.
© 2025 Thirdeyechart. All rights reserved. Redistribution or commercial use without permission is prohibited.

Thirdeyechart Index WeeklyThe Index Weekly provides a clean and fast overview of the weekly trend strength for major global indices. This version focuses only on weekly percentage movement, giving traders a quick snapshot of how strong or weak each index is for the current week.
The indicator measures the weekly percentage change using the formula:
((close_week - open_week) / open_week) * 100
Positive values indicate weekly bullish momentum, while negative values show weekly bearish pressure. The results are displayed in a minimal, easy-to-read table format, suitable for intraday, swing, and position traders who rely on higher-timeframe bias.
This version is intentionally simple, fast, and lightweight, designed for traders who want a straightforward understanding of weekly strength without unnecessary complexity.
Supported Index Examples
USD
EUR
GBP
NZD
JPY
CAD
AUD
CHF
XAU
The table highlights each index with color-coded weekly movement, making it easy to spot which markets are leading or lagging for the week.
Disclaimer
This indicator is for education and market observation only. It does not provide buy or sell signals and should not be used as financial advice. Trading involves risk, and users are responsible for their own decisions.
© 2025 Ajik Boy. All rights reserved. Redistribution or commercial use is prohibited.

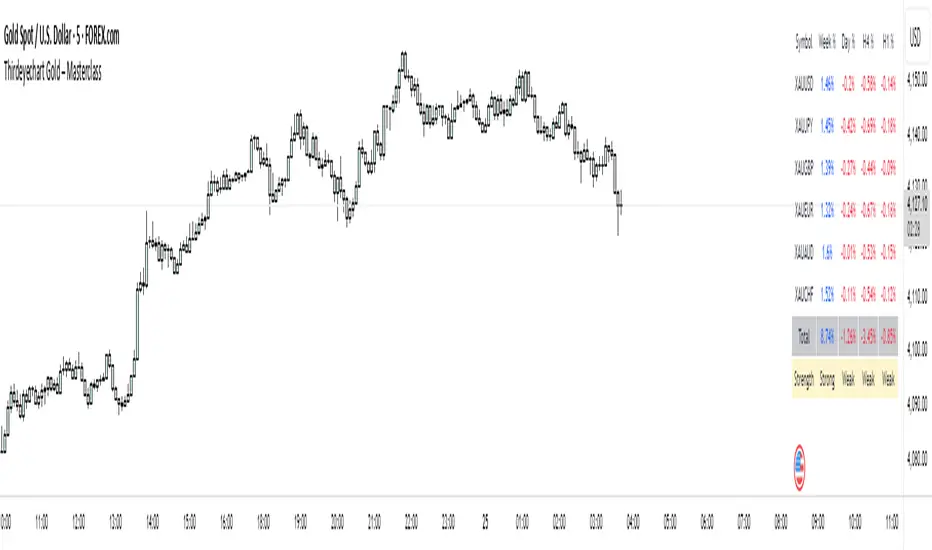
Thirdeyechart Index – 7 MajorsThe 7 Majors Masterclass is a professional TradingView indicator designed for traders who want a fast, clear, and comprehensive view of the market direction of the 7 major forex pairs. This version monitors EURUSD, GBPUSD, USDJPY, USDCHF, USDCAD, AUDUSD, and NZDUSD simultaneously, allowing traders to see global forex trends at a glance.
The indicator calculates percentage changes for each pair across Weekly (W), Daily (D), 4-Hour (H4), and 1-Hour (H1) timeframes. Positive changes are highlighted in blue, negative changes in red, giving an immediate visual cue of market direction. A Total Average Trend Strength is calculated across all timeframes, helping traders quickly identify strong, weak, or neutral trends for each currency pair.
Math Logic Behind the Indicator
Percent change per timeframe:
pct_tf = ((close_tf - open_tf) / open_tf) * 100
Collect all timeframe values for each pair:
values =
Total Average Trend Strength:
Total_Avg = sum(values) / 4
Trend interpretation (default thresholds):
≥ +0.50 → Strong Uptrend
+0.15 to +0.49 → Weak Uptrend
−0.14 to +0.14 → Neutral
−0.49 to −0.15 → Weak Downtrend
≤ −0.50 → Strong Downtrend
The table layout is boxed and clean, making it easy to compare multiple pairs simultaneously. Traders can use it for intraday, swing, or long-term analysis, quickly assessing which pairs are strong or weak and planning trades accordingly.
This indicator is informational and educational only. It does not provide buy or sell signals. Users must perform their own analysis and apply proper risk management before taking any trades.
Disclaimer / Copyright:
© 2025 Thirdeyechart. All rights reserved. Redistribution, copying, or commercial use without permission is prohibited. The author is not responsible for any trading losses or financial decisions made using this indicator.

BybitMinOrderSizeBybit Order Quantity Compliance Library
This library provides all utility functions required for TradingView strategies
that execute orders on Bybit via webhooks.
Problem:
Bybit enforces two strict rules on every order submitted:
Minimum Order Size – each symbol has its own minimum quantity.
Quantity Precision – each symbol requires rounding to the correct number of decimals.
TradingView does not expose this metadata, so strategies can easily submit
quantities that Bybit rejects as invalid.
Solution (This Library):
This library embeds full Bybit contract metadata, including:
A complete mapping of Bybit symbols → minimum order size
A complete mapping of Bybit symbols → allowed precision (decimal places)
A helper to normalize tickers (removing `.P` suffix for Bybit perpetuals)
It also exposes utility functions to automatically make your quantities valid:
`normalizeTicker()` — removes `.P` for consistent lookup
`getMinOrderSize()` — returns the correct minimum order size
`getPrecisionForTicker()` — returns required quantity precision
`floorQty()` — floors quantities to valid minimum increments
`roundQty()` — rounds quantities to valid decimal precision
Use Cases:
Ensuring webhook strategies never send too-small orders
Rounding limit/market orders correctly before execution
Making Pine strategies execution-accurate for Bybit
Avoiding "order rejected: qty too small / invalid precision" errors
This library is recommended for:
Live trading via TradingView → Bybit webhooks
Backtesting strategies that simulate real Bybit constraints
Source: www.bybit.com
Updated: 2025-11-25 — Bybit contract metadata
normalizeTicker(symbol)
Normalizes Bybit perpetual tickers by removing the ".P" suffix.
precisionFromMinOrder(minOrder)
Derives precision (decimal places) from minimum order size.
getMinOrderSize(symbol)
Retrieves the minimum order size for the current or given symbol.
getPrecisionForTicker(symbol)
Retrieves the required quantity precision (decimal places) for a given Bybit symbol.
floorQty(qty, symbol)
Rounds a quantity down to the nearest valid minimum order size for a given symbol.
roundQty(qty, symbol)
Rounds a quantity to the valid precision for the specified symbol.

Thirdeyechart Gold – 8 XAUThe XAU – 8 Gold Version is the newest and most advanced edition in the Masterclass series, designed specifically for gold traders who need fast, accurate, and multi-angle analysis of XAU behavior across global markets. This version monitors 8 different gold-related symbols simultaneously, presenting all data inside a clean, solid boxed layout. It gives traders a clear view of global XAU direction without switching charts.
This version includes percentage change calculations for Weekly (W), Daily (D), 4-Hour (H4), and 1-Hour (H1) timeframes for all eight gold-related pairs you insert. Positive values appear in blue, negative in red. The upgraded layout is optimized to remain clean, compact, and readable even with eight gold symbols displayed.
Fast Trend Detection With Math Logic
The core of the Final Version is the Total Average Trend Strength Calculation, allowing traders to instantly identify whether gold is in a strong uptrend, weak uptrend, neutral zone, weak downtrend, or strong downtrend—based entirely on mathematical logic.
Math Logic Used:
Percent change per timeframe:
pct_tf = ((close_tf - open_tf) / open_tf) * 100
All timeframe values are collected:
values =
Total Average Strength:
Total_Avg = sum(values) / 4
Final Strength Interpretation (default thresholds):
≥ +0.50 → Strong Uptrend
+0.15 to +0.49 → Weak Uptrend
−0.14 to +0.14 → Neutral
−0.49 to −0.15 → Weak Downtrend
≤ −0.50 → Strong Downtrend
This system ensures fast, unbiased direction detection across all 8 gold symbols at once.
The 8-Gold layout allows traders to see global pressure on XAU from multiple markets such as USD, JPY, EUR, GBP, AUD, CHF, CAD, and NZD — making this version extremely powerful for global gold trend reading.
Disclaimer
© 2025 Thirdeyechart. All rights reserved. This indicator is for educational and informational purposes only. Not a buy/sell signal. Redistribution or commercial use without permission is strictly prohibited. The author is not responsible for any trading loss.

Thirdeyechart Gold – Masterclass FinalThe XAU Masterclass — Final Fix is the definitive TradingView indicator for serious gold traders. Built for speed and clarity, this edition combines a solid boxed layout with an advanced math logic core to detect trend strength quickly across multiple timeframes. Designed specifically for XAU and XAU-related pairs, the indicator shows percentage change on Weekly (W), Daily (D), 4H (H4), and 1H (H1), and distills those readings into a single Total Average Strength value for instant decision context.
Visuals are clean and compact — every symbol row sits inside a solid box so chart clutter is minimised and strength/direction read at a glance. Positive movements are highlighted in blue, negative in red. The Total Average is presented alongside the timeframe values and an interpreted label: “Strong Uptrend”, “Weak Uptrend”, “Neutral”, “Weak Downtrend”, “Strong Downtrend” — driven by configurable thresholds so you can tune sensitivity to your trading style.
Math logic (how it’s calculated):
Per timeframe percent change:
pct_tf = ((close_tf - open_tf) / open_tf) * 100
(calculated for W, D, H4, H1)
Normalize timeframes by simply using their signed percent changes (no external data):
values =
Total Average Strength (arithmetic mean):
Total_Avg = sum(values) / 4
Strength interpretation (default thresholds — adjustable):
Total_Avg >= +0.50 -> Strong Uptrend
+0.15 <= Total_Avg < +0.50 -> Weak Uptrend
-0.15 < Total_Avg < +0.15 -> Neutral
-0.50 < Total_Avg <= -0.15 -> Weak Downtrend
Total_Avg <= -0.50 -> Strong Downtrend
This approach keeps the computation transparent and fast while giving a consolidated market-strength readout. Traders can change thresholds or weighting if preferred; the default provides a reliable, conservative filter for most setups.
Usage note: This tool is informational and made for analysis — it does not issue buy/sell signals. Always combine with your own strategy and risk management.
Disclaimer / Copyright:
© 2025 Thirdeyechart. All rights reserved. Redistribution, copying, or commercial use without permission is prohibited. The author is not responsible for any trading losses or financial decisions made using this indicator.
Inyerneck Sniper Engine v4.2 — FINAL WORKING 2025Aggressive momentum sniper for pennies. Fires on volume + EMA snaps. Use small size. Alerts ready.

Thirdeyechart Gold – MasterclassThe XAU Masterclass Trend Table is the ultimate TradingView indicator for gold traders who demand precision, speed, and clarity. This special edition builds on all previous versions by enabling fast detection of strong and weak trends across multiple timeframes, making it a true masterclass tool for serious traders.
This indicator tracks gold across Daily (D), 1-Hour (H1), 4-Hour (H4), and Weekly (W) timeframes, providing a comprehensive view of both short-term and long-term market movements. The Total Average Calculation consolidates data from all timeframes, allowing traders to instantly see the overall trend strength of XAU. Positive movements are highlighted in blue, negative movements in red, while the Total Average gives a quick read of market momentum.
Version Masterclass features a solid, boxed layout, keeping all information organized and visually clear on the chart. Traders can monitor XAU/USD, XAU/JPY, XAU/EUR, and other XAU-related pairs efficiently, making it easier to plan entries, exits, and position sizing. The design is optimized for speed, allowing users to detect trend shifts faster than ever before.
This indicator is coded personally using advanced custom formulas for maximum precision and performance. It is ideal for intraday, swing, and long-term gold traders who want a professional-grade tool to analyze XAU movements globally.
This script is purely informational and educational. It does not provide buy or sell signals and does not guarantee profits. Users must perform their own analysis and apply proper risk management before making trading decisions.
Disclaimer / Copyright:
© 2025 Thirdeyechart. All rights reserved. Redistribution, copying, or commercial use of this code without permission is strictly prohibited. The author is not responsible for any trading losses or financial decisions made based on this script.

Inyerneck Sniper Engine v4.2 — FINAL WORKING 2025yer momUltra-aggressive momentum sniper built for pennies & BTC.
Fires on every volume explosion + EMA snap. No mercy, no filters.
50+ trades per month. Use small size or die trying.
Private alpha —

Inyerneck Sniper Engine v4.2 — FINAL WORKING 2025Ultra-aggressive momentum sniper built for pennies & BTC.
Fires on every volume explosion + EMA snap. No mercy, no filters.
50+ trades per month. Use small size or die trying.
Private alpha — invite-only. do not change settings without first recording default settings, the default settings are great... usable on any time frame.. aaaaannd... yer mom!

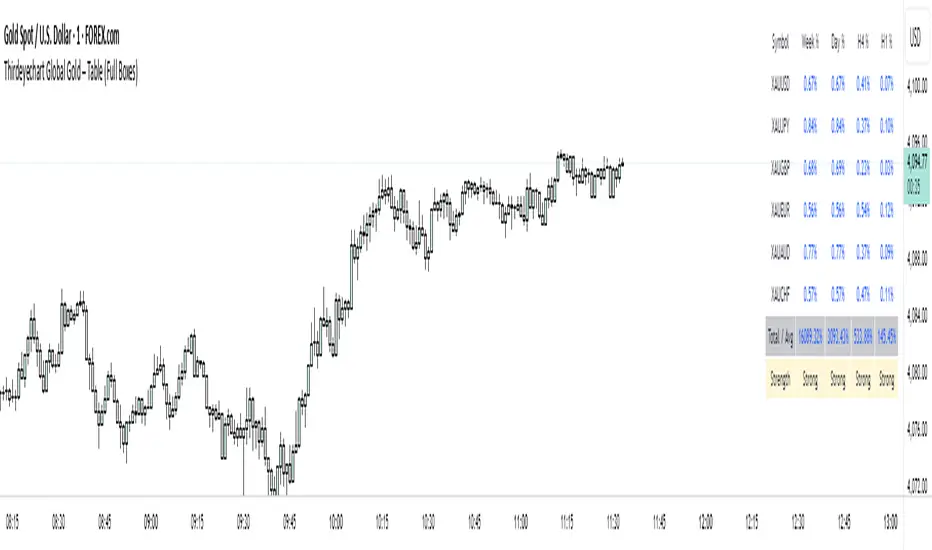
Thirdeyechart Global Gold – Last VersionThe XAU Solid Trend Table – Last Version is the ultimate TradingView indicator for gold traders who want a clean, professional, and comprehensive view of market direction. This version builds on previous releases by combining percentage changes, multiple timeframes, and a Total Average Calculation into a solid, boxed table that clearly displays strong and weak trends in XAU and its related pairs.
Users can monitor gold across Daily (D), 1-Hour (H1), 4-Hour (H4), and Weekly (W) timeframes. Positive movements are highlighted in blue, negative movements in red, and the Total Average calculation summarizes the overall trend strength, making it easy to spot whether XAU is in a strong uptrend, downtrend, or consolidating.
The table’s solid, boxed layout ensures all information is organized and visually clear, reducing clutter on the chart. This design helps traders quickly interpret market direction, plan trades, and compare multiple pairs like XAU/USD, XAU/JPY, and USD/JPY without confusion.
Coded personally using custom formulas, this indicator emphasizes precision, functionality, and readability. It’s ideal for intraday traders, swing traders, and long-term gold analysts who want a single tool to assess gold’s global movement efficiently.
This script is purely informational and educational. It does not provide buy or sell signals and does not guarantee profits. Traders must perform their own analysis and apply proper risk management before making any trading decisions.
Disclaimer / Copyright:
© 2025 Thirdeyechart. All rights reserved. Redistribution, copying, or commercial use of this code without permission is strictly prohibited. The author is not responsible for any trading losses or financial decisions made based on this script.
Thirdeyechart Global Gold – Version 3 (Safe)The XAU Global Trend Table – Version 3 is the latest enhanced TradingView indicator, designed exclusively for monitoring gold (XAU) and its related pairs. This version introduces a Total Average Calculation, allowing traders to quickly detect strong or weak trends across multiple timeframes. With this addition, Version 3 not only shows percentage changes but also provides a consolidated view of gold’s overall market strength.
Users can track gold across Daily (D), 1-Hour (H1), 4-Hour (H4), and Weekly (W) timeframes. Positive percentage changes are highlighted in blue, negative changes in red, while the Total Average helps identify whether the trend is gaining strength or losing momentum. This makes it easier to assess market direction and potential entry or exit zones without manually comparing multiple charts.
The indicator is coded personally, using custom formulas to calculate percentage changes and the Total Average, giving a unique, precise view of XAU movements. It works for XAU/USD, XAU/JPY, and USD/JPY, capturing gold’s global behavior and its correlation with major currencies. The table is positioned at the top-right corner and dynamically adjusts to the number of symbols entered.
Version 3 is specifically tailored for gold traders who want a quick, clear understanding of market strength and trend direction. It’s ideal for swing trading, intraday analysis, or long-term planning, providing an all-in-one visual tool to stay informed on gold’s global movement.
This script is purely informational and educational. It does not provide buy or sell signals, nor does it guarantee profits. Users should perform their own analysis and apply proper risk management before making trading decisions.
Disclaimer / Copyright:
© 2025 Thirdeyechart. All rights reserved. Redistribution, copying, or commercial use of this code without permission is strictly prohibited. The author is not responsible for any trading losses or financial decisions made based on this script.

Thirdeyechart Version 2 Global GoldThe XAU Global Direction Table – Version 2 is an enhanced TradingView indicator specifically designed for tracking gold (XAU) and related currency pairs. This version adds a Weekly (W) timeframe alongside Daily (D), 1-Hour (H1), and 4-Hour (H4) timeframes, providing a more complete overview of gold’s short-term, medium-term, and long-term market direction.
This indicator is coded personally, with custom formulas to calculate the percentage change of each symbol across all selected timeframes. Positive movements are highlighted in blue, and negative movements in red, giving traders a clear visual indication of gold’s direction. The table is optimized for monitoring XAU/USD, XAU/JPY, and USD/JPY, reflecting gold’s global behavior and its correlation with the US Dollar and Japanese Yen.
Users can add their preferred XAU-related pairs as a comma-separated list in the settings. The table is dynamically sized based on the number of symbols, positioned conveniently at the top-right corner of the chart for quick reference. This setup allows traders to see multiple timeframes simultaneously, aiding decision-making for swing trades, intraday trades, or long-term gold analysis.
Version 2 emphasizes gold only, making it a specialized tool for traders who want precise and concise data on XAU movements. It’s ideal for analyzing global gold trends, spotting potential entry or exit zones, or simply staying informed on market shifts.
This script is purely informational and educational. It does not provide buy or sell signals, nor guarantee profits. Users should conduct their own analysis and apply proper risk management before making trading decisions.
Disclaimer / Copyright:
© 2025 Ajik Boy. All rights reserved. This indicator is for educational and informational purposes only. The author is not responsible for any trading losses or financial decisions made based on this script. Redistribution, copying, or commercial use of this code without permission is strictly prohibited.

Thirdeyechart Global Gold PercentageThe global gold percentage – Percentage Change Indicator is a TradingView tool developed to help traders monitor multiple currency pairs and precious metals in one glance. This indicator was coded personally, using custom formulas to calculate the percentage change for each symbol over selected timeframes, making it unique and fully tailored to individual analysis needs.
Users can input any symbols they wish to track as a comma-separated list, making it highly flexible. The script automatically calculates percentage changes for Daily (D), 1-Hour (H1), and 4-Hour (H4) timeframes. Positive changes are highlighted in blue and negative changes in red, allowing for an instant visual representation of market movements. The table updates in real-time, giving traders immediate feedback without needing to switch between charts.
Designed with simplicity and functionality in mind, this indicator is ideal for intraday traders, swing traders, or anyone who wants to keep an eye on multiple markets efficiently. It works for currency pairs, metals like gold (XAUUSD, XAUJPY), or any TradingView-available symbol. The table is positioned at the top-right corner of the chart and automatically adapts to the number of symbols entered.
This script is purely informational and educational, providing a clear view of price movements but not offering buy or sell signals. Traders should perform their own analysis and risk management before making any trading decisions.
Disclaimer / Copyright:
© 2025 Thirdeyechart. All rights reserved. This indicator is for educational and informational purposes only. The author is not responsible for any trading losses or financial decisions made based on this script. Redistribution, copying, or commercial use of this code without permission is strictly prohibited.

Bitcoin Macro Fair Value [Structural]//@version=6
indicator("Bitcoin Macro Fair Value ", overlay=true)
// --- Model Coefficients (Derived from Python Analysis 2019-2025) ---
intercept = input.float(3.156434, "Intercept")
c_m2 = input.float(0.132827, "Real M2 Coef")
c_corp = input.float(0.742593, "Corp Spread Coef")
c_hy = input.float(-0.617968, "HY Spread Coef")
c_dxy = input.float(0.009772, "DXY Coef")
c_real30 = input.float(0.713311, "Real 30Y Coef")
c_be30 = input.float(-1.059273, "Breakeven 30Y Coef")
c_slope = input.float(0.402220, "Slope 10Y-2Y Coef")
// --- Data Fetching ---
m2 = request.security("FRED:M2SL", "M", close)
cpi = request.security("FRED:CPIAUCSL", "M", close)
real_m2 = m2 / cpi
corp = request.security("FRED:BAMLC0A0CM", "D", close)
hy = request.security("FRED:BAMLH0A0HYM2", "D", close)
dxy = request.security("TVC:DXY", "D", close)
real30 = request.security("FRED:DFII30", "D", close)
nom30 = request.security("FRED:DGS30", "D", close)
be30 = nom30 - real30
nom10 = request.security("FRED:DGS10", "D", close)
nom2 = request.security("FRED:DGS2", "D", close)
slope = nom10 - nom2
// --- Calculation ---
log_fv = intercept + (c_m2 * real_m2) + (c_corp * corp) + (c_hy * hy) + (c_dxy * dxy) + (c_real30 * real30) + (c_be30 * be30) + (c_slope * slope)
fair_value = math.exp(log_fv)
plot(fair_value, "Macro Fair Value", color=color.new(color.blue, 0), linewidth=2)

Kernel Regression Trend LineKTrend – Non-Repainting Kernel Regression Trend (2025 Clean Version)
Ultra-clean, powerful, and completely non-repainting trend-following tool based on advanced Kernel regression (Rational Quadratic + Gaussian blend).
How it works:
• Uses two different kernel estimates with smart lag to detect genuine trend reversals
• Plots a thick, beautifully colored trend line (teal when rising, deep red when falling)
• Places precise, locked-in Bullish Flip (green triangle below bar) and Bearish Flip (red triangle above bar) signals only on confirmed bar close – zero repaint, ever
• Optional smoothing mode for even cleaner visuals
Features
✓ 100% non-repainting signals and line
✓ Minimal lag while staying extremely responsive
✓ Clean aesthetic – perfect for BTC, ETH, stocks, forex, any timeframe
✓ Built-in alerts for Bullish & Bearish flips
✓ Fully open source (MPL 2.0)
Default settings are already battle-tested and loved by thousands:
- Lookback Window: 11
- Relative Weighting: 8.0
- Regression Level: 25
- Lag: 2
Great on 1H–Daily charts, especially crypto and indices.
Credits: Original kernel library by jdehorty, cleaned & enhanced flip logic by HighlanderOne.
Enjoy the smoothest, most reliable kernel trend tool on TradingView – completely free!
