RSI with SMA + 70/60/50/40/30 LevelsIndicator Name:
RSI with SMA + 70/60/50/40/30 Levels
🧩 Concept Overview:
यह indicator दो popular tools को combine करता है:
RSI (Relative Strength Index) – momentum indicator जो market ke overbought aur oversold zones ko identify karta hai.
SMA (Simple Moving Average) – trend smoother jo RSI ke movement ko average karke lagging confirmation deta hai.
इन दोनों के साथ 70, 60, 50, 40, और 30 की multiple reference lines draw की जाती हैं, ताकि trader को RSI ke swings aur reversals easily samajh aaye.
⚙️ Indicator Components:
RSI Line:
Default Period: 14 (customize kar sakte ho).
Show karta hai price momentum – agar RSI 70 ke upar jaata hai to market overbought zone me hota hai; agar 30 ke niche jaata hai to oversold zone me.
SMA on RSI:
RSI ka smooth version (usually 9-period SMA).
Trend confirmation ke liye – jab RSI line SMA ke upar cross karti hai to bullish signal, aur neeche cross kare to bearish signal.
Horizontal Levels:
70: Overbought zone (potential sell area).
60: Strong bullish momentum line (trend confirmation).
50: Neutral / midline (trend direction flip area).
40: Weak bearish zone (trend losing strength).
30: Oversold zone (potential buy area).
💡 How to Use:
Trend Identification:
RSI > 60 aur SMA ke upar → Bullish trend.
RSI < 40 aur SMA ke neeche → Bearish trend.
Reversal Spotting:
RSI 70 ke upar jaake wapas niche aaye → Sell signal.
RSI 30 ke neeche jaake wapas upar aaye → Buy signal.
Confirmation Using SMA:
RSI cross SMA from below → Confirmed bullish reversal.
RSI cross SMA from above → Confirmed bearish reversal.
"富时中国50三倍做空"に関するスクリプトを検索

Goldencross & Deathcross Highlights (50/200 SMA) - Fixed dailyThis indicator visualizes major long-term trend shifts in the market
by tracking the daily 50-day and 200-day Simple Moving Averages (SMAs)
— regardless of your current chart timeframe.
🟩 A green flash (Golden Cross) appears when the 50-day SMA crosses
above the 200-day SMA — signaling potential long-term bullish momentum.
🟥 A red flash (Death Cross) appears when the 50-day SMA crosses
below the 200-day SMA — suggesting potential long-term bearish pressure.
Unlike typical SMA overlays, this script:
• Pulls daily data directly (fixed to daily timeframe)
• Works cleanly on any chart timeframe (5m, 1h, 4h, etc.)
• Avoids clutter by hiding moving average lines
• Shows only short, subtle flashes and one clean marker per event

SMA Cross 5/50 with Trend Filter & Risk Management by JuggiDThe basic SMA (5/50) crossover strategy can be enhanced to improve profitability by adding filters and risk management. For example, a long entry is triggered only when the fast SMA (5) crosses above the slow SMA (50) **and** the price is above the SMA (200), ensuring trades align with the major trend. Similarly, a short entry requires the crossover confirmation plus the price staying below the SMA (200). To reduce false signals and protect capital, stop-loss and take-profit levels can be set automatically (e.g., 2% loss, 5% gain), while additional confirmation tools such as volume spikes, RSI above 50, or MACD momentum can be applied to validate stronger signals. This approach helps avoid whipsaws in sideways markets and allows trades to capture larger moves while minimizing downside risk.

EMA 24/50/70/99 聚合指标(raysun)Key Features
Multiple EMAs in One Script: Displays EMA 24, EMA 50, EMA 70, and EMA 99 simultaneously.
Customizable Visibility: You can turn each EMA line on or off in the indicator settings.
Color-Coded Lines: Each EMA is assigned a unique color (orange, blue, green, red) for easier visual distinction.
Overlay on Price Chart: Plots directly on the candlestick chart to help identify market trends and momentum shifts.
Usage
Trend Identification:
Shorter EMAs (like EMA 24) are more sensitive to price action, while longer EMAs (like EMA 99) represent broader trends.
Crossovers:
Watching how EMAs cross each other can help spot potential bullish or bearish signals. For example:
EMA 24 crossing above EMA 50/70/99 may suggest an uptrend.
EMA 24 crossing below EMA 50/70/99 may indicate a downtrend.
Support and Resistance:
EMAs often act as dynamic support and resistance levels, especially in trending markets.
Ideal For
Traders who prefer using EMA clusters for decision-making.
Swing traders and intraday traders who monitor multiple timeframes.
Anyone wanting a cleaner setup without cluttering the chart with multiple separate EMA indicators.

Daily EMAs (8, 21 & 50) with BandDescription:
This script plots the Daily EMAs (8, 21, and 50) on any intraday or higher timeframe chart. It provides a clear, multi-timeframe view of market trends by using daily exponential moving averages (EMAs) and a dynamic visual band. I use this on the major indexes to decide if I should be mostly longing or shorting assets.
-In addition to identifying the trend structure, the 8-Day EMA often serves as a key area where buyers or sellers may become active, depending on the market direction:
-In an uptrend, the 8 EMA can act as a dynamic support zone, where buyers tend to re-enter on pullbacks.
-In a downtrend, the same EMA may act as resistance, where sellers become more aggressive.
-The script also includes a colored band between the 8 and 21 EMAs to highlight the short-term trend bias:
-Green fill = 8 EMA is above the 21 EMA (bullish structure).
Blue fill = 8 EMA is below the 21 EMA (bearish structure).
The 50-Day EMA is included to give additional context for intermediate-term trend direction.
Features:
- Daily EMA levels (8, 21, and 50) calculated regardless of current chart timeframe.
- 8 EMA acts as a potential buyer/seller zone based on trend direction.
- Color-coded band between 8 and 21 EMAs:
- Green = Bullish short-term bias
- Blue = Bearish short-term bias
- Customizable price source and EMA offset.
- Suitable for trend trading, pullback entries, and higher-timeframe confirmation.
Use Cases:
Identify key dynamic support/resistance areas using the 8 EMA.
Assess short-, medium-, and intermediate-term trend structure at a glance.
Enhance confluence for entry/exit signals on lower timeframes.

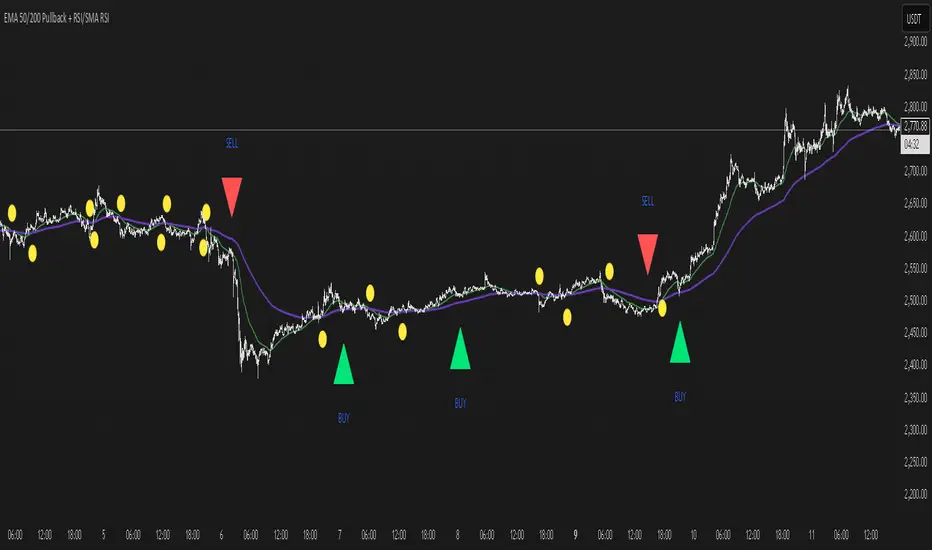
EMA 50/200 Pullback + RSI/SMA RSI
Strategy Description: EMA 50/200 Pullback + RSI/SMA RSI
1. Trend Identification with EMA:
Uses two Exponential Moving Averages (EMA): a fast EMA (default 50) and a slow EMA (default 200).
When the fast EMA crosses above the slow EMA (bullish crossover), an uptrend is identified.
When the fast EMA crosses below the slow EMA (bearish crossover), a downtrend is identified.
The lengths of both EMAs are fully customizable.
2. EMA Distance Condition:
Signals are only valid when the absolute percentage distance between the two EMAs is within a user-defined range (default: 0.4% to 1%).
This helps filter out weak signals when the EMAs are too close or too far apart.
3. Pullback Condition:
After a new trend is detected (EMA crossover), the strategy waits for the price to pull back to touch or cross the fast EMA (EMA 50).
This ensures entries are not taken immediately at the crossover, but after a retracement to a dynamic support/resistance area.
4. RSI Confirmation:
Uses the RSI indicator (default 14) and its Simple Moving Average (SMA RSI, default 14).
Buy signal: RSI crosses above its SMA.
Sell signal: RSI crosses below its SMA.
Both RSI and SMA RSI lengths are fully customizable.
5. Entry Rules:
The indicator only gives the first buy/sell signal after each EMA crossover (start of a new trend), and will not repeat signals until the next EMA crossover.
Buy signal:
Fast EMA crosses above slow EMA
EMA distance is within the valid range
Price pulls back to the fast EMA
RSI crosses above its SMA
Sell signal:
Fast EMA crosses below slow EMA
EMA distance is within the valid range
Price pulls back to the fast EMA
RSI crosses below its SMA
6. Customization:
All parameters (EMA lengths, RSI length, SMA RSI length, EMA distance range) can be adjusted in the indicator’s settings.
Note:
This is a signal indicator, not a complete trading strategy. For real trading, always combine with risk management and additional confirmations.
Triple EMA Bundle (50, 100, 200) - Osbrah CRG📈 Advanced EMA Indicator – 50/100/200
This custom-built indicator displays the 50, 100, and 200 Exponential Moving Averages (EMAs), giving traders a powerful visual tool to identify key trend directions, dynamic support/resistance levels, and potential market reversals.
Designed for both beginners and advanced users, this tool offers extensive customization options:
* Select which EMAs to display (50, 100, 200)
* Adjust colors, line styles, and thickness
* Choose between different price sources (close, open, hl2, etc.)
* Set custom EMA lengths to fit your strategy
Use Cases:
* Spot trend direction and strength at a glance
* Identify key zones of support and resistance
* Confirm entries/exits based on EMA crossovers or rejections
* Align your trades with higher timeframe trends
Whether you're a swing trader or a scalper, this indicator helps you stay in sync with the market by bringing clarity to long-term momentum zones.
Distance between EMA 50-100/100-150This script calculates and plots the percentage difference between the 50-period, 100-period, and 150-period Exponential Moving Averages (EMA) on a TradingView chart. The aim is to provide a clear visual representation of the market's momentum by analyzing the distance between key EMAs over time.
Key features of this script:
1. EMA Calculation : The script computes the EMA values for 50, 100, and 150 periods and calculates the percentage difference between EMA 50 and 100, and between EMA 100 and 150.
2. Custom Threshold : Users can adjust a threshold percentage to highlight significant divergences between the EMAs. A default threshold is set to 0.1%.
3. Visual Alerts : When the percentage difference exceeds the threshold, a visual marker appears on the chart:
Green Circles for bullish momentum (positive divergence),
Red Circles for bearish momentum (negative divergence),
Diamonds to indicate the first occurrence of new bullish or bearish signals, allowing users to catch fresh market trends.
4. Dynamic Plotting : The script plots two lines representing the percentage difference for each EMA pair, offering a quick and intuitive way to monitor trends.
Ideal for traders looking to gauge market direction using the relationship between multiple EMAs, this script simplifies analysis by focusing on key moving average interactions.

RSI 30-50-70 moving averageDescription:
The RSI 30-50-70 Moving Average indicator plots three distinct moving averages based on different RSI ranges (30%, 50%, and 70%). Each moving average corresponds to different market conditions and provides potential entry and exit signals. Here's how it works:
• RSI_30 Range (25%-35%): The moving average of closing prices when the RSI is between 25% and 35%, representing potential oversold conditions.
• RSI_50 Range (45%-55%): The moving average of closing prices when the RSI is between 45% and 55%, providing a balanced perspective for trend-following strategies.
• RSI_70 Range (65%-75%): The moving average of closing prices when the RSI is between 65% and 75%, representing potential overbought conditions.
This indicator offers flexibility, as users can adjust key parameters such as RSI ranges, periods, and time frames to fine-tune the signals for their trading strategies.
How it Works:
Like traditional moving averages, the RSI 30-50-70 Moving Averages can highlight dynamic levels of support and resistance. They offer additional insight by focusing on specific RSI ranges, providing early signals for trend reversals or continuation. The default settings can be used across various assets but should be optimized via backtesting.
Default Settings:
• RSI_30: 25% to 35% (Oversold Zone, yellow line)
• RSI_50: 45% to 55% (Neutral/Trend Zone, green line)
• RSI_70: 65% to 75% (Overbought Zone, red line)
• RSI Period: 14
Buy Conditions:
• Use the 5- or 15-minute time frame.
• Wait for the price to move below the RSI_30 line, indicating potential oversold conditions.
• Enter a buy order when the price closes above the RSI_30 line, signaling a recovery from the oversold zone.
• For a more conservative approach, use the RSI_50 line as the buy signal to confirm a trend reversal.
• Important: Before entering, ensure that the RSI_30 moving average has flattened or started to level off, signaling that the oversold momentum has slowed.
Sell Conditions:
• Use the 5- or 15-minute time frame.
• Wait for the price to close above the RSI_70 line, indicating potential overbought conditions.
• Enter a sell order when the price closes below the RSI_70 line, signaling a decline from the overbought zone.
• Important: Similar to buying, wait for the RSI_70 moving average to flatten or level off before selling, indicating the overbought conditions are stalling.
Key Features:
1. Dynamic Range Customization: The indicator allows users to modify the RSI ranges and periods, tailoring the moving averages to fit different market conditions or asset classes.
2. Trend-Following and Reversal Signals: The RSI 30-50-70 moving averages provide both reversal and trend-following signals, making it a versatile tool for short-term traders.
3. Visual Representation of Market Strength: By plotting moving averages based on RSI levels, traders can visually interpret the market’s strength and potential turning points.
4. Risk Management: The built-in flexibility allows traders to choose lower-risk entries by adjusting which RSI level (e.g., RSI_30 vs. RSI_50) they rely on for signals.
Practical Use:
Different assets respond uniquely to RSI-based moving averages, so it's recommended to backtest and adjust ranges for specific instruments. For example, volatile assets may require wider RSI ranges, while more stable assets could benefit from tighter ranges.
Checking for Buy conditions:
1st: Wait for current price to go below the RSI_30 (yellow line)
2nd: Wait and observe for bullish divergence
3rd: RSI_30 has flattened indicating potential gain of momentum after a bullish divergence.
4th: Enter a buy order when the price closed above the RSI_30, preferably when a green candle appeared.

Stochastic RSI (50 Line)This Stoch RSI has a 50 line to help determine if the momentum is going up or down. Under 50, down and above 50 is up.
MultipSMMA 5-9-13-21-35-50-100 @trueenight //@version=4
study("MultipSMMA 5-9-13-21-35-50-100", overlay = true)
getSma(src, len) =>
float smma = 0.0000000
// len = input(7, minval=1, title="Length")
// src = input(close, title="Source")
smma := na(smma ) ? sma(src, len) : (smma * (len - 1) + src) / len
//plot(smma, color=color.red)
smma
plot(getSma(close, input(5, "Sma 5 ")),"sma5", color=#ff0000)
plot(getSma(close, input(9, "Sma 9 ")),"sma9", color=#ff4d00)
plot(getSma(close, input(13, "Sma 13 ")),"sma13", color=#ff9800)
// plot(sma18,"sma18", color=color.green)
plot(getSma(close, input(21, "Sma 21 ")),"sma21", color=#c27ba0, linewidth=3)
plot(getSma(close, input(35, "Sma 35 ")),"sma35", color=#00ffff)
plot(getSma(close, input(50, "Sma 50 ")),"sma50", color=#ff00ff, linewidth=3)
plot(getSma(close, input(100, "Sma 100 ")),"sma100", color=color.yellow, linewidth=3)
Simple Moving Average 20,50,100This SMA Script is modified and is based on 3 bands which are of 20 days, 50 days, 100 days average line.
This is a very appropriate for Indian Markets.
**How to Use :**
***BUY***
When the chart pattern is as follows :-
- SMA 200 (Black)
- SMA 50 (Red)
- SMA 20 (Green)
- "Last Traded Price"
***SELL***
When the chart pattern is as follows :-
- "Last Traded Price"
- SMA 20 (Green)
- SMA 50 (Red)
- SMA 200 (Black)
And Book Good Profits!!!

EMA 5/10/21 SMA 50/100/200The Script is mixture of both EMAs and SMAs. EMA 5/10/21 are powerful indicators for short term providing more weightage to the recent prices. SMA 50/100/200 provide the long term view.
5 Day EMA: This is a sign of strong momentum. It tracks the trend in the short term time frame. This is support in the strongest up trends. This line can only be used in low volatility trends with strong momentum. A break back above this line is a sign for me that an uptrend may be resuming. I primarily use it as an end of day trailing stop. It is rare that this line does not break intraday, even in the strongest trending markets.
• 10 day EMA: The 10 day EMA is a great moving average to use to keep you on the right side of the major market trend. It is usually the first line to be lost before any real trouble begins. It can be used as a standalone signal in some stocks and markets that tend to trend strongly in one direction for long periods.
• 21 day EMA: This is the intermediate term moving average. It is generally the last line of support in a volatile uptrend. To me, it is the inevitable reversion to the mean in a market when it finally pulls back after an extended trend.
• 50 day SMA: This is the line that strong leading stocks typically pull back to. This is usually the support level for strong uptrends. It is normal for uptrending markets to pull back to this line and find support. Most bull markets and uptrends will pull back to this level. It is generally a great “Buy the dip” level.
• 100 day SMA: This is the line that provides the support between the 50 day and the 200 day. If it does not hold as support, there is a high probability that the 200 day SMA is the next stop. This is the deeper pullback level in bull markets and uptrends. It usually presents a great risk/reward ratio in bull markets.
• 200 day SMA: Bulls like to buy dips when markets are trading above the 200 day moving average, while bears sell rallies short below it. Bears usually win below this line, as the 200 day becomes longer term resistance, and bulls buy pullbacks to the 200 day as long as the price stays above it. This line is one of the biggest signals in the market telling you which side to be on. Bull above, Bear below. Bad things happen to stocks and markets when this line is lost.

EMA Cross 20/50/100/200EMA Cross 20 50 100 200
Easy identify cross between 20 and 50
Easy identify cross between 20 and 100
Cross between 20 and 50 is good signal for buy and sell.
Cross between 20 and 100 is confirmation signal for buy and sell.
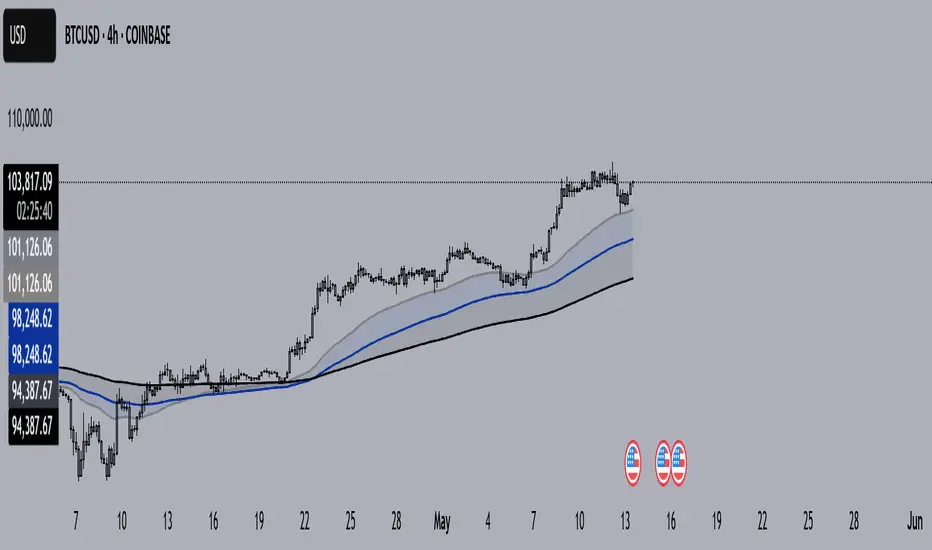
boot2thrill - EMA 20/50 & SMA 50/200//Notes:
//Version by boot2thrill on 05-20-2019.
//Version includes combined Exponential Moving Averages EMA 20/50 and Simple Moving Averages SMA 50/200.
//***Recommended use on BTCUSD 1h/4h/1d chart.***

boot2thrill - EMA 20/50 & SMA 50/200//Notes:
//Version by boot2thrill on 05-20-2019.
//Version includes combined Exponential Moving Averages (EMA) for 20/50 periods and Simple Moving Averages (SMA) for 50/200 periods.
//***Recommended use on BTCUSD 1h/4h/1d chart.***
VWMA : 20 50 200Plots 20, 50 and 200 tick Volume Weighted MA and Simple MA.
The Volume Weighted MA tends to move before the SMA. I am seeing significant price movements on crypto charts near 50 VWMA crosses. As well, the 20-50 VWMA crosses. When the thicker lines ( VWMA ) are above or below the same color SMA, this divergence can also signal changes in trends.
This is my first script and likely be updated. Feedback is welcome.
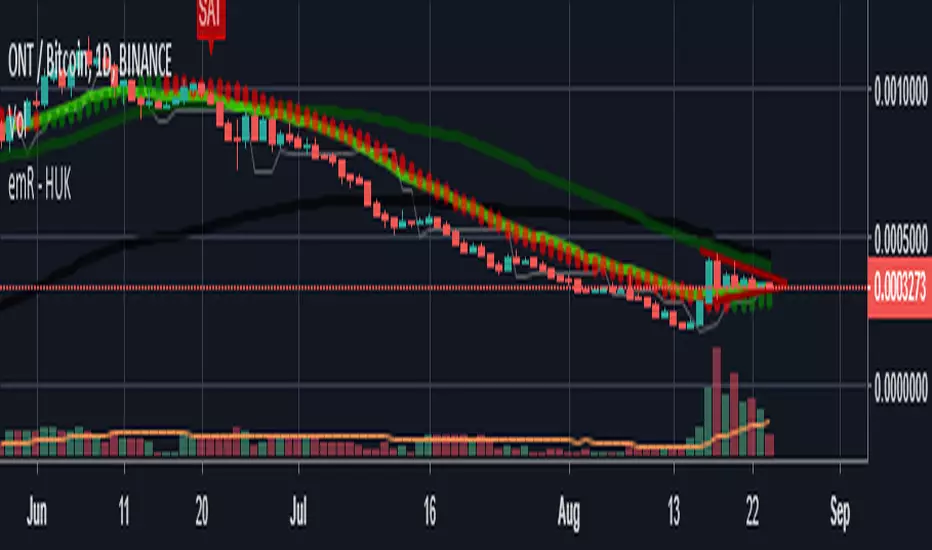
HUK ElasticVolume/50 MOVING AVERAGE e 50/200/20 Coral TrendElastic Volume Default Settings : 50 lenght!
Moving Average Default Settings:50 / 200
EMA Default Settings :20
Coral Trend Default Settings :21/0,4
Thank you ! emR Huk ..
Punjis Dynamic Daily EMA/SMA 5,9,21,50,100 LevelsPunjis Dynamic Daily EMA/SMA 5,9,21,50,100 Levels
Overview:
This indicator displays daily timeframe moving averages as horizontal lines extending to the right of your chart, regardless of what timeframe you're currently viewing. It includes six key moving averages: EMA 5, EMA 9, EMA 21, SMA 50, SMA 100, and SMA 200.
Key Features:
Clean Chart Design: Unlike traditional moving average lines that clutter your chart with curves across all candles, this indicator uses horizontal lines that extend only from the current price level to the right edge of your screen
Multi-Timeframe Analysis: View daily moving averages on any intraday timeframe (1min, 5min, 15min, etc.) without switching charts
Fully Customizable:
Toggle each moving average on/off independently
Adjust the period length for each MA
Customize colors for each line
Master toggle to show/hide all lines at once
Reduced Visual Noise: Horizontal lines keep your price action clean and easy to read while still providing critical support/resistance levels
Professional Layout: Perfect for traders who need to monitor multiple key levels without obscuring candlestick patterns and chart analysis
Benefits of Horizontal Lines:
Cleaner Charts: Traditional MAs draw lines through every candle, creating visual clutter. Horizontal lines only show current values, keeping your chart clean
Focus on Current Levels: What matters most is where the MAs are NOW relative to price - horizontal lines highlight this instantly
Better Price Action Visibility: See candlestick patterns, volume, and support/resistance levels clearly without MA lines crossing through them
Quick Reference: Instantly identify if price is above or below key moving averages without following curved lines across the chart
Professional Appearance: Clean, minimalist design preferred by institutional traders and technical analysts
Use Cases:
Day traders monitoring higher timeframe levels on intraday charts
Swing traders tracking daily moving averages as dynamic support/resistance
Multi-timeframe analysis without chart switching
Identifying trend direction and potential reversal zones
Clean workspace for pattern recognition and price action trading

Indian Scalper 2025 – PSAR + SMA50 + RSI≤50 + High Volume (75%)Best 1-min / 2-min scalping strategy for NIFTY, BANKNIFTY, FINNIFTY & liquid stocks in 2025
✓ PSAR flip + SMA-50 trend filter
✓ RSI ≤50 (avoids chasing)
✓ Only high-volume candles (bright colour)
✓ Loud mobile alerts with price & SL
✓ 1:2+ RR with PSAR trailing
Works like magic 9:15–11:30 AM and 2–3:20 PM
Made with love for the Indian trading community ♥

Today Low ± 50 LevelsThis script plots two dynamic horizontal lines based on today’s daily low. One line is placed 50 points above the low and the other 50 points below it. The lines update automatically each new day and appear on any timeframe

SMAs (10,50,100,200) by BenderDescription:
Multi-timeframe Simple Moving Average indicator displaying four popular SMAs (10, 50, 100, 200) commonly used for trend analysis and support/resistance levels. Each SMA is fully customizable with individual settings for period length, data source, timeframe, and color. Perfect for traders who want to view higher timeframe SMAs on lower timeframe charts or combine multiple timeframe analyses in one view.
Key Features:
Four independent SMAs with default periods of 10, 50, 100, and 200
Multi-timeframe capability - view daily SMAs on any chart timeframe
Fully customizable: length, source (close, open, high, low, etc.), timeframe, and color
Toggle each SMA on/off individually
Clean, organized settings menu with grouped parameters
Semi-transparent lines for better chart visibility
