"黄金近20年走势"に関するスクリプトを検索

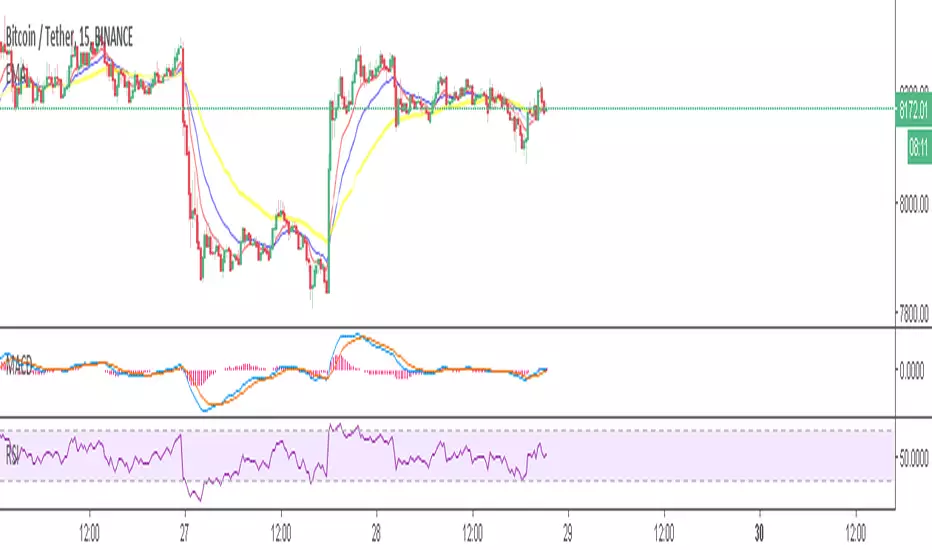
Multi Timeframe RSI 80 20 Different with 80 - 20 lines to help catch bottoms on multi time frames. The default was 70 - 30. Changed it to be more artistic the current RSI and 1 day are red the rest are white.


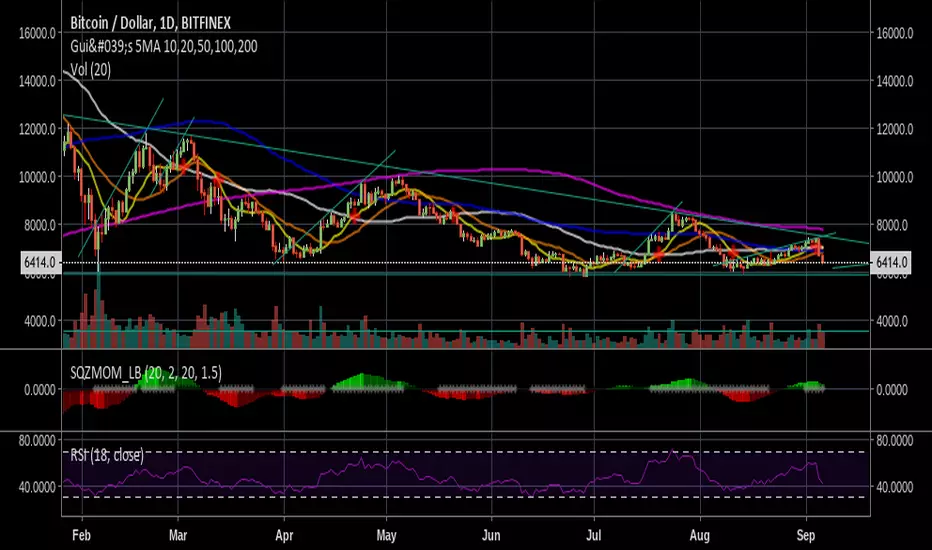
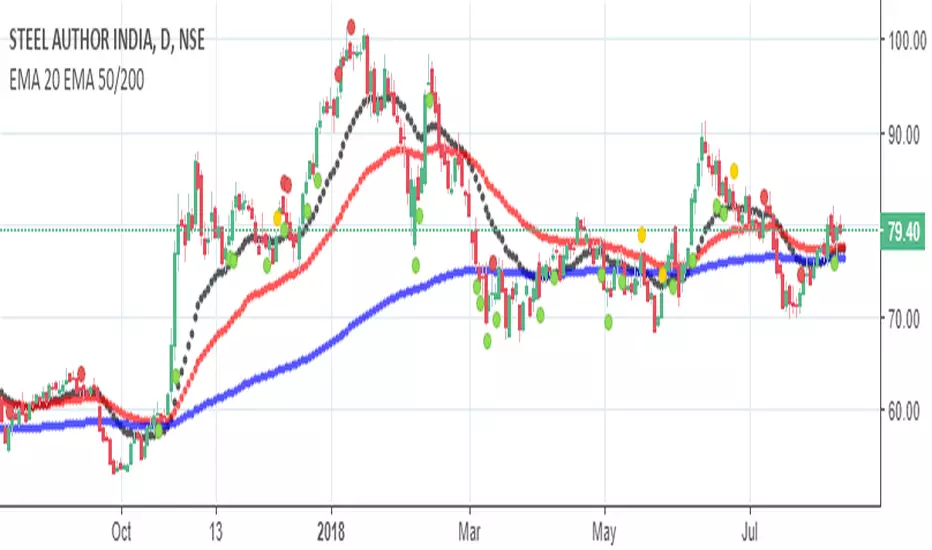
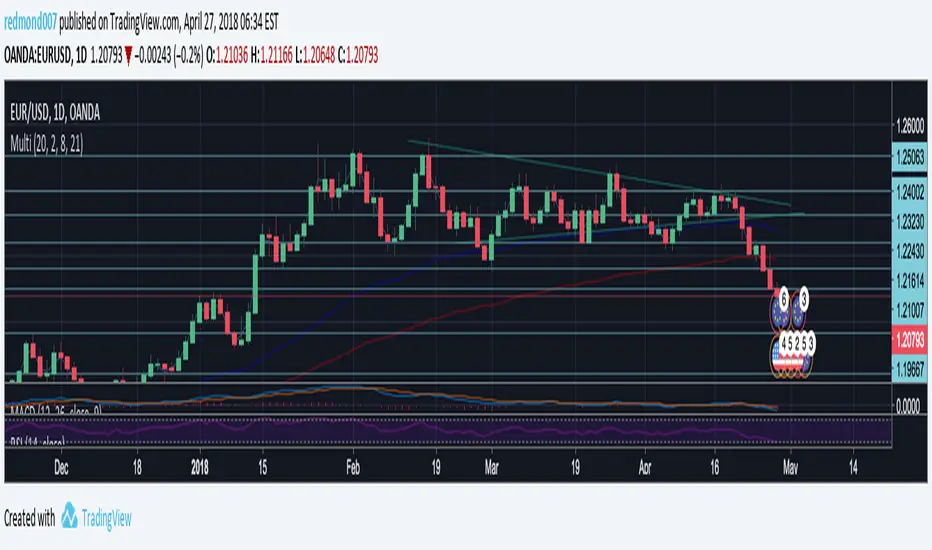
Gui's 5MA 10,20,50,100,2005 Simple Moving Averages for the 10, 20, 50, 100 and 200 day and a cross for whatever you want to read:P
Use it well! Buy high and sell low. Jk:P
Thank you!

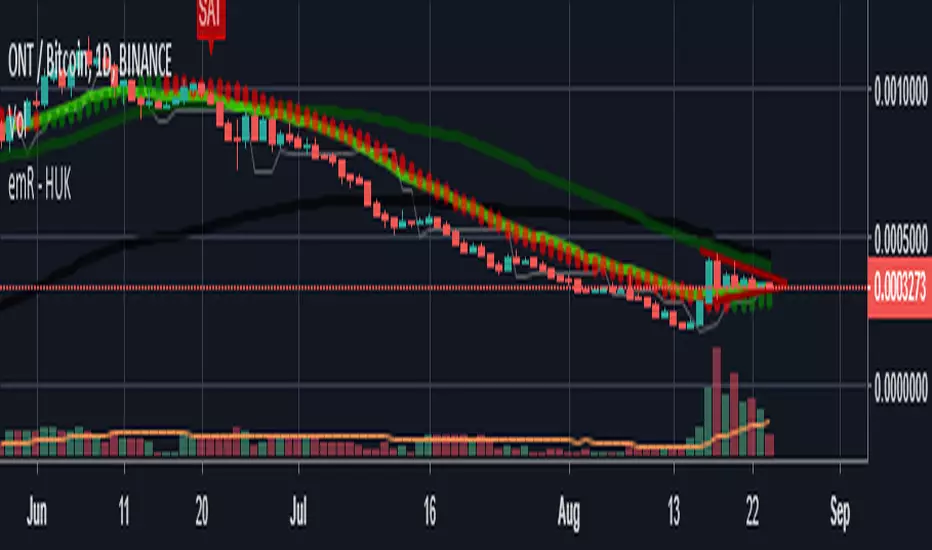
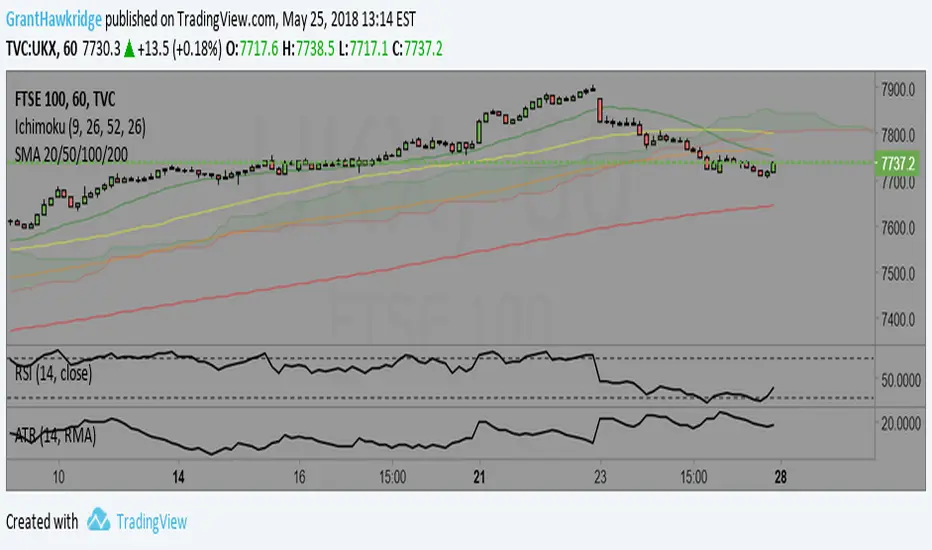
HUK ElasticVolume/50 MOVING AVERAGE e 50/200/20 Coral TrendElastic Volume Default Settings : 50 lenght!
Moving Average Default Settings:50 / 200
EMA Default Settings :20
Coral Trend Default Settings :21/0,4
Thank you ! emR Huk ..

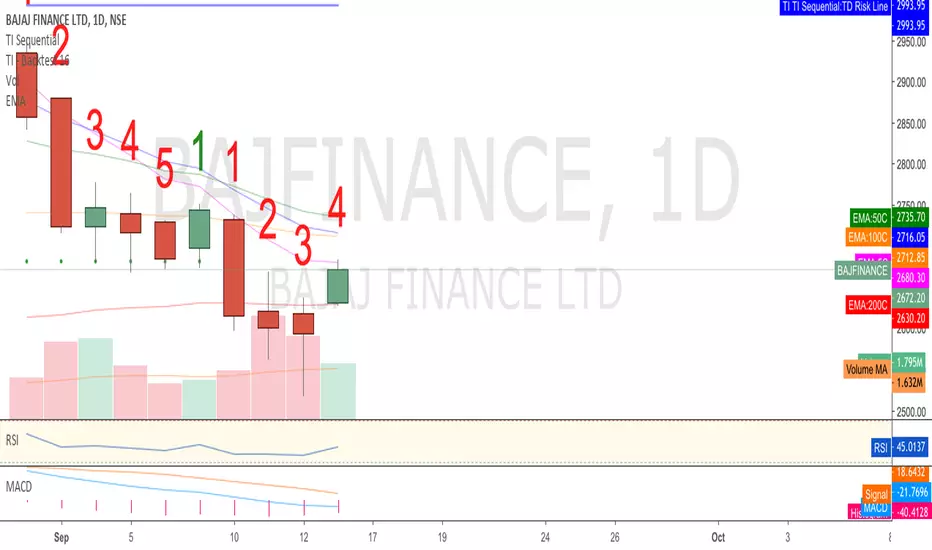
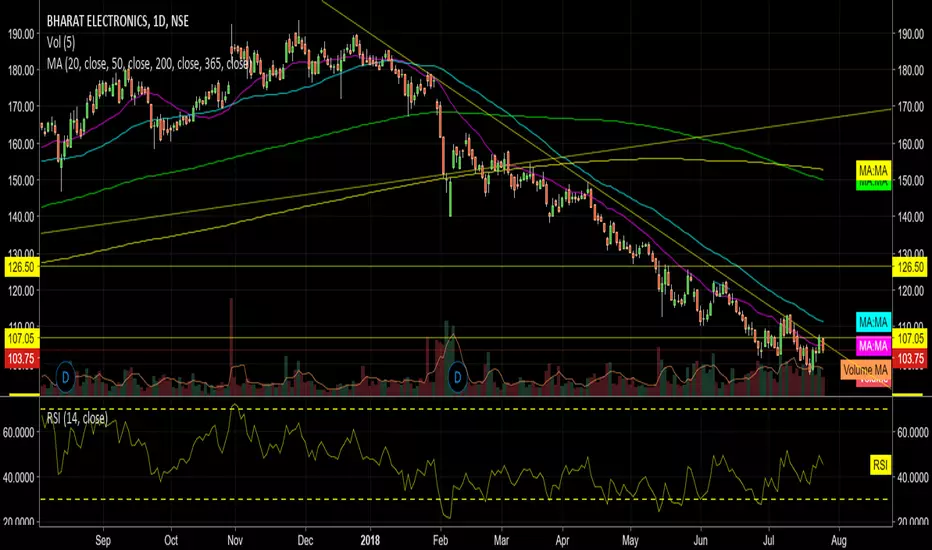
Anupam's MAs (20,50,200,365)This shows Multiple MAs of 20, 50, 200 and 365 as one common Indicator, thus it can save 4 Different Indicator inputs for Free users.

Multi Indicators v1 - 20 50 200 EMA/SMA, Bollinger Bands, VWAPMulti Indicators v1
20 50 200 EMA/SMA, Bollinger Bands, VWAP
These can be turned on and off
I'll be adding to this multi indicator in future updates

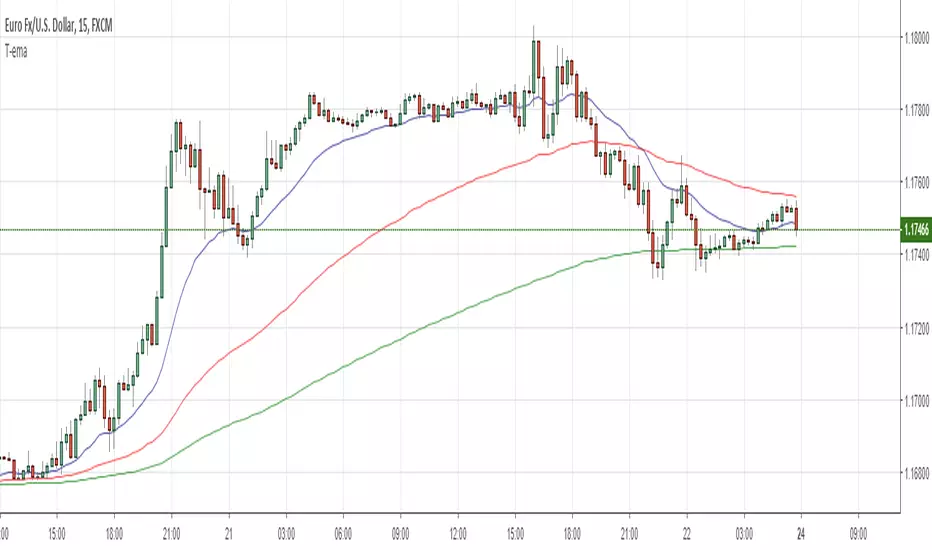
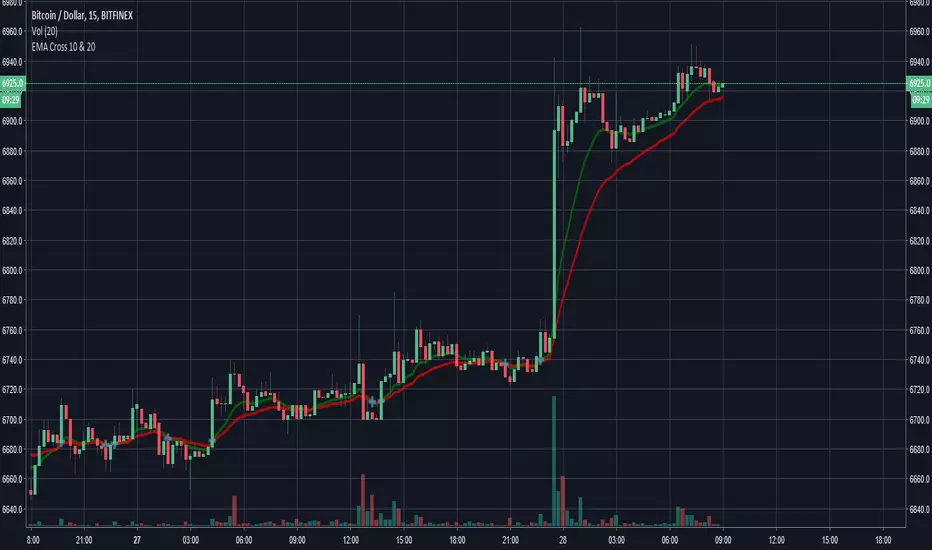
Multiple Ema 20/50/100Multiple Ema 20/50/100 and you can add more EMA Plot easily by changing the codes.

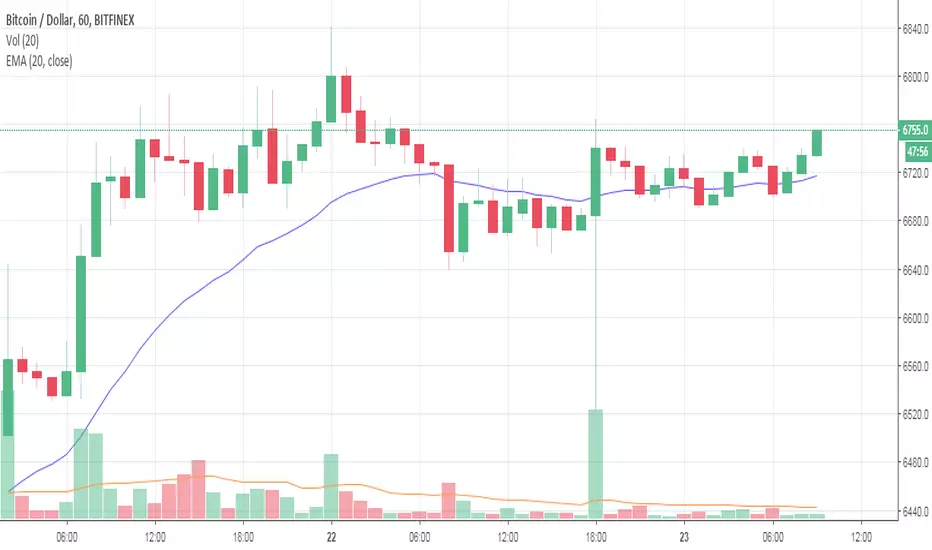
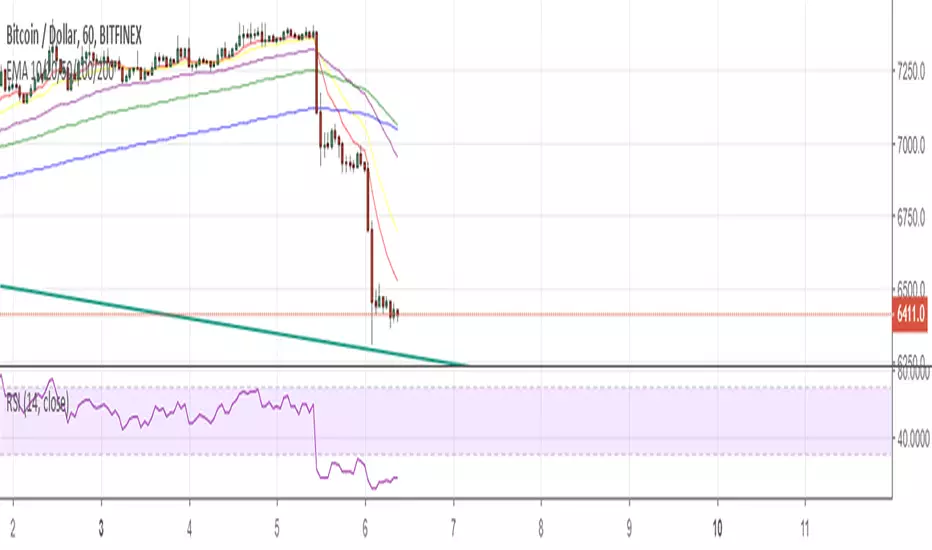
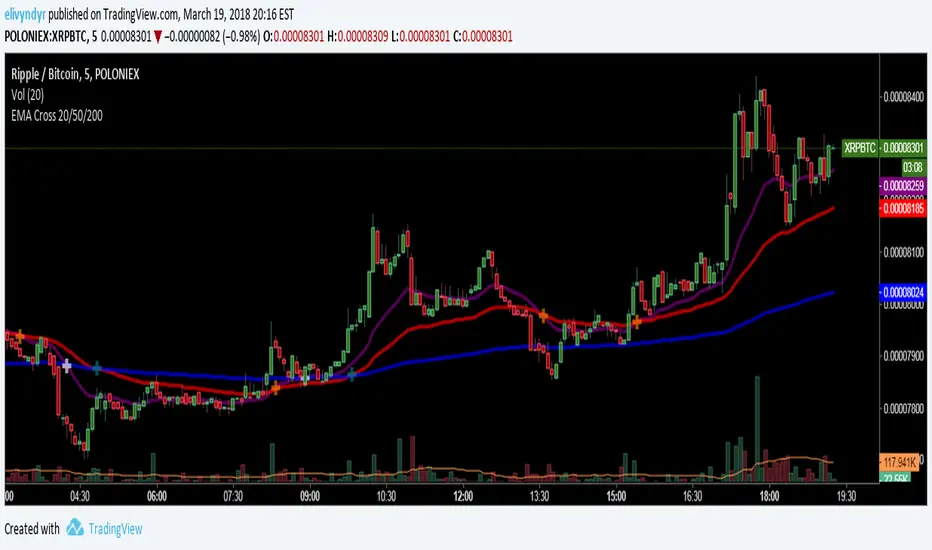
EMA Cross 20/50/200Added a 20 EMA cross to the avaiable 50/200 EMA Cross script in the public library
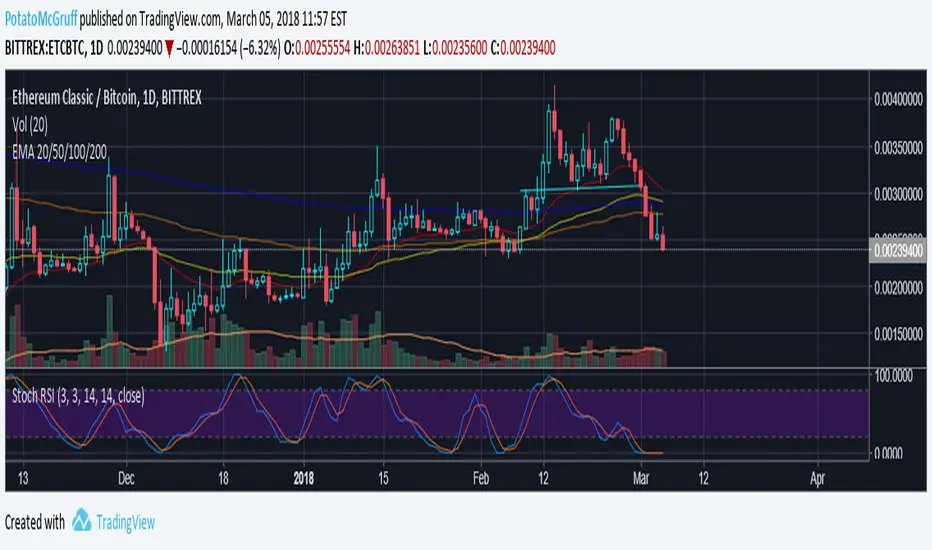
EMA 20/50/100/200Script that publishes the EMA for 20, 50, 100, and 200.
Follow me on Twitter at @PotatoMcGruff