XAU/USD Strategy with Correct ADX and Bollinger Bands Fill1. *Indicators Used*:
- *Exponential Moving Averages (EMAs)*: Two EMAs (20-period and 50-period) are used to identify the trend direction and potential entry points based on crossovers.
- *Relative Strength Index (RSI)*: A momentum oscillator that measures the speed and change of price movements. It identifies overbought and oversold conditions.
- *Bollinger Bands*: These consist of a middle line (simple moving average) and two outer bands (standard deviations away from the middle). They help to identify price volatility and potential reversal points.
- *Average Directional Index (ADX)*: This indicator quantifies trend strength. It's derived from the Directional Movement Index (DMI) and helps confirm the presence of a strong trend.
- *Average True Range (ATR)*: Used to calculate position size based on volatility, ensuring that trades align with the trader's risk tolerance.
2. *Entry Conditions*:
- *Long Entry*:
- The 20 EMA crosses above the 50 EMA (indicating a potential bullish trend).
- The RSI is below the oversold level (30), suggesting the asset may be undervalued.
- The price is below the lower Bollinger Band, indicating potential price reversal.
- The ADX is above a specified threshold (25), confirming that there is sufficient trend strength.
- *Short Entry*:
- The 20 EMA crosses below the 50 EMA (indicating a potential bearish trend).
- The RSI is above the overbought level (70), suggesting the asset may be overvalued.
- The price is above the upper Bollinger Band, indicating potential price reversal.
- The ADX is above the specified threshold (25), confirming trend strength.
3. *Position Sizing*:
- The script calculates the position size dynamically based on the trader's risk per trade (expressed as a percentage of the total capital) and the ATR. This ensures that the trader does not risk more than the specified percentage on any single trade, adjusting the position size according to market volatility.
4. *Exit Conditions*:
- The strategy uses a trailing stop-loss mechanism to secure profits as the price moves in the trader's favor. The trailing stop is set at a percentage (1.5% by default) below the highest price reached since entry for long positions and above the lowest price for short positions.
- Additionally, if the RSI crosses back above the overbought level while in a long position or below the oversold level while in a short position, the position is closed to prevent losses.
5. *Alerts*:
- Alerts are set to notify the trader when a buy or sell condition is met based on the strategy's rules. This allows for timely execution of trades.
### Summary
This strategy aims to capture significant price movements in the XAU/USD market by combining trend-following (EMAs, ADX) and momentum indicators (RSI, Bollinger Bands). The dynamic position sizing based on ATR helps manage risk effectively. By implementing trailing stops and alert mechanisms, the strategy enhances the trader's ability to act quickly on opportunities while mitigating potential losses.
"黄金近20年走势"に関するスクリプトを検索

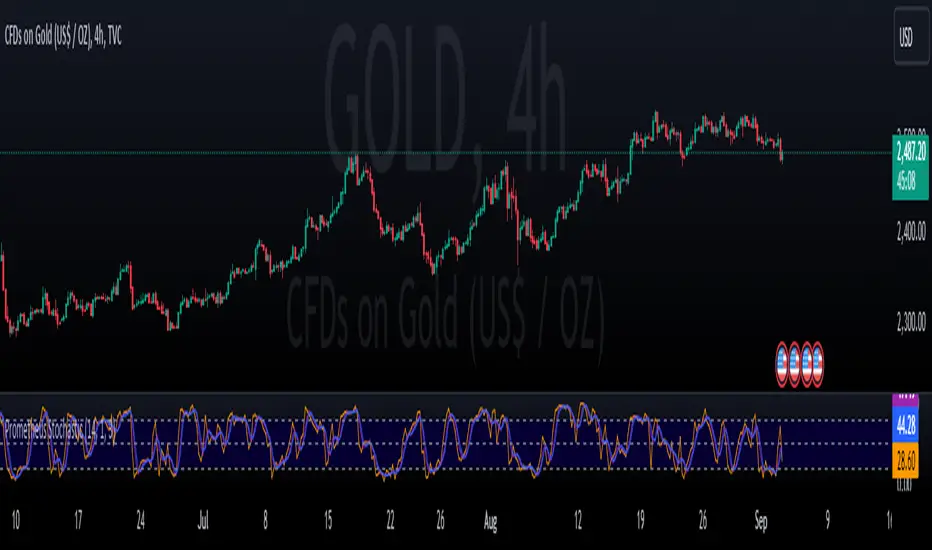
Prometheus StochasticThe Stochastic indicator is a popular indicator developed in the 1950s. It is designed to identify overbought and oversold scenarios on different assets. A value above 80 is considered overbought and a value below 20 is considered oversold.
The formula is as follows:
%k = ((Close - Low_i) / (High_i / Low_i)) * 100
Low_i and High_i represent the lowest low and highest high of the selected period.
The Prometheus version takes a slightly different approach:
%k = ((High - Lowest_Close_i) / (High_i / Low_i)) * 100
Using the Current High minus the Lowest Close provides us with a more robust range that can be slightly more sensitive to moves and provide a different perspective.
Code:
stoch_func(src_close, src_high, src_low, length) =>
100 * (src_high - ta.lowest(src_close, length)) / (ta.highest(src_high, length) - ta.lowest(src_low, length))
This is the function that returns our Stochastic indicator.
What period do we use for the calculation? Let Prometheus handle that, we utilize a Sum of Squared Error calculation to find what lookback values can be most useful for a trader. How we do it is we calculate a Simple Moving Average or SMA and the indicator using a lot of different bars back values. Then if there is an event, characterized by the indicator crossing above 80 or below 20, we subtract the close by the SMA and square it. If there is no event we return a big value, we want the error to be as small as possible. Because we loop over every value for bars back, we get the value with the smallest error. We also do this for the smoothing values.
// Function to calculate SSE for a given combination of N, K, and D
sse_calc(_N, _K, _D) =>
SMA = ta.sma(close, _N)
sf = stoch_func(close, high, low, _N)
k = ta.sma(sf, _K)
d = ta.sma(k, _D)
var float error = na
if ta.crossover(d, 80) or ta.crossunder(d, 20)
error := math.pow(close - SMA, 2)
else
error := 999999999999999999999999999999999999999
error
var int best_N = na
var int best_K = na
var int best_D = na
var float min_SSE = na
// Loop through all combinations of N, K, and D
for N in N_range
for K in K_range
for D in D_range
sse = sse_calc(N, K, D)
if (na(min_SSE) or sse < min_SSE)
min_SSE := sse
best_N := N
best_K := K
best_D := D
int N_opt = na
int K_opt = na
int D_opt = na
if c_lkb_bool == false
N_opt := best_N
K_opt := best_K
D_opt := best_D
This is the section where the best lookback values are calculated.
We provide the option to use this self optimizer or to use your own lookback values.
Here is an example on the daily AMEX:SPY chart. The top Stochastic is the value with the SSE calculation, the bottom is with a fixed 14, 1, 3 input values. We see in the candles with boxes where some potential differences and trades may be.
This is another comparison of the SSE functionality and the fixed lookbacks on the NYSE:PLTR 1 day chart.
Differences may be more apparent on lower time frame charts.
We encourage traders to not follow indicators blindly, none are 100% accurate. SSE does not guarantee that the values generated will be the best for a given moment in time. Please comment on any desired updates, all criticism is welcome!
RSI Trend Following StrategyOverview
The RSI Trend Following Strategy utilizes Relative Strength Index (RSI) to enter the trade for the potential trend continuation. It uses Stochastic indicator to check is the price is not in overbought territory and the MACD to measure the current price momentum. Moreover, it uses the 200-period EMA to filter the counter trend trades with the higher probability. The strategy opens only long trades.
Unique Features
Dynamic stop-loss system: Instead of fixed stop-loss level strategy utilizes average true range (ATR) multiplied by user given number subtracted from the position entry price as a dynamic stop loss level.
Configurable Trading Periods: Users can tailor the strategy to specific market windows, adapting to different market conditions.
Two layers trade filtering system: Strategy utilizes MACD and Stochastic indicators measure the current momentum and overbought condition and use 200-period EMA to filter trades against major trend.
Trailing take profit level: After reaching the trailing profit activation level script activates the trailing of long trade using EMA. More information in methodology.
Wide opportunities for strategy optimization: Flexible strategy settings allows users to optimize the strategy entries and exits for chosen trading pair and time frame.
Methodology
The strategy opens long trade when the following price met the conditions:
RSI is above 50 level.
MACD line shall be above the signal line
Both lines of Stochastic shall be not higher than 80 (overbought territory)
Candle’s low shall be above the 200 period EMA
When long trade is executed, strategy set the stop-loss level at the price ATR multiplied by user-given value below the entry price. This level is recalculated on every next candle close, adjusting to the current market volatility.
At the same time strategy set up the trailing stop validation level. When the price crosses the level equals entry price plus ATR multiplied by user-given value script starts to trail the price with trailing EMA(by default = 20 period). If price closes below EMA long trade is closed. When the trailing starts, script prints the label “Trailing Activated”.
Strategy settings
In the inputs window user can setup the following strategy settings:
ATR Stop Loss (by default = 1.75)
ATR Trailing Profit Activation Level (by default = 2.25)
MACD Fast Length (by default = 12, period of averaging fast MACD line)
MACD Fast Length (by default = 26, period of averaging slow MACD line)
MACD Signal Smoothing (by default = 9, period of smoothing MACD signal line)
Oscillator MA Type (by default = EMA, available options: SMA, EMA)
Signal Line MA Type (by default = EMA, available options: SMA, EMA)
RSI Length (by default = 14, period for RSI calculation)
Trailing EMA Length (by default = 20, period for EMA, which shall be broken close the trade after trailing profit activation)
Justification of Methodology
This trading strategy is designed to leverage a combination of technical indicators—Relative Strength Index (RSI), Moving Average Convergence Divergence (MACD), Stochastic Oscillator, and the 200-period Exponential Moving Average (EMA)—to determine optimal entry points for long trades. Additionally, the strategy uses the Average True Range (ATR) for dynamic risk management to adapt to varying market conditions. Let's look in details for which purpose each indicator is used for and why it is used in this combination.
Relative Strength Index (RSI) is a momentum indicator used in technical analysis to measure the speed and change of price movements in a financial market. It helps traders identify whether an asset is potentially overbought (overvalued) or oversold (undervalued), which can indicate a potential reversal or continuation of the current trend.
How RSI Works? RSI tracks the strength of recent price changes. It compares the average gains and losses over a specific period (usually 14 periods) to assess the momentum of an asset. Average gain is the average of all positive price changes over the chosen period. It reflects how much the price has typically increased during upward movements. Average loss is the average of all negative price changes over the same period. It reflects how much the price has typically decreased during downward movements.
RSI calculates these average gains and losses and compares them to create a value between 0 and 100. If the RSI value is above 70, the asset is generally considered overbought, meaning it might be due for a price correction or reversal downward. Conversely, if the RSI value is below 30, the asset is considered oversold, suggesting it could be poised for an upward reversal or recovery. RSI is a useful tool for traders to determine market conditions and make informed decisions about entering or exiting trades based on the perceived strength or weakness of an asset's price movements.
This strategy uses RSI as a short-term trend approximation. If RSI crosses over 50 it means that there is a high probability of short-term trend change from downtrend to uptrend. Therefore RSI above 50 is our first trend filter to look for a long position.
The MACD (Moving Average Convergence Divergence) is a popular momentum and trend-following indicator used in technical analysis. It helps traders identify changes in the strength, direction, momentum, and duration of a trend in an asset's price.
The MACD consists of three components:
MACD Line: This is the difference between a short-term Exponential Moving Average (EMA) and a long-term EMA, typically calculated as: MACD Line = 12 period EMA − 26 period EMA
Signal Line: This is a 9-period EMA of the MACD Line, which helps to identify buy or sell signals. When the MACD Line crosses above the Signal Line, it can be a bullish signal (suggesting a buy); when it crosses below, it can be a bearish signal (suggesting a sell).
Histogram: The histogram shows the difference between the MACD Line and the Signal Line, visually representing the momentum of the trend. Positive histogram values indicate increasing bullish momentum, while negative values indicate increasing bearish momentum.
This strategy uses MACD as a second short-term trend filter. When MACD line crossed over the signal line there is a high probability that uptrend has been started. Therefore MACD line above signal line is our additional short-term trend filter. In conjunction with RSI it decreases probability of following false trend change signals.
The Stochastic Indicator is a momentum oscillator that compares a security's closing price to its price range over a specific period. It's used to identify overbought and oversold conditions. The indicator ranges from 0 to 100, with readings above 80 indicating overbought conditions and readings below 20 indicating oversold conditions.
It consists of two lines:
%K: The main line, calculated using the formula (CurrentClose−LowestLow)/(HighestHigh−LowestLow)×100 . Highest and lowest price taken for 14 periods.
%D: A smoothed moving average of %K, often used as a signal line.
This strategy uses stochastic to define the overbought conditions. The logic here is the following: we want to avoid long trades in the overbought territory, because when indicator reaches it there is a high probability that the potential move is gonna be restricted.
The 200-period EMA is a widely recognized indicator for identifying the long-term trend direction. The strategy only trades in the direction of this primary trend to increase the probability of successful trades. For instance, when the price is above the 200 EMA, only long trades are considered, aligning with the overarching trend direction.
Therefore, strategy uses combination of RSI and MACD to increase the probability that price now is in short-term uptrend, Stochastic helps to avoid the trades in the overbought (>80) territory. To increase the probability of opening long trades in the direction of a main trend and avoid local bounces we use 200 period EMA.
ATR is used to adjust the strategy risk management to the current market volatility. If volatility is low, we don’t need the large stop loss to understand the there is a high probability that we made a mistake opening the trade. User can setup the settings ATR Stop Loss and ATR Trailing Profit Activation Level to realize his own risk to reward preferences, but the unique feature of a strategy is that after reaching trailing profit activation level strategy is trying to follow the trend until it is likely to be finished instead of using fixed risk management settings. It allows sometimes to be involved in the large movements.
Backtest Results
Operating window: Date range of backtests is 2023.01.01 - 2024.08.01. It is chosen to let the strategy to close all opened positions.
Commission and Slippage: Includes a standard Binance commission of 0.1% and accounts for possible slippage over 5 ticks.
Initial capital: 10000 USDT
Percent of capital used in every trade: 30%
Maximum Single Position Loss: -3.94%
Maximum Single Profit: +15.78%
Net Profit: +1359.21 USDT (+13.59%)
Total Trades: 111 (36.04% win rate)
Profit Factor: 1.413
Maximum Accumulated Loss: 625.02 USDT (-5.85%)
Average Profit per Trade: 12.25 USDT (+0.40%)
Average Trade Duration: 40 hours
These results are obtained with realistic parameters representing trading conditions observed at major exchanges such as Binance and with realistic trading portfolio usage parameters.
How to Use
Add the script to favorites for easy access.
Apply to the desired timeframe and chart (optimal performance observed on 2h BTC/USDT).
Configure settings using the dropdown choice list in the built-in menu.
Set up alerts to automate strategy positions through web hook with the text: {{strategy.order.alert_message}}
Disclaimer:
Educational and informational tool reflecting Skyrex commitment to informed trading. Past performance does not guarantee future results. Test strategies in a simulated environment before live implementation

Uptrick: SMA Pivot Marker### Uptrick: SMA Pivot Marker (SPM) — Extensive Guide
#### Introduction
The **Uptrick: SMA Pivot Marker (SPM)** is a sophisticated technical analysis tool crafted by Uptrick to help traders interpret market trends and identify key price levels where significant reversals might occur. By integrating the principles of the Simple Moving Average (SMA) with pivot point analysis, the SPM offers a comprehensive approach to understanding market dynamics. This extensive guide explores the purpose, functionality, and practical applications of the SPM, providing an in-depth analysis of its features, settings, and usage across various trading strategies.
#### Purpose of the SPM
The **SMA Pivot Marker (SPM)** aims to enhance trading strategies by offering a dual approach to market analysis:
1. **Trend Identification**:
- **Objective**: To discern the prevailing market direction and guide trading decisions based on the overall trend.
- **Method**: Utilizes the SMA to smooth out price fluctuations, providing a clearer picture of the trend. This helps traders align their trades with the market's direction, increasing the probability of successful trades.
2. **Pivot Point Detection**:
- **Objective**: To identify key levels where the price is likely to reverse, providing potential support and resistance zones.
- **Method**: Calculates and marks pivot highs and lows, which are significant price points where previous trends have reversed. These levels are used to predict future price movements and establish trading strategies.
3. **Trend Change Alerts**:
- **Objective**: To notify traders of potential shifts in market direction, enabling timely adjustments to trading positions.
- **Method**: Detects and highlights crossover and crossunder points of the smoothed line, indicating possible trend changes. This helps traders react promptly to changing market conditions.
#### Detailed Functionality
1. **Smoothing Line Calculation**:
- **Simple Moving Average (SMA)**:
- **Definition**: The SMA is a type of moving average that calculates the average of a security’s price over a specified number of periods. It smooths out price data to filter out short-term fluctuations and highlight the longer-term trend.
- **Calculation**: The SMA is computed by summing the closing prices of the chosen number of periods and then dividing by the number of periods. For example, a 20-period SMA adds the closing prices for the past 20 periods and divides by 20.
- **Purpose**: The SMA helps in identifying the direction of the trend. A rising SMA indicates an uptrend, while a falling SMA indicates a downtrend. This smoothing helps traders to avoid being misled by short-term price noise.
2. **Pivot Points Calculation**:
- **Pivot Highs and Lows**:
- **Definition**: Pivot points are significant price levels where a market trend is likely to reverse. A pivot high is the highest price over a certain period, surrounded by lower prices on both sides, while a pivot low is the lowest price surrounded by higher prices.
- **Calculation**: The SPM calculates pivot points based on a user-defined lookback period. For instance, if the lookback period is set to 3, the indicator will find the highest and lowest prices within the past 3 periods and mark these points.
- **Purpose**: Pivot points are used to identify potential support and resistance levels. Traders often use these levels to set entry and exit points, stop-loss orders, and to gauge market sentiment.
3. **Visualization**:
- **Smoothed Line Plot**:
- **Description**: The smoothed line, calculated using the SMA, is plotted on the chart to provide a visual representation of the trend. This line adjusts its color based on the trend direction, helping traders quickly assess the market condition.
- **Color Coding**: The smoothed line is colored green (upColor) when it is rising, indicating a bullish trend, and red (downColor) when it is falling, indicating a bearish trend. This color-coding helps traders visually differentiate between uptrends and downtrends.
- **Line Width**: The width of the line can be adjusted to improve visibility. A thicker line may be more noticeable, while a thinner line might provide a cleaner look on the chart.
- **Pivot Markers**:
- **Description**: Pivot highs and lows are marked on the chart with lines and labels. These markers help in visually identifying significant price levels.
- **Color and Labels**: Pivot highs are represented with green lines and labels ("H"), while pivot lows are marked with red lines and labels ("L"). This color scheme and labeling make it easy to distinguish between resistance (highs) and support (lows).
4. **Trend Change Detection**:
- **Trend Up**:
- **Detection**: The indicator identifies an upward trend change when the smoothed line crosses above its previous value. This crossover suggests a potential shift from a downtrend to an uptrend.
- **Usage**: Traders can interpret this signal as a potential buying opportunity or an indication to review and possibly adjust their trading positions to align with the new uptrend.
- **Trend Down**:
- **Detection**: A downward trend change is detected when the smoothed line crosses below its previous value. This crossunder indicates a potential shift from an uptrend to a downtrend.
- **Usage**: This signal can be used to consider selling opportunities or to reassess long positions in light of the emerging downtrend.
#### User Inputs
1. **Smoothing Period**:
- **Description**: This input determines the number of periods over which the SMA is calculated. It directly affects the smoothness of the line and the sensitivity of trend detection.
- **Range**: The smoothing period can be set to any integer value greater than or equal to 1. There is no specified upper limit, offering flexibility for various trading styles.
- **Default Value**: The default smoothing period is 20, which is a common choice for medium-term trend analysis.
- **Impact**: A longer smoothing period results in a smoother line, filtering out more noise and highlighting long-term trends. A shorter period makes the line more responsive to recent price changes, which can be useful for short-term trading strategies.
2. **Pivot Lookback**:
- **Description**: This input specifies the number of periods used to calculate the pivot highs and lows. It influences the sensitivity of pivot point detection and the relevance of the identified levels.
- **Range**: The pivot lookback period can be set to any integer value greater than or equal to 1, with no upper limit. Traders can adjust this parameter based on their trading timeframe and preferences.
- **Default Value**: The default lookback period is 3, which provides a balance between detecting significant pivots and avoiding excessive noise.
- **Impact**: A longer lookback period generates more stable pivot points, suitable for identifying long-term support and resistance levels. A shorter lookback period results in more frequent and recent pivot points, useful for intraday trading and quick responses to price changes.
#### Applications for Different Traders
1. **Trend Followers**:
- **Using the SMA**: Trend followers utilize the smoothed line to gauge the direction of the market. By aligning trades with the direction of the SMA, traders can capitalize on sustained trends and improve their chances of success.
- **Trend Change Alerts**: The trend change markers alert trend followers to potential shifts in market direction. These alerts help traders make timely decisions to enter or exit positions, ensuring they stay aligned with the prevailing trend.
2. **Reversal Traders**:
- **Pivot Points**: Reversal traders focus on pivot highs and lows to identify potential reversal points in the market. These points indicate where the market has previously reversed direction, providing potential entry and exit levels for trades.
- **Pivot Markers**: The visual markers for pivot highs and lows serve as clear signals for reversal traders. By monitoring these levels, traders can anticipate price reversals and plan their trades to exploit these opportunities.
3. **Swing Traders**:
- **Combining SMA and Pivot Points**: Swing traders can use the combination of the smoothed line and pivot points to identify medium-term trading opportunities. The smoothed line helps in understanding the broader trend, while pivot points provide specific levels for potential swings.
- **Trend Change Alerts**: Trend change markers help swing traders spot new swing opportunities as the market shifts direction. These markers provide potential entry points for swing trades and help traders adjust their strategies to capitalize on market movements.
4. **Scalpers**:
- **Short-Term Analysis**: Scalpers benefit from the short-term signals provided by the SPM. The smoothed line and pivot points offer insights into rapid price movements, while the trend change markers highlight quick trading opportunities.
- **Pivot Points**: For scalpers, pivot points are particularly useful in identifying key levels where price may reverse within a short time frame. By focusing on these levels, scalpers can plan trades with tight stop-loss orders and capitalize on quick price changes.
#### Implementation and Best Practices
1. **Setting Parameters**:
- **Smoothing Period**: Adjust the smoothing period according to your trading strategy and market conditions. For long-term analysis, use a longer period to filter out noise and highlight broader trends. For short-term trading, a shorter period provides more immediate insights into price movements.
- **Pivot Lookback**: Choose a lookback period that matches your trading timeframe. For intraday trading, a shorter lookback period offers quick identification of recent price levels. For swing trading or long-term strategies, a longer lookback period provides more stable pivot points.
2. **Combining with Other Indicators**:
- **Integration with Technical Tools**: The SPM can be used in conjunction with other technical indicators to enhance trading decisions. For instance, combining the
SPM with indicators like RSI (Relative Strength Index) or MACD (Moving Average Convergence Divergence) can provide additional confirmation for trend signals and pivot points.
- **Support and Resistance**: Integrate the SPM’s pivot points with other support and resistance levels to gain a comprehensive view of market conditions. This combined approach helps in identifying stronger levels of support and resistance, improving trade accuracy.
3. **Backtesting**:
- **Historical Performance**: Conduct backtesting with historical data to evaluate the effectiveness of the SPM. Analyze past performance to fine-tune the smoothing period and pivot lookback settings, ensuring they align with your trading style and market conditions.
- **Scenario Analysis**: Test the SPM under various market scenarios to understand its performance in different conditions. This analysis helps in assessing the reliability of the indicator and making necessary adjustments for diverse market environments.
4. **Customization**:
- **Visual Adjustments**: Customize the appearance of the smoothed line and pivot markers to enhance chart readability and match personal preferences. Clear visual representation of these elements improves the effectiveness of the indicator.
- **Alert Configuration**: Set up alerts for trend changes to receive timely notifications. Alerts help traders act quickly on potential market shifts without constant monitoring, allowing for more efficient trading decisions.
#### Conclusion
The **Uptrick: SMA Pivot Marker (SPM)** is a versatile and powerful technical analysis tool that combines the benefits of the Simple Moving Average with pivot point analysis. By providing insights into market trends, identifying key reversal points, and detecting trend changes, the SPM caters to a wide range of trading strategies, including trend following, reversal trading, swing trading, and scalping.
With its customizable inputs, visual markers, and trend change alerts, the SPM offers traders the flexibility to adapt the indicator to different market conditions and trading styles. Whether used independently or in conjunction with other technical tools, the SPM is designed to enhance trading decision-making and improve overall trading performance. By mastering the use of the SPM, traders can gain a valuable edge in navigating the complexities of financial markets and making more informed trading decisions.

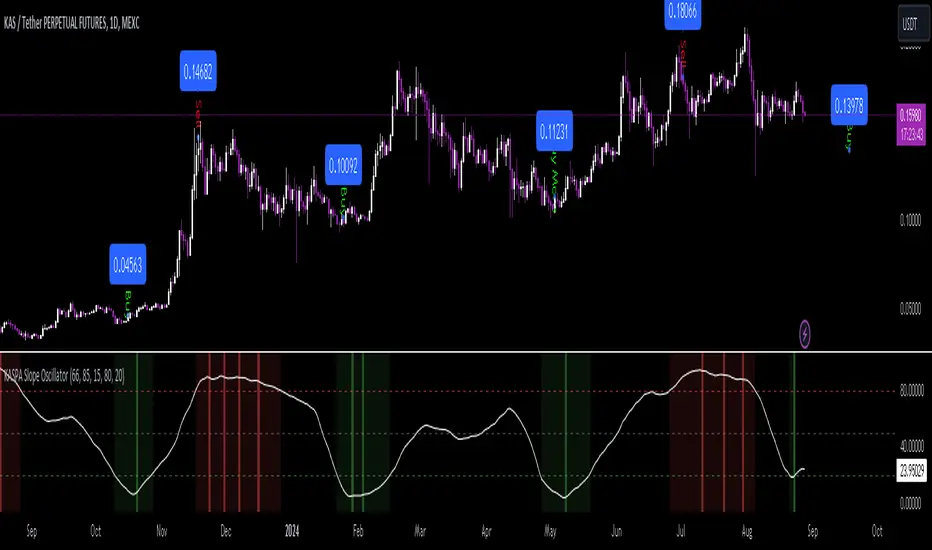
KASPA Slope OscillatorKASPA Slope Oscillator for analyzing KASPA on the 1D (daily) chart.
The indicator is plotted in a separate pane below the price chart and uses a mathematical approach to calculate and visualize the momentum or "slope" of KASPA's price movements.
Input Parameters:
Slope Window (days):
Defines the period (66 days by default) over which the slope is calculated.
Normalization Window (days):
The window size (85 days) for normalizing the slope values between 0 and 100.
Smoothing Period:
The number of days (15 days) over which the slope values are smoothed to reduce noise.
Overbought and Oversold Levels:
Threshold levels set at 80 (overbought) and 20 (oversold), respectively.
Calculation of the Slope:
Logarithmic Price Calculation:
Converts the close price of KASPA into a logarithmic scale to account for exponential growth or decay.
Rolling Slope:
Computes the rate of change in logarithmic prices over the defined slope window.
Normalization:
The slope is normalized between 0 and 100, allowing easier identification of extreme values.
Smoothing and Visualization:
Smoothing the Slope:
A Simple Moving Average (SMA) is applied to the normalized slope for the specified smoothing period.
Plotting the Oscillator:
The smoothed slope is plotted on the oscillator chart. Horizontal lines indicate overbought (80), oversold (20), and the mid-level (50).
Background Color Indications:
Background colors (red or green) indicate when the slope crosses above the overbought or below the oversold levels, respectively, signaling potential buy or sell conditions.
Detection of Local Maxima and Minima:
The code identifies local peaks (maxima) above the overbought level and troughs (minima) below the oversold level.
Vertical background lines are highlighted in red or green at these points, signaling potential reversals.
Short Summary:
The oscillator line fluctuates between 0 and 100, representing the normalized momentum of the price.
Red background areas indicate periods when the oscillator is above the overbought level (80), suggesting a potential overbought condition or a sell signal.
Green background areas indicate periods when the oscillator is below the oversold level (20), suggesting a potential oversold condition or a buy signal.
The vertical lines on the background mark local maxima and minima where price reversals may occur.
(I also want to thank @ForgoWork for optimizing visuality and cleaning up the source code)
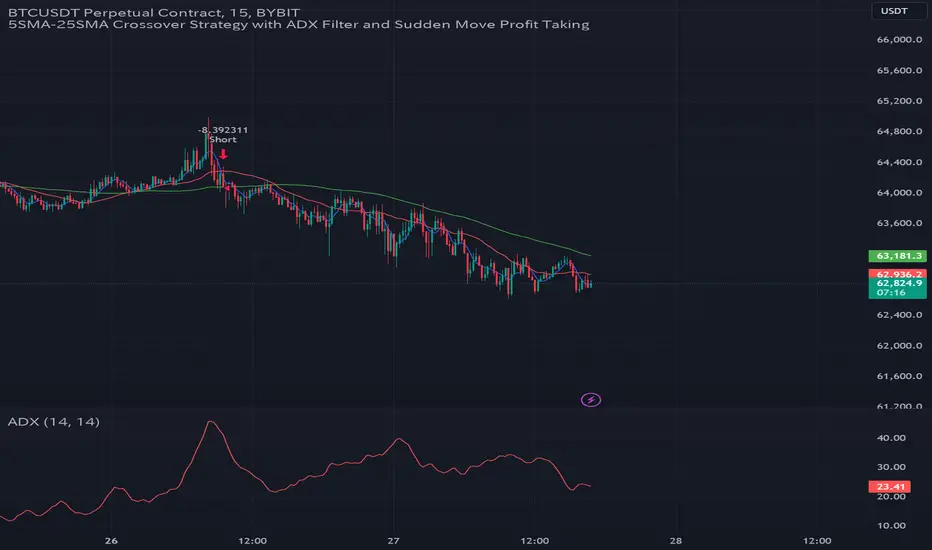
GC Strategy with Trend Filter and Sudden Move Profit TakingBYBIT:BTCUSDT.P 15M
Situation Assessment with Three Moving Averages
The strategy uses the crossover of the 5SMA and 25SMA as entry signals.
Additionally, the 75SMA is used as a filter. Long entries are only allowed when the price is above the 75SMA, and short entries are only allowed when the price is below the 75SMA.
ADX Filter
The Average Directional Index (ADX) is used to check the strength of the trend. Entry signals are only activated when the ADX is above 20. This ensures that trades are only executed when the trend is strong.
Sudden Move Detection
The strategy detects sudden price movements. If a sudden move occurs, the position is closed to lock in profits.
Entry
Long Entry: When the 5SMA crosses above the 25SMA, the price is above the 75SMA, and the ADX is above 20.
Short Entry: When the 5SMA crosses below the 25SMA, the price is below the 75SMA, and the ADX is above 20.
Exit
Positions are closed if a sudden move occurs. Positions are also closed if an opposing entry signal is generated.
This strategy aims to confirm the strength of the trend using moving average crossovers and ADX and to lock in profits based on sudden price movements.
3本の移動平均線による状況判断
5SMAと25SMA のクロスオーバーをエントリーシグナルとして使用します。
さらに、75SMAをフィルターとして使用し、価格が75SMAの上にある場合のみロングエントリーを許可し、75SMAの下にある場合のみショートエントリーを許可します。
ADXフィルター
ADX(平均方向性指数)を使ってトレンドの強さを確認します。
ADXが20より大きい場合のみ、エントリーシグナルを有効にします。これにより、トレンドが強い時にのみ取引を行うことができます。
急激な変動検知
価格の急激な変動を検出します。
急激な変動があった場合には、ポジションをクローズして利益を確定します。
エントリー
ロングエントリー
5SMAが25SMAを上にクロスし、価格が75SMAの上にあり、ADXが20を超えているとき。
ショートエントリー
5SMAが25SMAを下にクロスし、価格が75SMAの下にあり、ADXが20を超えているとき。
エグジット
急激な変動があった場合、ポジションをクローズします。
反対のエントリーシグナルが発生した場合にも、ポジションをクローズします。
このストラテジーは、移動平均のクロスオーバーとADXを使ってトレンドの強さを確認し、急激な変動に基づいて利益を確定することを目的としています。
Uptrick: Trend SMA Oscillator### In-Depth Analysis of the "Uptrick: Trend SMA Oscillator" Indicator
---
#### Introduction to the Indicator
The "Uptrick: Trend SMA Oscillator" is an advanced yet user-friendly technical analysis tool designed to help traders across all levels of experience identify and follow market trends with precision. This indicator builds upon the fundamental principles of the Simple Moving Average (SMA), a cornerstone of technical analysis, to deliver a clear, visually intuitive overlay on the price chart. Through its strategic use of color-coding and customizable parameters, the Uptrick: Trend SMA Oscillator provides traders with actionable insights into market dynamics, enhancing their ability to make informed trading decisions.
#### Core Concepts and Methodology
1. **Foundational Principle – Simple Moving Average (SMA):**
- The Simple Moving Average (SMA) is the heart of the Uptrick: Trend SMA Oscillator. The SMA is a widely-used technical indicator that calculates the average price of an asset over a specified number of periods. By smoothing out price data, the SMA helps to reduce the noise from short-term fluctuations, providing a clearer picture of the overall trend.
- In the Uptrick: Trend SMA Oscillator, two SMAs are employed:
- **Primary SMA (oscValue):** This is applied to the closing price of the asset over a user-defined period (default is 14 periods). This SMA tracks the price closely and is sensitive to changes in market direction.
- **Smoothing SMA (oscV):** This second SMA is applied to the primary SMA, further smoothing the data and helping to filter out minor price movements that might otherwise be mistaken for trend reversals. The default period for this smoothing is 50, but it can be adjusted to suit the trader's preference.
2. **Color-Coding for Trend Visualization:**
- One of the most distinctive features of this indicator is its use of color to represent market trends. The indicator’s line changes color based on the relationship between the primary SMA and the smoothing SMA:
- **Bullish (Green):** The line turns green when the primary SMA is equal to or greater than the smoothing SMA, indicating that the market is in an upward trend.
- **Bearish (Red):** Conversely, the line turns red when the primary SMA falls below the smoothing SMA, signaling a downward trend.
- This color-coded system provides traders with an immediate, easy-to-interpret visual cue about the market’s direction, allowing for quick decision-making.
#### Detailed Explanation of Inputs
1. **Bullish Color (Default: Green #00ff00):**
- This input allows traders to customize the color that represents bullish trends on the chart. The default setting is green, a color commonly associated with upward market movement. However, traders can adjust this to any color that suits their visual preferences or matches their overall chart theme.
2. **Bearish Color (Default: Red RGB: 245, 0, 0):**
- The bearish color input determines the color of the line when the market is trending downwards. The default setting is a vivid red, signaling caution or selling opportunities. Like the bullish color, this can be customized to fit the trader’s needs.
3. **Line Thickness (Default: 5):**
- This setting controls the thickness of the line plotted by the indicator. The default thickness of 5 makes the line prominent on the chart, ensuring that the trend is easily visible even in complex or crowded chart setups. Traders can adjust the thickness to make the line thinner or thicker, depending on their visual preferences.
4. **Primary SMA Period (Value 1 - Default: 14):**
- The primary SMA period defines how many periods (e.g., days, hours) are used to calculate the moving average based on the asset’s closing prices. The default period of 14 is a balanced setting that offers a good mix of responsiveness and stability, but traders can adjust this depending on their trading style:
- **Shorter Periods (e.g., 5-10):** These make the indicator more sensitive, capturing trends more quickly but also increasing the likelihood of reacting to short-term price fluctuations or "noise."
- **Longer Periods (e.g., 20-50):** These smooth the data more, providing a more stable trend line that is less prone to whipsaws but may be slower to respond to trend changes.
5. **Smoothing SMA Period (Value 2 - Default: 50):**
- The smoothing SMA period determines how much the primary SMA is smoothed. A longer smoothing period results in a more gradual, stable line that focuses on the broader trend. The default of 50 is designed to smooth out most of the short-term fluctuations while still being responsive enough to detect significant trend shifts.
- **Customization:**
- **Shorter Smoothing Periods (e.g., 20-30):** Make the indicator more responsive, better for fast-moving markets or for traders who want to capture quick trends.
- **Longer Smoothing Periods (e.g., 70-100):** Enhance stability, ideal for long-term traders looking to avoid reacting to minor price movements.
#### Unique Characteristics and Advantages
1. **Simplicity and Clarity:**
- The Uptrick: Trend SMA Oscillator’s design prioritizes simplicity without sacrificing effectiveness. By relying on the widely understood SMA, it avoids the complexity of more esoteric indicators while still providing reliable trend signals. This simplicity makes it accessible to traders of all levels, from novices who are just learning about technical analysis to experienced traders looking for a straightforward, dependable tool.
2. **Visual Feedback Mechanism:**
- The indicator’s use of color to signify market trends is a particularly powerful feature. This visual feedback mechanism allows traders to assess market conditions at a glance. The clarity of the green and red color scheme reduces the mental effort required to interpret the indicator, freeing the trader to focus on strategy execution.
3. **Adaptability Across Markets and Timeframes:**
- One of the strengths of the Uptrick: Trend SMA Oscillator is its versatility. The basic principles of moving averages apply equally well across different asset classes and timeframes. Whether trading stocks, forex, commodities, or cryptocurrencies, traders can use this indicator to gain insights into market trends.
- **Intraday Trading:** For day traders who operate on short timeframes (e.g., 1-minute, 5-minute charts), the oscillator can be adjusted to be more responsive, capturing quick shifts in momentum.
- **Swing Trading:** Swing traders, who typically hold positions for several days to weeks, will find the default settings or slightly adjusted periods ideal for identifying and riding medium-term trends.
- **Long-Term Trading:** Position traders and investors can adjust the indicator to focus on long-term trends by increasing the periods for both the primary and smoothing SMAs, filtering out minor fluctuations and highlighting sustained market movements.
4. **Minimal Lag:**
- One of the challenges with moving averages is lag—the delay between when the price changes and when the indicator reflects this change. The Uptrick: Trend SMA Oscillator addresses this by allowing traders to adjust the periods to find a balance between responsiveness and stability. While all SMAs inherently have some lag, the customizable nature of this indicator helps traders mitigate this effect to align with their specific trading goals.
5. **Customizable and Intuitive:**
- While many technical indicators come with a fixed set of parameters, the Uptrick: Trend SMA Oscillator is fully customizable, allowing traders to tailor it to their trading style, market conditions, and personal preferences. This makes it a highly flexible tool that can be adjusted as markets evolve or as a trader’s strategy changes over time.
#### Practical Applications for Different Trader Profiles
1. **Day Traders:**
- **Use Case:** Day traders can customize the SMA periods to create a faster, more responsive indicator. This allows them to capture short-term trends and make quick decisions. For example, reducing the primary SMA to 5 and the smoothing SMA to 20 can help day traders react promptly to intraday price movements.
- **Strategy Integration:** Day traders might use the Uptrick: Trend SMA Oscillator in conjunction with volume-based indicators to confirm the strength of a trend before entering or exiting trades.
2. **Swing Traders:**
- **Use Case:** Swing traders can use the default settings or slightly adjust them to smooth out minor price fluctuations while still capturing medium-term trends. This approach helps in identifying the optimal points to enter or exit trades based on the broader market direction.
- **Strategy Integration:** Swing traders can combine this indicator with oscillators like the Relative Strength Index (RSI) to confirm overbought or oversold conditions, thereby refining their entry and exit strategies.
3. **Position Traders:**
- **Use Case:** Position traders, who hold trades for extended periods, can extend the SMA periods to focus on long-term trends. By doing so, they minimize the impact of short-term market noise and focus on the underlying trend.
- **Strategy Integration:** Position traders might use the Uptrick: Trend SMA Oscillator in combination with fundamental analysis. The indicator can help confirm the timing of entries and exits based on broader economic or corporate developments.
4. **Algorithmic and Quantitative Traders:**
- **Use Case:** The simplicity and clear logic of the Uptrick: Trend SMA Oscillator make it an excellent candidate for algorithmic trading strategies. Its binary output—bullish or bearish—can be easily coded into automated trading systems.
- **Strategy Integration:** Quant traders might use the indicator as part of a larger trading system that incorporates multiple indicators and rules, optimizing the SMA periods based on historical backtesting to achieve the best results.
5. **Novice Traders:**
- **Use Case:** Beginners can use the Uptrick: Trend SMA Oscillator to learn the basics of trend-following strategies.
The visual simplicity of the color-coded line helps novice traders quickly understand market direction without the need to interpret complex data.
- **Educational Value:** The indicator serves as an excellent starting point for those new to technical analysis, providing a practical example of how moving averages work in a real-world trading environment.
#### Combining the Indicator with Other Tools
1. **Relative Strength Index (RSI):**
- The RSI is a momentum oscillator that measures the speed and change of price movements. When combined with the Uptrick: Trend SMA Oscillator, traders can look for instances where the RSI shows divergence from the price while the oscillator confirms the trend. This can be a powerful signal of an impending reversal or continuation.
2. **Moving Average Convergence Divergence (MACD):**
- The MACD is another popular trend-following momentum indicator. By using it alongside the Uptrick: Trend SMA Oscillator, traders can confirm the strength of a trend and identify potential entry and exit points with greater confidence. For example, a bullish crossover on the MACD that coincides with the Uptrick: Trend SMA Oscillator turning green can be a strong buy signal.
3. **Volume Indicators:**
- Volume is often considered the fuel behind price movements. Using volume indicators like the On-Balance Volume (OBV) or Volume Weighted Average Price (VWAP) in conjunction with the Uptrick: Trend SMA Oscillator can help traders confirm the validity of a trend. A trend identified by the oscillator that is supported by increasing volume is typically more reliable.
4. **Fibonacci Retracement:**
- Fibonacci retracement levels are used to identify potential reversal levels in a trending market. When the Uptrick: Trend SMA Oscillator indicates a trend, traders can use Fibonacci retracement levels to find potential entry points that align with the broader trend direction.
#### Implementation in Different Market Conditions
1. **Trending Markets:**
- The Uptrick: Trend SMA Oscillator excels in trending markets, where it provides clear signals on the direction of the trend. In a strong uptrend, the line will remain green, helping traders stay in the trade for longer periods. In a downtrend, the red line will signal the continuation of bearish conditions, prompting traders to stay short or avoid long positions.
2. **Sideways or Range-Bound Markets:**
- In range-bound markets, where price oscillates within a confined range without a clear trend, the Uptrick: Trend SMA Oscillator may produce more frequent changes in color. While this could indicate potential reversals at the range boundaries, traders should be cautious of false signals. It may be beneficial to pair the oscillator with a volatility indicator to better navigate such conditions.
3. **Volatile Markets:**
- In highly volatile markets, where prices can swing rapidly, the sensitivity of the Uptrick: Trend SMA Oscillator can be adjusted by modifying the SMA periods. A shorter SMA period might capture quick trends, but traders should be aware of the increased risk of whipsaws. Combining the oscillator with a volatility filter or using it in a higher time frame might help mitigate some of this risk.
#### Final Thoughts
The "Uptrick: Trend SMA Oscillator" is a versatile, easy-to-use indicator that stands out for its simplicity, visual clarity, and adaptability. It provides traders with a straightforward method to identify and follow market trends, using the well-established concept of moving averages. The indicator’s customizable nature makes it suitable for a wide range of trading styles, from day trading to long-term investing, and across various asset classes.
By offering immediate visual feedback through color-coded signals, the Uptrick: Trend SMA Oscillator simplifies the decision-making process, allowing traders to focus on execution rather than interpretation. Whether used on its own or as part of a broader technical analysis toolkit, this indicator has the potential to enhance trading strategies and improve overall performance.
Its accessibility and ease of use make it particularly appealing to novice traders, while its adaptability and reliability ensure that it remains a valuable tool for more experienced market participants. As markets continue to evolve, the Uptrick: Trend SMA Oscillator remains a timeless tool, rooted in the fundamental principles of technical analysis, yet flexible enough to meet the demands of modern trading.

CNN Fear and Greed Index JD modified from minusminusCNN Fear and Greed Index - www.cnn.com
Modified from minusminus -
See Documentation from CNN's website
CNN's Fear and Greed index is an attempt to quantitatively score the Fear and Greed in the SPX using 7 factors:
Market Momentum- S&P 500 (SPX) and its 125-day moving average
Stock Price Strength -Net new 52-week highs and lows on the NYSE
Stock Price Breadth - McClellan Volume Summation Index
Put and Call options - 5-day average put/call ratio
Market Volatility - VIX and its 50-day moving average
Safe Haven Demand - Difference in 20-day stock and bond returns
Junk Bond Demand - Yield spread: junk bonds vs. investment grade
Each Factor has a weight input for the final calculation initially set to a weight of 1. The final calculation of the index is a weighted average of each factor.
3 Factors have separate functions for calculation : See Code for Clarity
SPX Momentum : difference between the Daily CBOE:SPX index value and it's 125 Day Simple moving average.
Stock Price Strength : Net New 52-week highs and lows on the NYSE.
Function calculates a measure of Net New 52-week highs by:
NYSE 52-week highs (INDEX:MAHN) - all new NYSE Highs (INDEX:HIGH)
measure of Net New 52-week lows by:
NYSE 52-week lows (INDEX:MALN) - all new NYSE Lows (INDEX:LOWN)
Then calculate a ratio of Net New 52-week Highs and Lows over Total Highs and Lows then takes a 5-day moving average of that ratio-See Code
Stock Price Breadth is the McClellan Volume Summation Index :
First Calculate the McClellan Oscillator
Second Calculate the Summation Index
4 Factors are Straight data requests
5 Day Simple Moving Average of the Put-Call Ratio on SPY
50 Day Simple Moving Average of the SPX VIX
Difference between 20 Day Simple Moving Average of SPX Daily Close and 20 Day Simple Moving Average of 10Y Constant Maturity US Treasury Note
Yield Spread between ICE BofA US High Yield Index and ICE BofA US Investment Grade Corporate Yield Index
The Fear and Greed Index is a weighted average of these factors - which is then normalized to scale from 0 to 100 using the past 25 values - length parameter.
3 Zones are Shaded: Red for Extreme Fear, Grey for normal jitters, Green for Extreme Greed.
Disclaimer: This is not financial advice. These are just my ideas, and I am not an investment advisor or investment professional. This code is for informational purposes only and do your own analysis before making any investment decisions. This is an attempt to replicate in spirt an index CNN publishes on their website and in no way shape or form infringes on their content, calculations or proprietary information.
From CNN: www.cnn.com
FEAR & GREED INDEX FAQs
What is the CNN Business Fear & Greed Index?
The Fear & Greed Index is a way to gauge stock market movements and whether stocks are fairly priced. The theory is based on the logic that excessive fear tends to drive down share prices, and too much greed tends to have the opposite effect.
How is Fear & Greed Calculated?
The Fear & Greed Index is a compilation of seven different indicators that measure some aspect of stock market behavior. They are market momentum, stock price strength, stock price breadth, put and call options, junk bond demand, market volatility, and safe haven demand. The index tracks how much these individual indicators deviate from their averages compared to how much they normally diverge. The index gives each indicator equal weighting in calculating a score from 0 to 100, with 100 representing maximum greediness and 0 signaling maximum fear.
How often is the Fear & Greed Index calculated?
Every component and the Index are calculated as soon as new data becomes available.
How to use Fear & Greed Index?
The Fear & Greed Index is used to gauge the mood of the market. Many investors are emotional and reactionary, and fear and greed sentiment indicators can alert investors to their own emotions and biases that can influence their decisions. When combined with fundamentals and other analytical tools, the Index can be a helpful way to assess market sentiment.

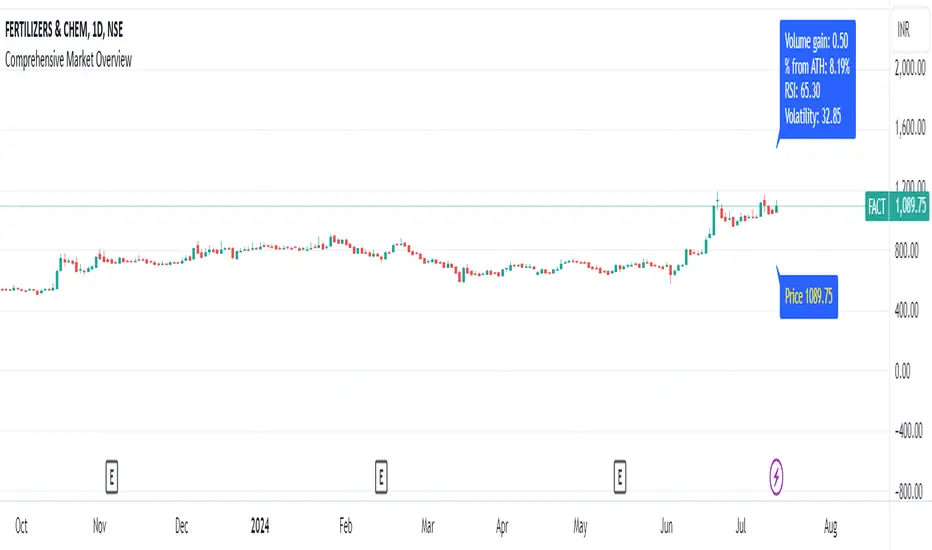
Comprehensive Market Overview1. What is this indicator about?
The "Comprehensive Market Overview" indicator provides a holistic view of the market by incorporating several key metrics:
Close Price: Displays the current close price below each candle.
Percent from All-Time High: Calculates how far the current close price is from the highest high observed over a specified period.
RSI (Relative Strength Index): Measures the momentum of price movements to assess whether a stock is overbought or oversold.
Volume Gain: Computes the current volume relative to its 20-period simple moving average (SMA), indicating volume strength or weakness.
Volatility: Quantifies market volatility by calculating the ratio of the Bollinger Bands' width (difference between upper and lower bands) to the SMA.
2. How it works?
Close Price Label: This label is displayed below each bar, showing the current close price.
Percent from All-Time High: Calculates the percentage difference between the highest high observed (all-time high) and the current close price.
RSI Calculation: Computes the RSI using a 14-period setting, providing insight into whether a stock is potentially overbought or oversold.
Volume Strength: Computes the current volume divided by its 20-period SMA, indicating whether volume is above or below average.
Volatility Calculation: Calculates the width of the Bollinger Bands (based on a 20-period SMA and 2 standard deviations) and expresses it as a percentage of the SMA, providing a measure of market volatility
3.Correct Trend Identification with Indicators
All-Time High (ATH) Levels:
Low Value (Near ATH): When the percent from ATH is low (close to 0%), it indicates that the current price is near the all-time high zone. This suggests strong bullish momentum and potential resistance levels.
High Value (Below ATH): A high percentage from ATH indicates how much the current price is below the all-time high. This could signal potential support levels or opportunities for price recovery towards previous highs.
RSI (Relative Strength Index):
Overbought (High RSI): RSI values above 70 typically indicate that the asset is overbought, suggesting a potential reversal or correction in price.
Oversold (Low RSI): RSI values below 30 indicate oversold conditions, suggesting a potential rebound or price increase.
Swing Trading Strategies
Confirmation with Visual Analysis: Visualizing the chart to confirm ATH levels and RSI readings can provide strong indications of market sentiment and potential trading opportunities:
Bullish Signals: Look for prices near ATH with RSI confirming strength (not yet overbought), indicating potential continuation or breakout.
Bearish Signals: Prices significantly below ATH with RSI showing weakness (not yet oversold), indicating potential for a bounce or reversal.
Volume Confirmation: Comparing current volume to its SMA helps confirm the strength of price movements. Higher current volume relative to the SMA suggests strong price action.
Volatility Assessment: Monitoring volatility through the Bollinger Bands' width ratio helps assess potential price swings. Narrow bands suggest low volatility, while wide bands indicate higher volatility and potential trading opportunities.
4.Entry and Exit Points:
Entry: Consider entering long positions near support levels when prices are below ATH and RSI is oversold. Conversely, enter short positions near resistance levels when prices are near ATH and RSI is overbought.
Exit: Exit long positions near resistance or ATH levels when prices show signs of resistance or RSI becomes overbought. Exit short positions near support levels or when prices rebound from oversold conditions.
Risk Management: Always incorporate risk management techniques such as setting stop-loss orders based on support and resistance levels identified through ATH and RSI analysis.
Implementation Example
Coins Trend Tracker HTThe Coins Trend Tracker HT script provides a powerful tool for monitoring and comparing the trend signals of multiple cryptocurrencies based on their Exponential Moving Averages (EMAs). This script is particularly useful for traders who want to keep track of multiple coins across different timeframes and identify potential trading opportunities based on EMA crossovers.
Features:
Customizable Coin Selection: Users can select up to four different cryptocurrencies to monitor.
Flexible Timeframes: Users can choose two different timeframes for EMA calculations to suit their trading strategies.
Visual Trend Indicators: The script displays trend indicators (🚀 for bullish and 💀 for bearish) based on the EMA crossover status for each coin and timeframe.
Conditional Cell Coloring: Table cells are color-coded based on the EMA crossover conditions, helping users quickly identify bullish or bearish trends.
Opacity Control: Users can adjust the opacity of the table cell colors for better visualization on the chart.
How It Works:
Coin Selection: Users can select up to four different cryptocurrencies to monitor by entering their ticker symbols.
Timeframe Selection: Users can select two different timeframes for the EMA calculations. The script calculates the 5-period and 20-period EMAs for each coin and timeframe.
EMA Crossovers: The script checks for EMA crossovers (EMA 5 crossing above or below EMA 20) and updates the trend indicators and cell colors accordingly.
Table Display: The script displays a table with the selected coins, their current prices, and trend indicators for the chosen timeframes. The background color of the table cells changes based on the EMA crossover status.
Script Logic:
The get_price function retrieves the latest price of the selected coin for the specified timeframe.
The get_ema_cross function calculates the 5-period and 20-period EMAs and checks for crossover conditions.
The fill_row function populates the table with the coin data, trend indicators, and conditionally colored cells.
The table header and data rows are updated based on the user-selected coins, timeframes, and EMA crossover conditions.
Usage:
Add the script to your TradingView chart.
Customize the coin selection, timeframes, text color, default cell color, bullish and bearish cross colors, and cell opacity through the input settings.
The script will display a table with the selected coins, their current prices, and trend indicators based on the EMA crossovers for the chosen timeframes.

Hindsight TrendNon-realtime but highly accurate trend analyzer with only one fundamental parameter ( period aka "minimum trend length")
Basically Hindsight Trend is pivot points on steroids (handles many cases much better). Plus it shows the trend line.
Period
I usually like periods of 10, 20 or 30.
The indicator's delay is identical to the chosen period.
You can actually try a low period like 4 or 5 to get something resembling a realtime indicator.
Uptrends are based on candle lows, downtrends are based on candle highs. So it is possible to have an uptrend and a downtrend at the same time.
Triangles
At trend start, a triangle is drawn. (Trendline isn't always there if the trend didn't last that long.)
Triangle size shows how long the high or low that started the trend remained unbroken. E.g. with period 20: Small triangle = 20+ candles, medium triangle = 40+ candles, big triangle = 80+ candles. So a big triangle marks an important reversal point.
How Hindsight Trend works
Whenever a candle completes, its high and low are saved as potentially "notable" points. A high or low is the more notable the longer it stays unbroken (= not touched again by price).
Now we simply take the notable highs and lows (as in, staying unbroken at least for the user-selected period)... and connect them together - if they are close enough to each other (less than "period" candles away). And decorate the first point in each trend with a triangle.
We only know whether a point is notable after "period" more candles have printed, so that's where the indicator's delay comes from.
Finally we divide the period by 2 and look at highs and lows which are unbroken for that shorter time. While they are not fully "notable" as defined above, we'll call them "semi-notable". Those points are only considered at the end of a trend, and help us extend the trend line a bit further.

Uptrick:Intensity IndexPurpose:
The "Uptrick: Intensity Index" strategy is designed to provide traders with insights into the trend intensity of security by combining multiple moving averages and their relative positions. This versatile tool can be used effectively by both short-term and long-term traders to identify potential buy and sell signals based on specific conditions.
Explanation:
Input Parameters and Customization:
Moving Averages Lengths:
Adjust MA1, MA2, and MA3 lengths to change the calculation periods for the moving averages.
Trend Intensity Index SMA Length:
Adjust the length of the SMA applied to the TII.
Plot Colors:
Change the colors of the TII and TII MA plots for better visualization.
Background Colors and Transparency:
Set different colors for positive and negative TII MA values.
Control the transparency of the background color.
---------------------------------------------------------------------------
MA1 (Length 10): Short-term moving average, useful for capturing short-term market trends.
MA2 (Length 20): Medium-term moving average, providing a balanced view of market trends.
MA3 (Length 50): Long-term moving average, offering insights into long-term market trends.
The script calculates the relative positions of the closing price to each moving average (rel1, rel2, rel3) to determine how far the current price deviates from each average.
Trend Intensity Index (TII):
The TII is calculated as the average of the relative positions (rel1, rel2, rel3), multiplied by 100 to convert it into a percentage. This index reflects the overall intensity of the trend, considering short-term, medium-term, and long-term perspectives.
The TII is plotted in blue, providing a visual representation of trend intensity.
SMA of TII:
An additional SMA is applied to the TII (matii) to smooth out fluctuations and provide a clearer long-term trend signal.
The SMA of TII is plotted in orange, offering a reference for long-term trend analysis.
Determining Potential Price Movements:
For Short-Term Traders:
When the blue TII line crosses above the orange SMA of TII line, it indicates a potential buy signal.
When the blue TII line crosses below the orange SMA of TII line, it indicates a potential sell signal.
For Long-Term Traders:
When the orange SMA of TII line crosses above the highlighted 0 line, it indicates a potential buy signal.
When the orange SMA of TII line crosses below the highlighted 0 line, it indicates a potential sell signal.
Plotting and Visualization:
The TII and its SMA are plotted with distinct colors for easy identification.
A horizontal line at 0 is plotted in gray to serve as a reference point for long-term trend signals.
The background color changes based on the value of the SMA of TII (matii):
Green background for matii values above 0, indicating bullish conditions.
Red background for matii values below 0, indicating bearish conditions.
Utility and Potential Usage:
The "Uptrick: Intensity Index" indicator is a powerful tool for both short-term and long-term traders, offering clear buy and sell signals based on the crossover of the TII and its SMA, as well as the position of the SMA relative to the zero line.
By consolidating multiple moving averages and their relative positions into a single indicator, traders can gain comprehensive insights into market trends and intensity.
The ability to adjust all inputs and toggle visibility options enhances the flexibility and utility of the indicator, making it suitable for various trading styles and market conditions.
Through its versatile design and advanced features, the "Uptrick: Intensity Index" indicator equips traders with actionable insights into trend intensity and potential price movements. By integrating this robust tool into their trading strategies, traders can navigate the markets with greater precision and confidence, thereby enhancing their trading outcomes.
WHAT SETTINGS TO HAVE FOR THE MOVING AVERAGE:
Short-term traders (day traders) might prefer a shorter SMA length (e.g., 5-20 periods) as they are looking for quick signals and react to price changes more rapidly.
Medium-term traders (swing traders) might opt for a medium SMA length (e.g., 20-50 periods) which can filter out some noise and provide a clearer signal on the trend.
Long-term traders (position traders) might choose a longer SMA length (e.g., 50-200 periods) to get a broader view of the market trend and avoid reacting to short-term fluctuations.

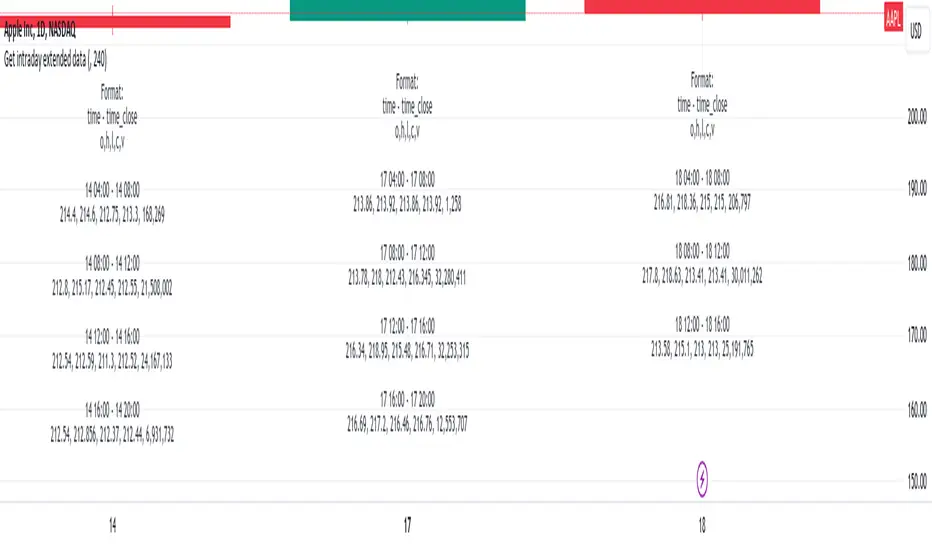
Get intraday extended dataIf you have interacted with Pine for some time, you probably noticed that if you are using DWM resolutions, you will not be able to obtain complete data from the extended intraday ticker using the usual functions request.security() and request.security_lower_tf(). This is quite logical if you understand the principle of mapping data from the secure context to the main one. The main reason is the different opening and closing times of the intraday data with extended clocks and DWM.
This script visualizes one of the approaches to solving this problem. I will briefly describe the principle of operation:
For example, take the symbol NASDAQ:AAPL.
Our main resolution is 1D, but we want to receive extended data from a 4-hour interval. The daytime bar opens at 09:30 and closes at 16:00. The same period at a resolution of 4 hours covers 4 bars:
04:00 - 08:00
08:00 - 12:00
12:00 - 16:00
16:00 - 20:00
So, if we use the request.security_lower_tf() function, we will not get the bars 04:00 - 08:00 and 16:00 - 20:00 because their closing times are not within the range of the main context (09:30 - 16:00).
If we use the request.security() function, we will get the bar 04:00 - 08:00, but we will not get the bar 16:00 - 20:00 because its closing time will be in the future, and it is impossible to get values from the future.
So, what I propose is to use the upgraded request.security() function, inside which another function will be executed, storing all the bars in a var array and putting the post-market bars in the array of the next day. Next, all we have to do is isolate these bars, place them in the previous array, and remove them from the current one.
I visualized the received data simply as text, but you can do it differently using the proposed mechanism.
In order for everything to work, you need to fill in the inputs correctly:
"Symbol for calculate" - This is the symbol from which we will receive extended data.
"Intraday data period" - The period from which we will receive extended data.
"Specify your chart timeframe here" - This is an input that allows you to operate with data from the main context while being inside the secure one. Enter your current chart timeframe here. If there are problems, a warning will appear informing you about this.
If you want to use these developments, take the get_data() function, it will return:
1. the number of past items - it is useful for outputting values in real time, because it is not possible to simply delete them there, because they will always arrive and it is easier to make a slice with an indentation for this number
2. cleared object of type Inner_data containing arrays of open, high, low, close, volume, time, time_close intraday data
3. its same value from the previous bar
Combined IndicatorSummary
This custom Pine Script combines three main indicators into one, each with its own functionalities and visual cues. It provides a comprehensive approach to trend analysis by integrating short-term, medium-term, and long-term indicators. Each part of the indicator can be toggled on or off independently to suit the trader’s needs.
Part 1: EMA 14 and EMA 200
Purpose: This part of the indicator is designed to identify short-term and long-term trends using Exponential Moving Averages (EMA). It helps traders spot potential entry and exit points based on the relationship between short-term and long-term moving averages.
Visuals:
• EMA 14: Plotted in blue (#2962ff)
• EMA 200: Plotted in red (#f23645)
Signals:
• Long Signal: Generated when EMA 14 crosses above EMA 200, indicating a potential upward trend.
• Short Signal: Generated when EMA 14 crosses below EMA 200, indicating a potential downward trend.
Usage: Toggle this part on or off using the checkbox input to focus on short-term vs. long-term trends.
Part 2: EMA 9 and SMA 20
Purpose: This part combines Exponential and Simple Moving Averages to provide a medium-term trend analysis. It helps smooth out price data and identify potential trend reversals and continuation patterns.
Visuals:
• EMA 9: Plotted in green
• SMA 20: Plotted in dark red
Usage: Toggle this part on or off using the checkbox input to focus on medium-term trends and price smoothing.
Part 3: Golden Cross and Death Cross
Purpose: This part identifies long-term bullish and bearish market conditions using the 50-day and 200-day Simple Moving Averages (SMA). It highlights major trend changes that can inform long-term investment decisions.
Visuals:
• 50-day SMA: Plotted in gold (#ffe600)
• 200-day SMA: Plotted in black
Signals:
• Golden Cross: Generated when the 50-day SMA crosses above the 200-day SMA, indicating a potential long-term upward trend.
• Death Cross: Generated when the 50-day SMA crosses below the 200-day SMA, indicating a potential long-term downward trend.
Usage: Toggle this part on or off using the checkbox input to focus on long-term trend changes.
How to Use
1. Enable/Disable Indicators: Use the checkboxes provided in the input settings to enable or disable each part of the indicator according to your analysis needs.
2. Interpret Signals: Look for crossover events to determine potential entry and exit points based on the relationship between the moving averages.
3. Visual Confirmation: Use the color-coded lines and shape markers on the chart to visually confirm signals and trends.
4. Customize Settings: Adjust the lengths of the EMAs and SMAs in the input settings to suit your trading strategy and the specific asset you are analyzing.
Practical Application
• Short-Term Trading: Use the EMA 14 and EMA 200 signals to identify quick trend changes.
• Medium-Term Trading: Use the EMA 9 and SMA 20 to capture medium-term trends and reversals.
• Long-Term Investing: Monitor the Golden Cross and Death Cross signals to make decisions based on long-term trend changes.
Example of Unique Features
• Integrated Toggle System: Allows users to enable or disable specific parts of the indicator to customize their analysis.
• Multi-Tier Trend Analysis: Combines short-term, medium-term, and long-term indicators to provide a comprehensive view of the market.

ICT IPDA Liquidity Matrix By AlgoCadosThe ICT IPDA Liquidity Matrix by AlgoCados is a sophisticated trading tool that integrates the principles of the Interbank Price Delivery Algorithm (IPDA), as taught by The Inner Circle Trader (ICT). This indicator is meticulously designed to support traders in identifying key institutional levels and liquidity zones, enhancing their trading strategies with data-driven insights. Suitable for both day traders and swing traders, the tool is optimized for high-frequency and positional trading, providing a robust framework for analyzing market dynamics across multiple time horizons.
# Key Features
Multi-Time Frame Analysis
High Time Frame (HTF) Levels : The indicator tracks critical trading levels over multiple days, specifically at 20, 40, and 60-day intervals. This functionality is essential for identifying long-term trends and significant support and resistance levels that aid in strategic decision-making for swing traders and positional traders.
Low Time Frame (LTF) Levels : It monitors price movements within 20, 40, and 60-hour intervals on lower time frames. This granularity provides a detailed view of intraday price actions, which is crucial for scalping and short-term trading strategies favored by day traders.
Daily Open Integration : The indicator includes the daily opening price, providing a crucial reference point that reflects the market's initial sentiment. This feature helps traders assess the market's direction and volatility, enabling them to make informed decisions based on the day's early movements, which is particularly useful for day trading strategies.
IPDA Reference Points : By leveraging IPDA's 20, 40, and 60-period lookbacks, the tool identifies Key Highs and Lows, which are used by IPDA as Draw On Liquidity. IPDA is an electronic and algorithmic system engineered for achieving price delivery efficiency, as taught by ICT. These reference points serve as benchmarks for understanding institutional trading behavior, allowing traders to align their strategies with the dominant market forces and recognize institutional key levels.
Dynamic Updates and Overlap Management : The indicator is updated daily at the beginning of a new daily candle with the latest market data, ensuring that traders operate with the most current information. It also features intelligent overlap management that prioritizes the most relevant levels based on the timeframe hierarchy, reducing visual clutter and enhancing chart readability.
Comprehensive Customization Options : Traders can tailor the indicator to their specific needs through an extensive input menu. This includes toggles for visibility, line styles, color selections, and label display preferences. These customization options ensure that the tool can adapt to various trading styles and preferences, enhancing user experience and analytical capabilities.
User-Friendly Interface : The tool is designed with a user-friendly interface that includes clear, concise labels for all significant levels. It supports various font families and sizes, making it easier to interpret and act upon the displayed data, ensuring that traders can focus on making informed trading decisions without being overwhelmed by unnecessary information.
# Usage Note
The indicator is segmented into two key functionalities:
LTF Displays : The Low Time Frame (LTF) settings are exclusive to timeframes up to 1 hour, providing detailed analysis for intraday traders. This is crucial for traders who need precise and timely data to make quick decisions within the trading day.
HTF Displays : The High Time Frame (HTF) settings apply to the daily timeframe and any shorter intervals, allowing for comprehensive analysis over extended periods. This is beneficial for swing traders looking to identify broader trends and market directions.
# Inputs and Configurations
BINANCE:BTCUSDT
Offset: Adjustable setting to shift displayed data horizontally for better visibility, allowing traders to view past levels and make informed decisions based on historical data.
Label Styles: Choose between compact or verbose label formats for different levels, offering flexibility in how much detail is displayed on the chart.
Daily Open Line: Customizable line style and color for the daily opening price, providing a clear visual reference for the start of the trading day.
HTF Levels: Configurable high and low lines for HTF with options for style and color customization, allowing traders to highlight significant levels in a way that suits their trading style.
LTF Levels: Similar customization options for LTF levels, ensuring flexibility in how data is presented, making it easier for traders to focus on the most relevant intraday levels.
Text Utils: Settings for font family, size, and text color, allowing for personalized display preferences and ensuring that the chart is both informative and aesthetically pleasing.
# Advanced Features
Overlap Management : The script intelligently handles overlapping levels, particularly where multiple timeframes intersect, by prioritizing the more significant levels and removing redundant ones. This ensures that the charts remain clear and focused on the most critical data points, allowing traders to concentrate on the most relevant market information.
Real-Time Updates : The indicator updates its calculations at the start of each new daily bar, incorporating the latest market data to provide timely and accurate trading signals. This real-time updating is crucial for traders who rely on up-to-date information to execute their strategies effectively and make informed trading decisions.
# Example Use Cases
Scalpers/Day traders: Can utilize the LTF features to make rapid decisions based on hourly market movements, identifying short-term trading opportunities with precision.
Swing Traders: Will benefit from the HTF analysis to identify broader trends and key levels that influence longer-term market movements, enabling them to capture significant market swings.
By providing a clear, detailed view of key market dynamics, the ICT IPDA Liquidity Matrix by AlgoCados empowers traders to make more informed and effective trading decisions, aligning with institutional trading methodologies and enhancing their market understanding.
# Usage Disclaimer
This tool is designed to assist in trading decisions, but it should be used in conjunction with other analysis methods and risk management strategies. Trading involves significant risk, and it is essential to understand the market conditions thoroughly before making trading decisions.

VIX Percentile Rank HistogramVIX Percentile Rank Histogram
The VIX Percentile Rank Histogram provides a visual representation of the CBOE Volatility Index (VIX) percentile rank over a customizable lookback period, helping traders gauge market sentiment and make informed trading decisions.
Overview:
This indicator calculates the percentile rank of the VIX over a specified lookback period and displays it as a histogram. The histogram helps traders understand whether the current VIX level is relatively high or low compared to its recent history. This information is particularly useful for timing entries and exits in the S&P 500 or related ETFs and Mega Caps.
How It Works:
VIX Data Integration: The script fetches daily VIX close prices, regardless of the chart you are viewing, to analyze market volatility.
Percentile Rank Calculation: The indicator calculates the rank percentile of the VIX over the chosen lookback period.
Histogram Visualization: The histogram plots the difference between the flipped VIX percentile rank and 50, showing green bars for ranks below 50 (indicating lower market volatility) and red bars for ranks above 50 (indicating higher market volatility).
Usage:
This indicator is most effective when trading the S&P 500 (SPX, SPY, ES1!) or ETFs and Mega Caps that closely follow the S&P 500. It provides insight into market sentiment, helping traders make more informed decisions.
Timing Entries and Exits: Green histogram readings suggest it's a good time to enter or hold long positions, while red readings suggest considering exits or short positions.
Market Sentiment: A high VIX percentile rank (red bars) indicates market fear and uncertainty, while a low percentile rank (green bars) suggests investor confidence and reduced volatility.
Key Features:
Customizable Lookback Period: The default lookback period is set to 20 days, but can be adjusted based on the trader's average trade duration. For example, if your trades typically last 20 days, a 20-day lookback period helps contextualize the VIX level relative to its recent history.
Histogram Visualization: The histogram provides a clear visual representation of market volatility.
Green Bars: Indicate a lower-than-median VIX percentile rank, suggesting reduced market volatility.
Red Bars: Indicate a higher-than-median VIX percentile rank, suggesting increased market volatility.
Threshold Line: A dashed gray line at the 0 level serves as a visual reference for the median VIX rank.
Important Note:
This indicator always shows readings from the VIX, regardless of the chart you are viewing. For example, if you are looking at Natural Gas futures, this indicator will provide no relevant data. It works best when trading the S&P 500 or related ETFs and Mega Caps.

Intellect_city - Halvings Bitcoin CycleWhat is halving?
The halving timer shows when the next Bitcoin halving will occur, as well as the dates of past halvings. This event occurs every 210,000 blocks, which is approximately every 4 years. Halving reduces the emission reward by half. The original Bitcoin reward was 50 BTC per block found.
Why is halving necessary?
Halving allows you to maintain an algorithmically specified emission level. Anyone can verify that no more than 21 million bitcoins can be issued using this algorithm. Moreover, everyone can see how much was issued earlier, at what speed the emission is happening now, and how many bitcoins remain to be mined in the future. Even a sharp increase or decrease in mining capacity will not significantly affect this process. In this case, during the next difficulty recalculation, which occurs every 2014 blocks, the mining difficulty will be recalculated so that blocks are still found approximately once every ten minutes.
How does halving work in Bitcoin blocks?
The miner who collects the block adds a so-called coinbase transaction. This transaction has no entry, only exit with the receipt of emission coins to your address. If the miner's block wins, then the entire network will consider these coins to have been obtained through legitimate means. The maximum reward size is determined by the algorithm; the miner can specify the maximum reward size for the current period or less. If he puts the reward higher than possible, the network will reject such a block and the miner will not receive anything. After each halving, miners have to halve the reward they assign to themselves, otherwise their blocks will be rejected and will not make it to the main branch of the blockchain.
The impact of halving on the price of Bitcoin
It is believed that with constant demand, a halving of supply should double the value of the asset. In practice, the market knows when the halving will occur and prepares for this event in advance. Typically, the Bitcoin rate begins to rise about six months before the halving, and during the halving itself it does not change much. On average for past periods, the upper peak of the rate can be observed more than a year after the halving. It is almost impossible to predict future periods because, in addition to the reduction in emissions, many other factors influence the exchange rate. For example, major hacks or bankruptcies of crypto companies, the situation on the stock market, manipulation of “whales,” or changes in legislative regulation.
---------------------------------------------
Table - Past and future Bitcoin halvings:
---------------------------------------------
Date: Number of blocks: Award:
0 - 03-01-2009 - 0 block - 50 BTC
1 - 28-11-2012 - 210000 block - 25 BTC
2 - 09-07-2016 - 420000 block - 12.5 BTC
3 - 11-05-2020 - 630000 block - 6.25 BTC
4 - 20-04-2024 - 840000 block - 3.125 BTC
5 - 24-03-2028 - 1050000 block - 1.5625 BTC
6 - 26-02-2032 - 1260000 block - 0.78125 BTC
7 - 30-01-2036 - 1470000 block - 0.390625 BTC
8 - 03-01-2040 - 1680000 block - 0.1953125 BTC
9 - 07-12-2043 - 1890000 block - 0.09765625 BTC
10 - 10-11-2047 - 2100000 block - 0.04882813 BTC
11 - 14-10-2051 - 2310000 block - 0.02441406 BTC
12 - 17-09-2055 - 2520000 block - 0.01220703 BTC
13 - 21-08-2059 - 2730000 block - 0.00610352 BTC
14 - 25-07-2063 - 2940000 block - 0.00305176 BTC
15 - 28-06-2067 - 3150000 block - 0.00152588 BTC
16 - 01-06-2071 - 3360000 block - 0.00076294 BTC
17 - 05-05-2075 - 3570000 block - 0.00038147 BTC
18 - 08-04-2079 - 3780000 block - 0.00019073 BTC
19 - 12-03-2083 - 3990000 block - 0.00009537 BTC
20 - 13-02-2087 - 4200000 block - 0.00004768 BTC
21 - 17-01-2091 - 4410000 block - 0.00002384 BTC
22 - 21-12-2094 - 4620000 block - 0.00001192 BTC
23 - 24-11-2098 - 4830000 block - 0.00000596 BTC
24 - 29-10-2102 - 5040000 block - 0.00000298 BTC
25 - 02-10-2106 - 5250000 block - 0.00000149 BTC
26 - 05-09-2110 - 5460000 block - 0.00000075 BTC
27 - 09-08-2114 - 5670000 block - 0.00000037 BTC
28 - 13-07-2118 - 5880000 block - 0.00000019 BTC
29 - 16-06-2122 - 6090000 block - 0.00000009 BTC
30 - 20-05-2126 - 6300000 block - 0.00000005 BTC
31 - 23-04-2130 - 6510000 block - 0.00000002 BTC
32 - 27-03-2134 - 6720000 block - 0.00000001 BTC

IV Rank Oscillator by dinvestorqShort Title: IVR OscSlg
Description:
The IV Rank Oscillator is a custom indicator designed to measure and visualize the Implied Volatility (IV) Rank using Historical Volatility (HV) as a proxy. This indicator helps traders determine whether the current volatility level is relatively high or low compared to its historical levels over a specified period.
Key Features :
Historical Volatility (HV) Calculation: Computes the historical volatility based on the standard deviation of logarithmic returns over a user-defined period.
IV Rank Calculation: Normalizes the current HV within the range of the highest and lowest HV values over the past 252 periods (approximately one year) to generate the IV Rank.
IV Rank Visualization: Plots the IV Rank, along with reference lines at 50 (midline), 80 (overbought), and 20 (oversold), making it easy to interpret the relative volatility levels.
Historical Volatility Plot: Optionally plots the Historical Volatility for additional reference.
Usage:
IV Rank : Use the IV Rank to assess the relative level of volatility. High IV Rank values (close to 100) indicate that the current volatility is high relative to its historical range, while low IV Rank values (close to 0) indicate low relative volatility.
Reference Lines: The overbought (80) and oversold (20) lines help identify extreme volatility conditions, aiding in trading decisions.
Example Use Case:
A trader can use the IV Rank Oscillator to identify potential entry and exit points based on the volatility conditions. For instance, a high IV Rank may suggest a period of high market uncertainty, which could be a signal for options traders to consider strategies like selling premium. Conversely, a low IV Rank might indicate a more stable market condition.
Parameters:
HV Calculation Length: Adjustable period length for the historical volatility calculation (default: 20 periods).
This indicator is a powerful tool for options traders, volatility analysts, and any market participant looking to gauge market conditions based on historical volatility patterns.
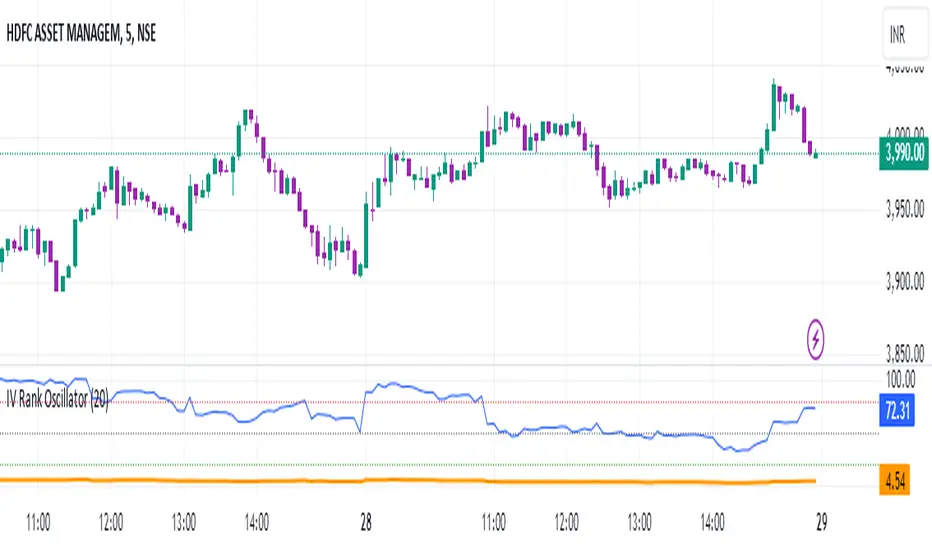
Triple EMA + QQE Trend Following Strategy [TradeDots]The "Triple EMA + QQE Trend Following Strategy" harnesses the power of two sophisticated technical indicators, the Triple Exponential Moving Average (TEMA) and the Qualitative Quantitative Estimation (QQE), to generate precise buy and sell signals. This strategy excels in capturing shifts in trends by identifying short-term price momentum and dynamic overbought or oversold conditions.
HOW IT WORKS
This strategy integrates two pivotal indicators:
Triple Exponential Moving Average (TEMA): TEMA enhances traditional moving averages by reducing lag and smoothing the data more effectively. It achieves this by applying the EMA formula three times onto the price, as follows:
tema(src, length) =>
ema1 = ta.ema(src, length)
ema2 = ta.ema(ema1, length)
ema3 = ta.ema(ema2, length)
tema = 3*ema1 - 3*ema2 + ema3
This computation helps to sharpen the sensitivity to price movements.
Qualitative Quantitative Estimation (QQE): The QQE indicator improves upon the standard RSI by incorporating a smoothing mechanism. It starts with the standard RSI, overlays a 5-period EMA on this RSI, and then enhances the result using a double application of a 27-period EMA. A slow trailing line is then derived by multiplying the result with a factor number. This approach establishes a more refined and less jittery trend-following signal, complementing the TEMA to enhance overall market timing during fluctuating conditions.
APPLICATION
Referenced from insights on "Trading Tact," the strategy implementation follows:
First of all, we utilize two TEMA lines: one set at a 20-period and the other at a 40-period. Then following the rules below:
40-period TEMA is rising
20-period TEMA is above 40-period TEMA
Price closes above 20-period TEMA
Today is not Monday
RSI MA crosses the Slow trailing line
This strategy does not employ an active take profit mechanism; instead, it utilizes a trailing stop loss to allow the price to reach the stop loss naturally, thereby maximizing potential profit margins.
DEFAULT SETUP
Commission: 0.01%
Initial Capital: $10,000
Equity per Trade: 80%
Users are advised to adjust and personalize this trading strategy to better match their individual trading preferences and style.
RISK DISCLAIMER
Trading entails substantial risk, and most day traders incur losses. All content, tools, scripts, articles, and education provided by TradeDots serve purely informational and educational purposes. Past performances are not definitive predictors of future results.
Reference:
Trading Tact. What Is the QQE Indicator? Retrieved from: tradingtact.com

Consolidation Score ScreenerIn trading, a consolidation range is like a timeout after a big move in the price of a stock or symbol.
It's when the market takes a breather, neither pushing the price up nor down too hard.
Visually, it looks like the price moving sideways on a chart , with highs and lows staying within a certain range.
so this indicator is created to help myself and you decide if its a ranging market and what's the score of that consolidation range
The score ranges between 0 and 10 , where 10 is the max consolidation score , meaning this stock or the symbol is at its highest peak of consolidation .
What would you see using this indicator ?
Symbols circles , inside these circles it will print the consolidation score ..
in the middle of the indicator it will show the range of all the 20 symbols scores .
so it will give you like overall ranging value for your 20 symbols
Settings :
TimeFrame : TimeFrame input to select which time frame you want your indicator to analysis
Range length : The Range that you would want your indicator to take into consideration when doing its analysis .
Features :
20 symbols analysis
Multi timeframe capability
Enjoy .

Hybrid Overbought/Oversold OverlayIntroduction
This is a new representation of my well-known oscillator Hybrid Overbought/Oversold Detector overlaid on the chart. The script utilizes the following 12 different oscillators to bring forth a new indicator which I call it Hybrid OB/OS .
Utilized Oscillators
The utilized oscillators here are:
Bollinger Bands %B
Chaikin Money Flow (CMF)
Chande Momentum Oscillator (CMO)
Commodity Channel Index (CCI)
Disparity Index (DIX)
Keltner Channel %K
Money Flow Index (MFI)
Rate Of Change (ROC)
Relative Strength Index (RSI)
Relative Vigor Index (RVI/RVGI)
Stochastic
Twiggs Money Flow (TMF)
The challenging part of utilizing mentioned oscillators was that some of their formulas range are not similar and some of them does not have a mathematical range at all. So I used a normalization function to normalize all their output values to (0, 100) interval.
Overbought/Oversold Levels Calculation
I noticed that the levels which considered as OB/OS level by various traders for each of the utilized oscillators are so different, e.g., many traders consider 30 as OS level and 70 as OB level for RSI and some others take 20 and 80 as the levels, or some traders consider 20 and 80 as OS/OB levels for Stochastic oscillator. Also these levels could be different on different assets, e.g., OB/OS levels for CCI on EURUSD chart might be 80 and 20 while the levels on BTCUSDT chart might be 75 and 25, and so on.
So I decided to make a routine to automate the calculation of these levels using historical data. By this feature, my indicator would calculate the corresponding levels for the oscillators on current chart and then decide about the overbought/oversold situation of each one, which leads to a more accurate Hybrid OB/OS indication.
As the result, if all 12 individual oscillators say it's overbought/oversold, the Hybrid OB/OS shows 100% overbought/oversold, vice versa, if none of them say it's overbought/oversold, the Hybrid OB/OS shows 0, and so on.
The Overlaying Oscillator Problem!
A programming-related challenge here was that Pine Script assigns two separate spaces to the oscillators and the overlaid indicators, and the programmers are limited to use just one of them in each of their codes.
Knowing this, I was forced to simulate the oscillator space on the chart and display my oscillator as a diagram somehow. Of course it won't be as nice as the oscillator itself, because the relation between the main chart bars and the oscillator bars could not be obtained, but it's better than nothing!
Settings and Usage
The indicator settings contain some options about the calculations, the diagram display and the signals appearance. By default they are fine, but you could change them as you prefer.
This indicator is better to be used alongside other indicators as a confirmation (specially in counter-trend strategies I believe). Also it generates an external signal which you could use it in your own designed indicators as well.
Feel free to test it and also the former form of the Hybrid OB/OS . Good Luck!
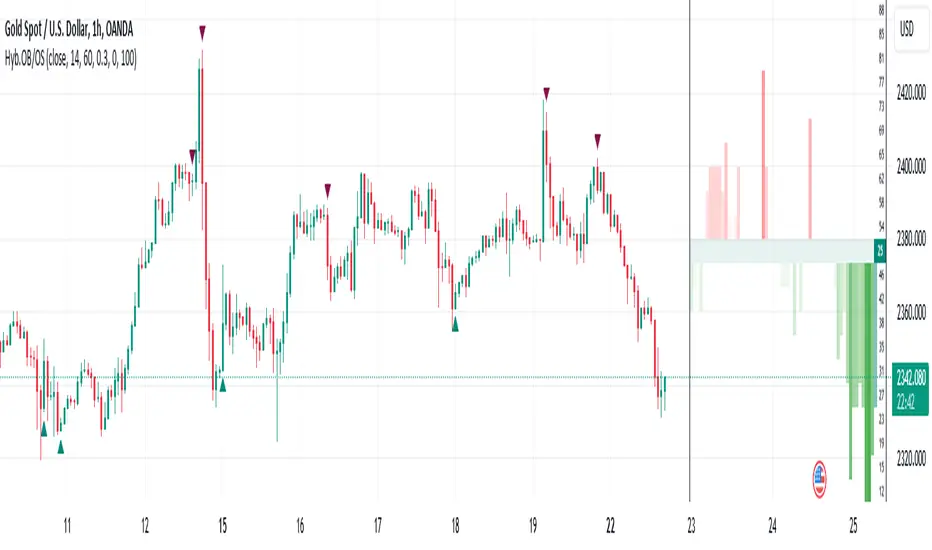
MTF BB+KC Avg
Bollinger Bands (BB) are a widely used technical analysis created by John Bollinger in the early 1980’s. Bollinger Bands consist of a band of three lines which are plotted in relation to instrument prices. The line in the middle is usually a Simple Moving Average (SMA) set to a period of 20 days (The type of trend line and period can be changed by the trader; however a 20 day moving average is by far the most popular). This indicator does not plot the middle line. The Upper and Lower Bands are used as a way to measure volatility by observing the relationship between the Bands and price. Typically the Upper and Lower Bands are set to two standard deviations away from the middle line, however the number of standard deviations can also be adjusted in the indicator.
Keltner Channels (KC) are banded lines similar to Bollinger Bands and Moving Average Envelopes. They consist of an Upper Envelope above a Middle Line (not plotted in this indicator) as well as a Lower Envelope below the Middle Line. The Middle Line is a moving average of price over a user-defined time period. Either a simple moving average or an exponential moving average are typically used. The Upper and Lower Envelopes are set a (user-defined multiple) of a range away from the Middle Line. This can be a multiple of the daily high/low range, or more commonly a multiple of the Average True Range.
This indicator is built on AVERAGING the BB and KC values for each bar, so you have an efficient metric of AVERAGE volatility. The indicator visualizes changes in volatility which is of course dynamic.
What to look for
High/Low Prices
One thing that must be understood about this indicator's plots is that it averages by adding BB levels to KC levels and dividing by 2. So the plots provide a relative definition of high and low from two very popular indicators. Prices are almost always within the upper and lower bands. Therefore, when prices move up near the upper or lower bands or even break through the band, many traders would see that price action as OVER-EXTENDED (either overbought or oversold, as applicable). This would preset a possible selling or buying opportunity.
Cycling Between Expansion and Contraction
Volatility can generally be seen as a cycle. Typically periods of time with low volatility and steady or sideways prices (known as contraction) are followed by period of expansion. Expansion is a period of time characterized by high volatility and moving prices. Periods of expansion are then generally followed by periods of contraction. It is a cycle in which traders can be better prepared to navigate by using Bollinger Bands because of the indicators ability to monitor ever changing volatility.
Walking the Bands
Of course, just like with any indicator, there are exceptions to every rule and plenty of examples where what is expected to happen, does not happen. Previously, it was mentioned that price breaking above the Upper Band or breaking below the Lower band could signify a selling or buying opportunity respectively. However this is not always the case. “Walking the Bands” can occur in either a strong uptrend or a strong downtrend.
During a strong uptrend, there may be repeated instances of price touching or breaking through the Upper Band. Each time that this occurs, it is not a sell signal, it is a result of the overall strength of the move. Likewise during a strong downtrend there may be repeated instances of price touching or breaking through the Lower Band. Each time that this occurs, it is not a buy signal, it is a result of the overall strength of the move.
Keep in mind that instances of “Walking the Bands” will only occur in strong, defined uptrends or downtrends.
Inputs
TimeFrame
You can select any timeframe froom 1 minute to 12 months for the bar measured.
Length of the internal moving averages
You can select the period of time to be used in calculating the moving averages which create the base for the Upper and Lower Bands. 20 days is the default.
Basis MA Type
Determines the type of Moving Average that is applied to the basis plot line. Default is SMA and you can select EMA.
Source
Determines what data from each bar will be used in calculations. Close is the default.
StdDev/Multiplier
The number of Standard Deviations (for BB) or Multiplier (for KC) away from the moving averages that the Upper and Lower Bands should be. 2 is the default value for each indicator.

arpit bollinger bandStrategy Overview:
This strategy utilizes Bollinger Bands based on a 20-period Exponential Moving Average (EMA) with a standard deviation multiplier of 1.5. It is designed to generate early trading signals based on the relationship between the price action and the Bollinger Bands.
Bollinger Bands Calculation:
The upper Bollinger Band is calculated as the 20-period EMA of the closing prices plus 1.5 times the standard deviation of the same period.
The lower Bollinger Band is calculated as the 20-period EMA of the closing prices minus 1.5 times the standard deviation.
Entry Criteria:
Buy Signal: A buy signal is generated when the current candle's high exceeds the high of the candle two periods ago, which had closed below the lower Bollinger Band. This condition implies an anticipation of a bullish reversal.
Sell Signal: A sell signal is generated when the current candle's low falls below the low of the candle two periods ago, which had closed above the upper Bollinger Band. This condition suggests an anticipated bearish reversal.
Stop Loss and Take Profit:
The stop loss for a buy order is set slightly below the low of the current candle, and for a sell order, it is set slightly above the high of the current candle.
The take profit level is determined based on a predefined risk-reward ratio of 1:3. This means the take profit target is set at a distance three times greater than the distance between the entry price and the stop loss.
Risk Management:
The strategy includes an input option to adjust the risk-reward ratio, allowing for flexibility in managing the trade's potential risk versus reward.
Trade Execution:
The strategy automatically plots the buy and sell signals on the chart and executes the trades according to the defined conditions. It also visually indicates the stop loss levels for each trade.
Usage Notes:
This strategy is designed for use in the TradingView platform using Pine Script version 5.
It is important to backtest and paper trade the strategy before using it in live trading to understand its performance characteristics and risk profile.
The strategy should be used as part of a comprehensive trading plan, considering market conditions, trader risk tolerance, and personal trading goals.
