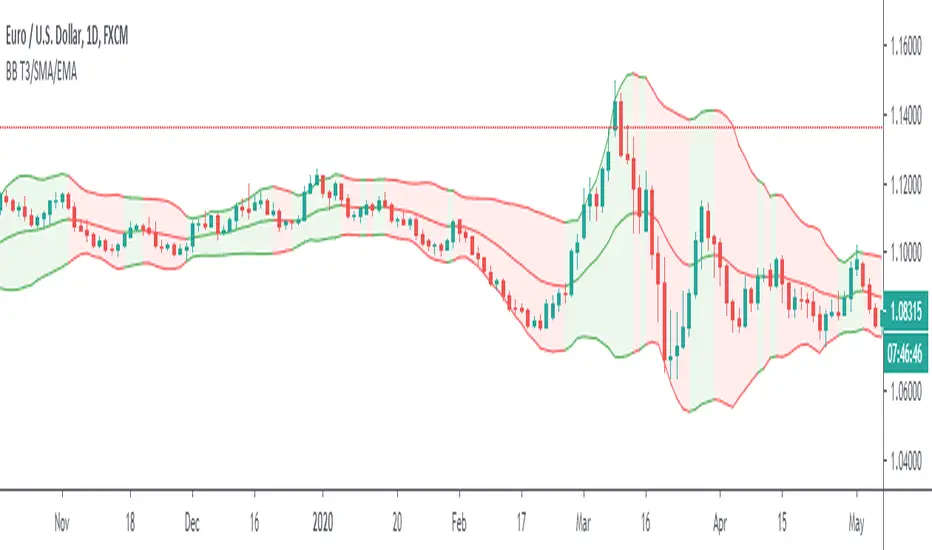
Bollinger Bands T3/SMA/EMAThis is Bollinger Bands script with an option to choose three different moving averages. The simple moving average is the original settings used by Mr Bollinger. Exponential is a popular choice as it adds more value to the recent price movements. T3 is a lot faster at adapting to the recent price. Compared to exponential, it gives even more value to the recent prices and furthermore, it is smoother. I use it to polish my True Range scripts.
Another upgrade is the ability to have a different colour of the channel when the baseline moves up or down.
Back to calculation? Is it better to use T3 with Bollinger? My opinion is that it depends on the trader. Both of them give you slightly different information and it is essential to look at the historical behaviour and answer for yourself. Will I use T3 calculation? Well, I built this script to find out if I want to.
Have a great trade!
Sma
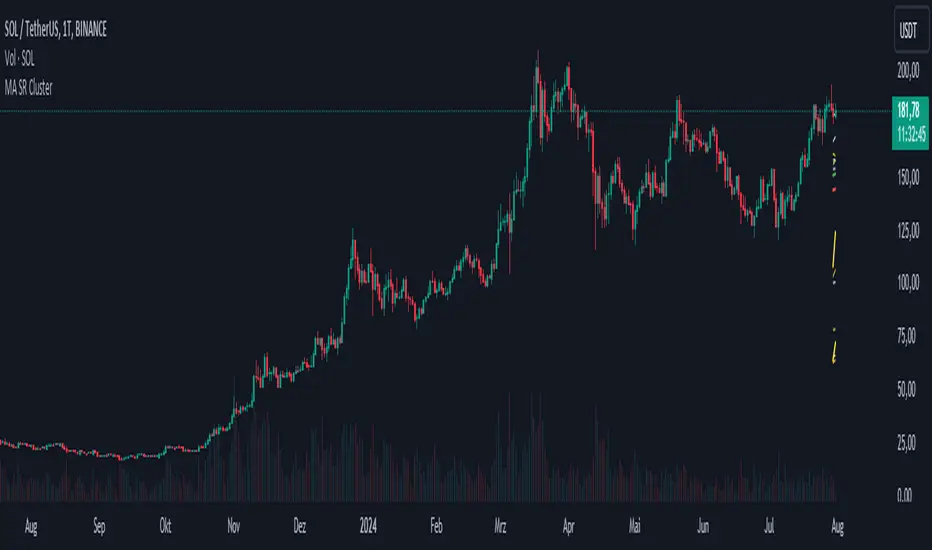
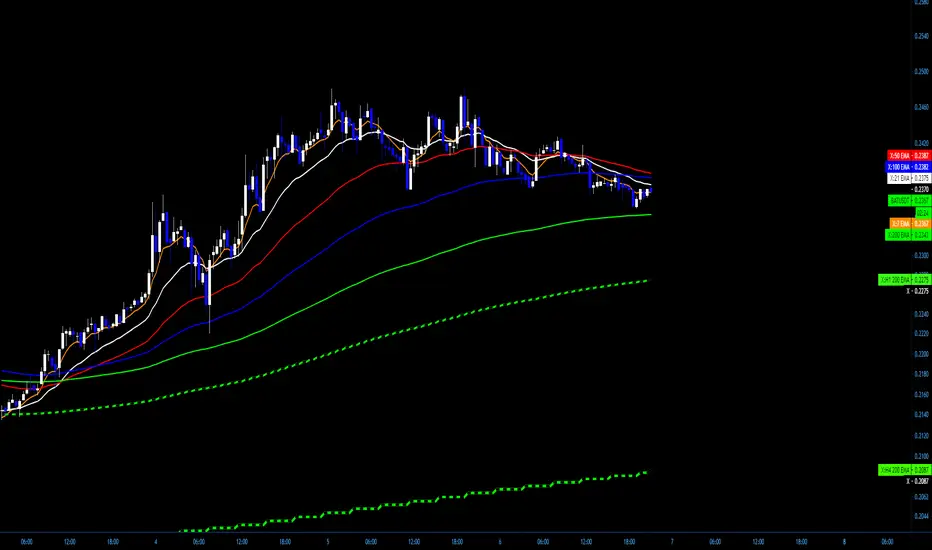
SMA/EMA SR mtf Clusters v0.9SMA and EMA endings to identify support and resistance with a good chart overview.
Unfortunately the scaling of TradingView in intraday charts is not good.

SMA custom range Candle patterns (Mercenario)Custom SMA with custom range in pips
It recognises candle patterns
hammer
engulfing
three black crows and white soldiers
and HE
hammer entry, for strategy, hammer with candle confirming trend

MA * Fibo levels (canal)Some updates to the scrypt "MA * Fibo levels (auto)"
In the previous scrypt we drew lines using either highs or lows of the candles due to the positiveness or negativeness of given percentages.
But, after some research it seems easier to use CANALS to buy or sell rather than LINES. So these canals are the intervals between SMA(highs) and SMA(lows) multiplied by FIBO coefficients. However, lines can be also used as stop-losses if the price goes out of the canal, and wait until the price reaches the other canal.
Good luck in trading!
If the scrypt was useful let me know!
Any feedbacks and ideas are welcomed!

Hello VWAP "Beta"This is my 1st indicator, and my attention is to plot the VWAP "Volume-weighted average price" using the SMA "Simple Moving Average" over time... IE over the last 50,100,200 bars and just the VWAP... All of them in just one line... I have made it when I have been using the BTC/US chart, but it should work for stocks/forex or any other chart that you want to use...
I am not completely sure about this indicator and I do want to add more to this, that is how come I am posting to the community to show what I have done and people can use it and if they are open to it give me feedback or tips to make it better...
Happy trading...

MA-KIRILDIM-SANAThis is a lower block indicator. It helps us to follow the moving average crosses in the lower section in a single indicator without adding any moving averages in the main window.
When MA1 breaks MA2 up, the background color turns green or otherwise, the background becomes red. If you want, you can follow the lines of moving averages in here.
Three averages can be used in the system.
- SMA(Simple Moving Average)
- EMA(Exponential Moving Average)
- WMA(Weighted Moving Average)
Thanks

X+ - SMA/EMA Suite with MTF
I often use a mix of EMAs and SMAs in my analysis and turning them on and off and adding and removing them from the chart becomes a bit of a burden.
In this script you'll find the most common EMAs and SMAs that I use on just about every chart I look at.
If the feature ever becomes available to save settings as templates from within the script, then I will do that but for now there are two work-arounds.
www.dropbox.com
Work-Around 1: Create the suite that you want recalled by selecting what Moving Averages you want and then SAVE AS AN INDICATOR TEMPLATE. This has a fairly quick recall and you'll be able to access one that says "all EMA's" or "all SMAs" or "SMA/EMA for H4 Chart with MTF". Whatever you want.
That may work for some traders but others don't want the fuss of having their other indicators in the way or being added or removed from their templates, etc.
Work-Around 2: Add two instances or even three, whatever. I personally use two because the select on and select off can be a hassle when dealing with so many options.
I essentially use one that I have selected when I am looking at Daily or Higher Charts and then I hide that one an unhide the other one that is already setup for lower timeframe charts, from the M1 to the H4.
This allows me to run two full suites. I was looking for a way to save settings like we can with the Fibonacci tool but I simply could not find a solution. So, this will have to do.
The MTF - Multi-Time-Frame
I have it coded to display the 20 SMA from the M30, H1 and H4 Charts - no matter what timeframe you are currently viewing.
I also have the 200 EMA from the same charts (M30, H1, H4)
The Settings can be changed but the readout on the scales will stay 20 and 200.
www.dropbox.com
You can change the SMA and the EMA to whatever you want as well as the Source, an offset if desired and the timeframe from which it will display from.
Above is a screenshot of an H4 Chart with only the MTFs. So you will see the 20 SMA from the M30 as well as the H1 and H4. They have a checkered style to them that can be customized in the settings. Those are White and Black.
The Green and Black are the 200 EMAs from the M30 and the H1 and H4.
www.dropbox.com
If you want to be able to see the Label on the scale, you can head to Settings/Scales and Tick on "Indicator Name Label"
www.dropbox.com
www.dropbox.com
I have a pretty specific color format that I follow but I do a lot of teaching. For me, it's far easier to have the readout of what line is what right on the chart:
7 EMA is the 7 EMA and not just "EMA" or something even longer that takes up a good portion of your screen when you turn on the indicator name label option.
Anyway, I hope somebody finds a use for this and if so, Awesome.
Above are just some ideas of how I use it.
CBG Swing HighLow MAThis indicator will show the swing high and lows for the number of bars back. It's very easy to use and shows good support and resistance levels.
I then took it a step further and added a moving average with all the standard types in my indicators:
SMA
EMA
Weighted
Hull
Symmetrical
Volume Weighted
Wilder
Linear Regression
I then added Bollinger Bands to show the standard deviation from the midline.
Finally, I added a simple bar coloring scheme: green if above the upper BB, Red if below and orange if in the middle.
I am just testing this out so please use with caution. If anyone in the community wants to run some backtests, that would be great and we would all appreciate it.
Of course you can keep it all simple and turn off all the moving averages and bollinger bands.
Enjoy! :-)

EMA,SMA,VWAPSMA EMA and VWAP all in one for you free accounters out there! The ultimate chart inspired by RizeSenpai created by Bitcorns-trader aka FACE aka ( ͡° ͜ʖ ͡°)

SMMA 5-13 crossCrossing the Smoothed Moving Averages with settings 5 & 13 give you confident signal for selling or buying.
IMPORTANT: Signal is always late.
SELL : Short SMMA (5) cross the Long SMMA (13) from top
BUY : Short SMMA (5) cross the Long SMMA (13) from down

TS - Trend Moving AveragesOverview
Simple trend indentification indicator based on a mix of SMA & WMA components.
Default settings built for the 1D chart with an optional 3rd fast MA that can be toggled.
Can be used alongside more advanced Tradespot indicators
Access
PM me, our indicators come as a wider package.

ALMA Function [FN] - Arnaud Legoux Moving AverageThis hasn't been done before. People know the ALMA moving average, TradingView, of course, has a built-in function for the ALMA = alma(). But, when you use built-in functions, you can't have a series as a length. Pinecoders put out a bunch of functions for various routines wherein the built-in doesn't allow for a series as a length. I got some help from @everget (awesome dude) to do the dev() function as well... can't find the ALMA anywhere. So, here it is. It seems to match the built-in indicator. To double-check me, just put the ALMA built-in over this and they should match. Let me know if you find an issue.
That's it. ALMA is cool. I'm going to use it as the average for the CCI. Good day.

GMS: Keltner ChannelsBasically I wanted to make this into one indicator instead of three while adding in some extra options as well... So this is just a Keltner Channel with three channels, all of which have the same length. I have also added in an option to select the moving average for the channel, the original is based on the EMA.
The source code should be open so take a look around and enjoy!
Andre

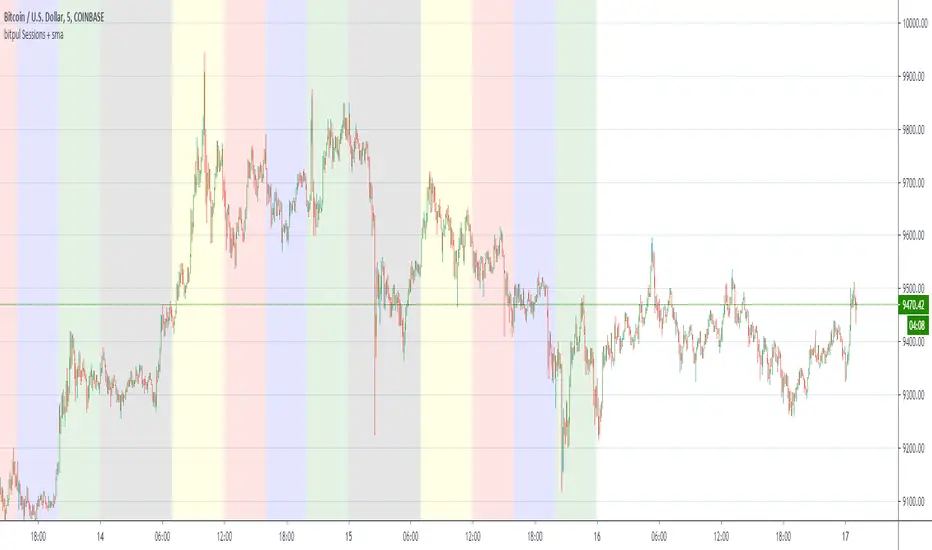
bitpul Sessions + sma [MHMK]Background colors that show open-close of the major market sessions ( Tokyo, London, joint time, New York, free time).
I added two sma to get more confirmation for the reversal - You can hide smas
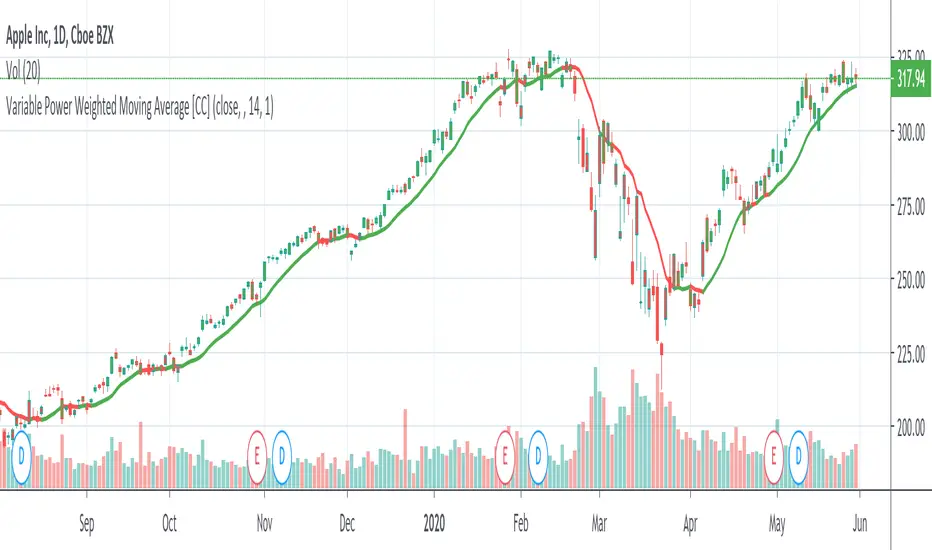
Variable Power Weighted Moving AverageThe Variable Power Weighted Moving Average was created by RedKTrader so make sure you follow them! This is a very handy indicator where you can change the weights of the weighted moving average yourself!
For an easy guide here are common values to use to convert this indicator into other indicators:
Power = 0 = Simple Moving Average
Power = 0.5 = Square Root Weighted Moving Average
Power = 1 = Weighted Moving Average
Power = 2 = Squared Weighted Moving Average
Try it out and let me know what you think!
Let me know if you have other ideas for me or if you want something custom done!
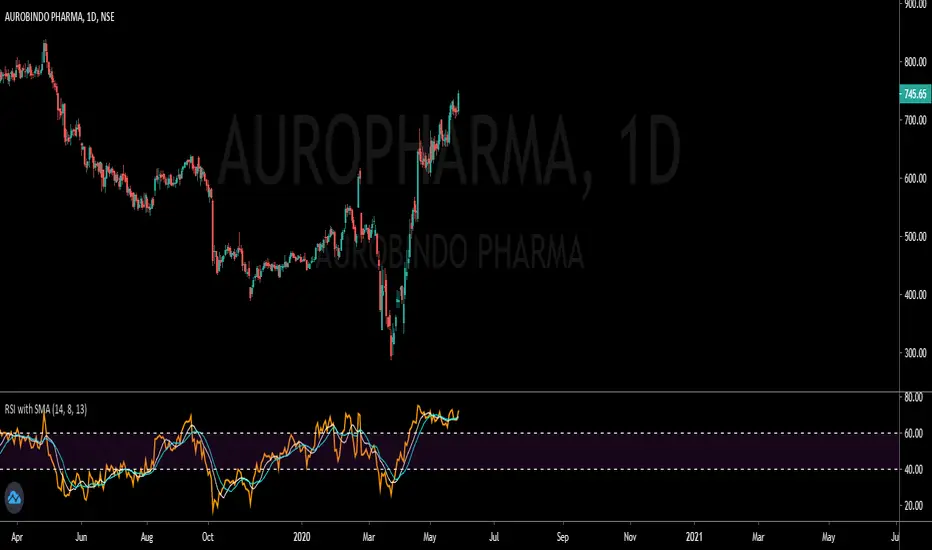
Captain Jack Williams %R EMA/SMAWilliams% R / EMA / SMA
This oscillator is designed from a different perspective. You can show the current price trend (EMA / SMA) in the background based on its transition. You can mix or split the background.
Investor behavior
Williams% R (% R) is a momentum-based oscillator used primarily in technical analysis to define overbought and oversold conditions. % R is based on the comparison between the current closing and the highest amount for a retrospective period defined by the investor. The% R (note negative values) between 0 and -100 indicates that the arrows show more purchase conditions when close to zero and over-sold when close to -100. In general,% R can create installations based on overbought and oversold conditions and general changes in momentum.
I wish good luck to the friends who will use it.
You can support and follow to see different machines.
Williams% R / EMA / SMA
Bu osilatör farklı bir perspektiften tasarlanmıştır. Geçerli fiyat eğilimini (EMA / SMA) geçişine göre arka planda gösterebilirsiniz. Arka planı karıştırabilir veya bölebilirsiniz.
Yatırımcı davranışı
Williams% R (% R), aşırı alım ve aşırı satım koşullarını tanımlamak için öncelikle teknik analizde kullanılan momentum tabanlı bir osilatördür. % R, mevcut kapanış ile yatırımcı tarafından tanımlanan geriye dönük bir döneme ilişkin en yüksek tutar arasındaki karşılaştırmaya dayanmaktadır. 0 ve -100 arasındaki% R (negatif değerleri not edin), okların sıfıra yakın olduğunda daha fazla satın alma koşulu gösterdiğini ve -100'e yakın olduğunda aşırı satıldığını gösterir. Genel olarak,% R aşırı alım ve aşırı satım koşullarına ve momentumdaki genel değişikliklere dayalı kurulumlar oluşturabilir.
Kullanacak arkadaşlara iyi şanslar diliyorum.
Farklı makineleri görmek için destekleyebilir ve takip edebilirsiniz.

CBG PaintBarsUses a linear regression of averages to paint bars.
Average types include SMA, EMA, Weighted, Hull, Symmetrical, Volume Weighted, Wilder, and Linear Regression.
Trend Analysis IndicatorThe Trend Analysis Indicator was created by Adam White (Stocks & Commodities V. 10:8 (358-360)) and this is not to be confused with the Trend Analysis Index which was also created by Adam White. The stock is trending when it is above the signal and loses steam when it falls below the signal. Generally you should buy when it is above it's signal and sell when it goes below the signal.
Let me know if you would like me to write more scripts!

MA * Fibo levels (auto)A few updates to the previous post.
In order to catch more exact points of TP and SL, the scrypt takes "high" as the source of SMA if the percentage is greater than 0 ( > 0), and "low" as the source when the given percentage is less than 0 ( < 0).
So there are two basic SMA line ( one with "high", the other one with "low"), and the other lines would be results of multiplying either the higher base or the lower one.
Good luck in trading!
If the scrypt was useful let me know!
Any feedbacks and ideas are welcomed!

CBG Keltner ChannelsKeltner Channel with the following Moving Average types: SMA, EMA, Weighted, Hull, Symmetrical, Volume Weighted, Wilder and Linear Regression. Plus 2 bands with full color shading.
The picture shows the Keltner channels with the Wilder MA, my favorite. See how easy it would have been to stay in the move down? Excellent indicator.

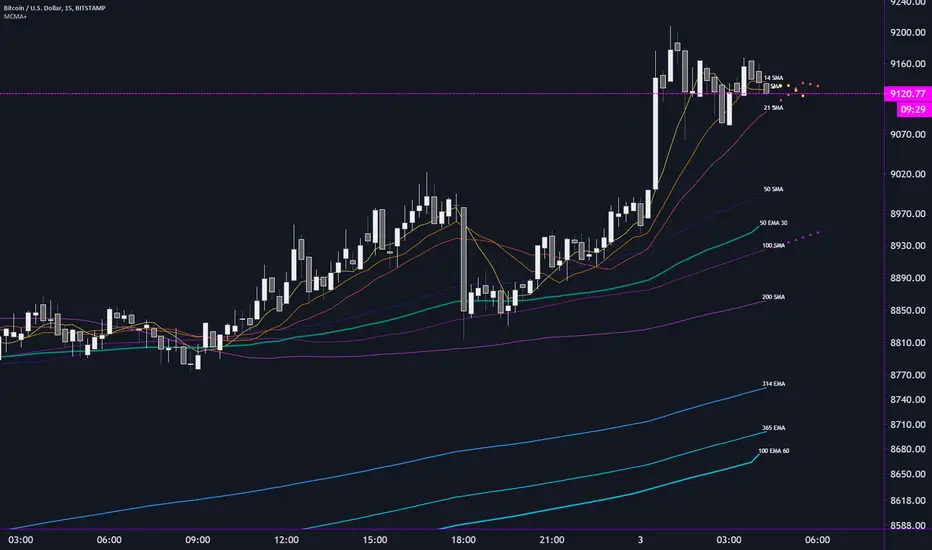
MCMA+ Multi Custom Moving Averages by Flinty + CryptorhythmsLatest release of my Multi Custom Moving Average indicator.
Plot up to 10 moving averages
for each MA, you can customise the following:
Period - from 1 to 1825 days
Type - DEMA, EMA, SMA, TEMA, VMWA or WMA
Source - Open, High, Low, Close, HL2, HLC3,OHLC4
The lowest and highest TF chart each MA will plot on. Only show the MA's you want on any time frame without having to continually adjust settings
Higher Time Frame MA -
Plot up to 3 additional moving averages from higher time frames
Customise each of these with Period, Type, Source, low and high TF plots and finally Time Frame
Time Frame can be a fixed TF or it can be set to always show the interval or period above the currently active TF
Labels can be customised to show the MA number or useful information such as the period, the MA type and the Time Frame where applicable
Another exciting feature is the ability to plot 7 bars ahead by enabling our prediction routine
This can be enabled for any three MA's
Hopefully I will be able to implement crossover alerts in the near future