Adaptive Supply and Demand [EdgeTerminal]Adaptive Supply and Demand is a dynamic supply and demand indicator with a few unique twists. It considers volume pressure, volatility-based adjustments and multi-time frame momentum for confidence scoring (multi-step confirmation) to generate dynamic lines that adjust based on the market and also to generate dynamic support/resistance levels for the supply and demand lines.
The dynamic support and resistance lines shown gives you a better situational awareness of the current state of the market and add more context to why the market is moving into a certain direction.
> Trading Scenarios
When the confidence score is over 80%, strong volume pressure in trend direction (up or down), volatility is low and momentum is aligned across timeframes, there is an indication of a strong upward or downward trend.
When the supply and demand line crossover, the confidence score is over 75% and the volume pressure is shifting, this can be an indicator of trend reversal. Use tight initial stops, scale into position as trend develops, monitor the volume pressure for continuation and wait for confidence confirmation.
When the confiance score is below 60%, the volume pressure is choppy, volatility is high, you want to avoid trading or reduce position size, wait for confidence improvements, use support and resistance for entries/exits and use tighter stops due to market conditions. This is an indication of a ranging market.
Another scenario is when there is a sudden volume pressure increase, and a raising confidence score, the volatility is expanding and the bar momentum is aligning the volatility direction. This can indicate a breakout scenario.
> How it Works
1. Volume Pressure Analysis
Volume Pressure Analysis is a key component that measures the true buying and selling force in the market. Here's a detailed breakdown. The idea is to standardize volume to prevent large spikes from skewing results.
The indicator employs an adaptive volume normalization technique to detect genuine buying and selling pressure.
It takes current volume and divides it by average volume.
If normVol > 1: Current volume is above average
If normVol < 1: Current volume is below average
An example if this would be If current volume is 1500 and average is 1000, normVol = 1.5 (50% above average)
Another component of the volume pressure analysis is the Price Change Calculation sub-module. The purpose of this is to measure price movement relative to recent average.
It works by subtracting the average price from the current price. If the value is positive, price is average and if negative, price is below average.
Finally, the volume pressure is calculated to combine volume and price for true pressure reading.
2. Savitzky-Golay Filtering
SG filtering implements advanced signal smoothing while preserving important trend features. It uses weighted moving average approximation, preserves higher moments of data and reduces noise while maintaining signal integrity.
This results in smoother signal lines, reduced false crossovers and better trend identification. Traditional moving averages tend to lag and smooth out important features. Additionally, simple moving averages can miss critical turning points and regular smoothing can delay signal generation.
SG filtering preserves higher moments such as peaks, valleys and trends, reduces noise while maintaining signal sharpness.
It works by creating a symmetric weighting scheme. This way center points get the highest weights while edge points get the lowest weight.
3. Parkinson's Volatility
Parkinson's Volatility is an advanced volatility measurement formula using high-low range data. It uses high-low range for volatility calculation, incorporates logarithmic returns and annualized the volatility measure.
This results in more accurate volatility measurement, better risk assessment and dynamic signal sensitivity.
4. Multi-timeframe Momentum
This combines signals from each module for each timeframe to calculate momentum across three timeframes. It also applies weighted importance to each timeframe and generates a composite momentum signal.
This results in a more comprehensive trend analysis, reduced timeframe bias and better trend confirmation.
> Indicator Settings
Short-term Period:
Lower values makes it more sensitive, meaning it will generate more signals. Higher values makes it less sensitive, resulting in fewer signals. We recommend a 5 to 15 range for day trading, and 10 to 20 for swing trading
Medium-term Period:
Lower values result in faster trend confirmation and higher values show slower and more reliable confirmation. We recommend a range of 15-25 for day trading and 20-30 for swing trading.
Long-term Period:
Lower values makes it more responsive to trend changes and higher values are better for major trend identification. We recommend a range of 40-60 for day trading and 50-100 for swing trading.
Volume Analysis Window:
Lower values result in more sensitivity to volume changes and higher values result in smoother volume analysis. The optimal range is 15-25 for most trading styles.
Confidence Threshold:
Lower values generate more signals but quality decreases. Higher values generate fewer signals but accuracy increases.The optimal range is 0.65-0.8 for most trading conditions.
Supplydemandtrading

Indecisive CandlesAn Indecisive Candle, often referred to as a Base Candle, is a pivotal element in technical analysis, particularly for identifying institutional supply and demand zones. These candles are characterized by their small bodies and long wicks, reflecting a balance between buyers and sellers, indicating a potential pause or consolidation in the market.
To calculate whether a candle qualifies as an indecisive candle based on the criterion that its body (the absolute difference between its open and close prices) is less than or equal to 50% of the total range of the candle (the difference between its high and low prices).
Key Features:
Small Real Body: Signifies minimal movement from open to close, indicating market indecision.
Long Upper and Lower Wicks: Show that both bulls and bears attempted to control the price, but neither succeeded, leading to a standoff.
Formation Context: Typically found at the end of a strong trend or within a consolidation phase, hinting at a potential reversal or continuation pattern.
Usage in Identifying Institutional Supply and Demand:
Supply Zones: When an Indecisive Candle forms after a rally, it can mark the onset of an institutional supply zone, suggesting that large entities are starting to sell, leading to potential downward pressure.
Demand Zones: Conversely, when this candle appears after a downtrend, it often signals the emergence of a demand zone, where institutions begin to accumulate, anticipating a price increase.
Trading Strategies:
Zone Identification: Use Indecisive Candles to pinpoint key supply and demand zones on your chart, enhancing the accuracy of your support and resistance levels.
Confirmation: Look for confirmation from subsequent price action or volume spikes to validate the presence of institutional activity before making trading decisions.
Risk Management: Place stop-loss orders beyond the wicks of these candles to protect against false breakouts or continued indecision.
Conclusion:
Indecisive Candles are essential tools for traders looking to understand market sentiment and institutional behavior. By mastering their identification and interpretation, you can enhance your ability to spot high-probability trading opportunities and manage risks effectively.

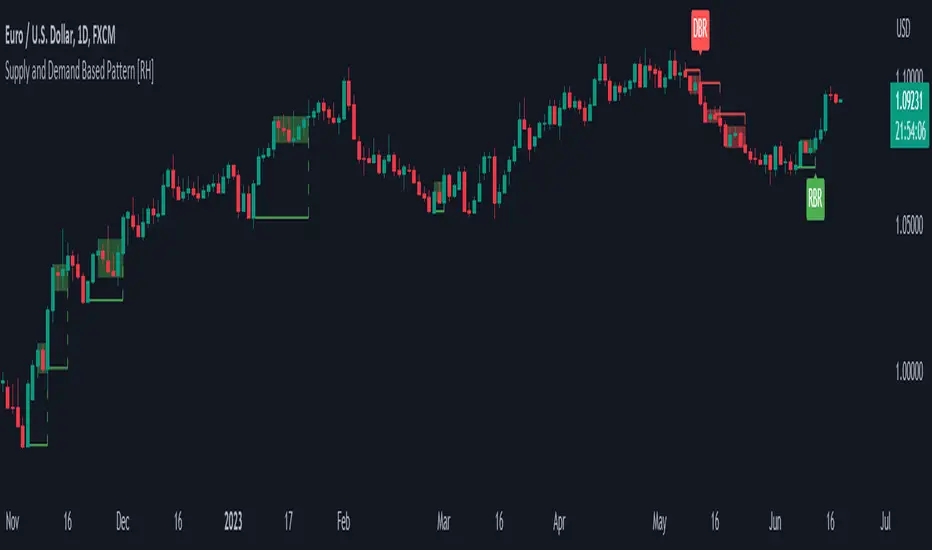
Supply and Demand Based Pattern [RH]This indicator focuses on detecting RBR and DBD patterns, which signify periods of increased momentum and potential continuation or reversal of the prevailing trend.
The RBR pattern consists of a rally (upward movement), followed by a base (consolidation or retracement), and then another rally. It suggests that the upward momentum may persist and provide trading opportunities.
On the other hand, the DBD pattern comprises a drop (downward movement), followed by a base, and then another drop. It indicates that the downward momentum might continue, offering potential shorting opportunities.
Bullish(RBR) example:
Bearish(DBD) example:
1. The bullish (RBR) and bearish (DBD) patterns share the same underlying logic, only differing in their directionality.
2. For both RBR and DBD patterns, the first rise/drop can consist of one or multiple candles. However, in the case of multiple candles, all candles must exhibit a bullish nature for RBR and a bearish nature for DBD.
Example:
3. It is a prerequisite for the first rise/drop to include at least one candle with a defined percentage of health, as determined by the user.
4. The base, following the first rise/drop, may comprise one or multiple candles.
Example:
5. To maintain consistency, the base is not allowed to retrace beyond 80%, although this value can be adjusted by the user.
6. Similar to the first rise/drop, the second rise/drop in both RBR and DBD patterns can consist of one or multiple candles. However, all candles within this phase must demonstrate a bullish nature for RBR and a bearish nature for DBD.
7. Confirmation of the bullish (RBR) pattern occurs when a candle closes above the high of the first rise. Conversely, the bearish (DBD) pattern is confirmed when a candle closes below the low of the first drop.
Example:
Alerts can be set for all bullish and bearish pattern or for the first pattern in the range of similar pattern.
Volume-based Support & Resistance Zones-V1 By Trade Mastership™ The all-new Support & Resistance Zones indicator, which has been upgraded to offer traders more powerful features and functionality. This innovative indicator identifies high-volume fractal lows or highs to create zones based on the size of the wick for that timeframe's candle. This makes it easy for traders to visualize which price levels are the most significant for either a trend continuation or a reversal when zones are broken and retested.
The original script for this indicator was created by Trade Mastership, with additional modifications by L N Behera. Credit goes to both of them for the majority of the logic behind this script. Since then, the script has been improved with several changes, including:
Changing the default S/R lines from plots to lines, and giving users the option to change between solid, dashed, or dotted lines for both S/R lines
Adding additional timeframes and more options for TF1, beyond the current TF. Now, users have four timeframes to plot S/R zones from
Giving users the option to easily change the line thickness for all S/R lines
Making it easier to change the colors of S/R lines and zones by consolidating the options under settings (rather than under style)
Adding extensions to active SR Zones to extend all the way right
Adding the option to extend or not extend the previous S/R zones up to the next S/R zone
Adding optional timeframe labels to active S/R zones, with left and right options, as well as the option to adjust how far to the right the label is set
Fixing an issue where the higher timeframe S/R zone was not properly starting from the high/low of fractal. Now, any higher timeframe S/R will begin exactly at the High/Low points. Note that this may not work perfectly on stocks, and if a fractal high/low is too many bars in the past, it will revert to a default max bars back to avoid script errors.
Adding a function to prevent S/R zones from lower timeframes displaying while on a higher timeframe. This helps clean up the chart quite a bit.
Creating arrays for each timeframe's boxes and lines so that the number of S/R zones can be controlled for each timeframe and limit memory consumption.
Adding new alert options and customized alert messages
Here's how this indicator works: it looks for fractal highs or fractal lows with volume that pierces above the volume's Moving Average. This moving average value can be modified in the settings for each timeframe. The fractal highs will be confirmed with three successive higher highs followed by two successive lower highs and vice versa for the fractal lows. The zone is created from the fractal high/low and the close of the candle for whatever timeframe you selected. The bigger the zone, the more significant that zone is.
Traders can disable any zone, change the zones to show lines only, and modify all the colors, transparencies, and thickness of lines for all the zones. To create alerts, traders can enable the types of alerts they want for each timeframe in the indicator's settings. After applying changes, right-click on one of the zones on the chart, and click "Add Alert on Vol S/R Zones." You do not need to add a title, as the correct alert messages are already built-in.
The latest update has migrated the script to Pine Script Version 5 and added a higher number of total boxes/lines to show on the chart. It has also increased the max bars count to the maximum Pine Script allows, enabling traders to utilize as many bars as possible when drawing the left side of SR zones that are very far back on the chart. Additionally, the update fixed issues where the indicator would not load on 1 minute and 3-minute charts unless higher timeframe SR zones

Period OpenA very simple indicator that displays the Open of the specified Timeframe
How to use this indicator?
1. Directional Bias
Bullish => Closing Price > Period Open
Bearish => Closing Price < Period Open
2. Support / Resistance
Each Period Open can be used as Support or Resistance
3. Take Profit Targets
Each Period Open can be used as targets for taking profit
