Custom Time Frame BackgroundThis indicator allows you to highlight custom time frames on your chart with alternating background colors. It's particularly useful for visualizing specific intervals that are not standard on TradingView, such as 4-hour, 6-hour, or any other custom duration you choose. Features:
Customizable time frames: Set any combination of minutes, hours, and days
Fallback to daily/weekly coloring if no custom time frame is set
User-defined colors for alternating backgrounds
How to use:
Add the indicator to your chart
In the settings, input your desired custom time frame:
Set 'Custom Minutes' for intervals less than an hour
Use 'Custom Hours' for hourly intervals
Use 'Custom Days' for daily intervals
Adjust 'Color 1' and 'Color 2' to your preferred background colors
Examples:
For a 4-hour time frame: Set Custom Hours to 4
For a 6-hour time frame: Set Custom Hours to 6
For a 2-day time frame: Set Custom Days to 2
If all inputs are set to 0, the indicator will default to daily coloring for intraday charts and weekly coloring for higher timeframes. This indicator helps traders visually segment their charts into custom intervals, making it easier to identify patterns and trends over specific time periods.
時間

Time Vertical LinesVLines - Time-Based Vertical Lines with Zones
This PineScript indicator creates vertical time lines with customizable zones between them. Perfect for marking trading sessions, key market times, or any time-based analysis.
Key Features:
- 5 configurable time lines
- 3 customizable zones (between lines 1-2, 2-3, and 4-5)
- Each zone features:
- Background shading
- Horizontal lines at high/low points
- Independent color controls
- Adjustable line styles and widths
- Time zone offset adjustment
- Option to show/hide historical lines
Installation Instructions:
1. Open TradingView's Pine Script Editor
2. Create a new script
3. Copy and paste the entire code
4. Add to Chart
Setup Guide:
1. Time Zone Adjustment:
- Find the "Time Zone Offset (Hours)" setting
- Adjust if lines appear at wrong times
- Example: If lines appear 3 hours early, set offset to 3
2. Basic Time Lines (1-3):
- Each line has settings for:
- Hour (0-23)
- Minute (0-59)
- Color
- Show/Hide toggle
3. Session Lines (4-5):
- Special lines typically used for session marking
- Same settings as basic lines
- Default red color to distinguish from other lines
4. Zone Customization:
Three separate zones are available:
- Zone 1-2 (between first and second lines)
- Zone 2-3 (between second and third lines)
- Zone 4-5 (between fourth and fifth lines)
Each zone can be customized with:
- Background color and transparency
- Horizontal line color
- Line style (Solid/Dashed/Dotted)
- Line width
- Individual show/hide toggles for zone and lines
5. Additional Settings:
- "Show Historical Lines" - toggle to show/hide lines on previous days
- Global line style and width settings for vertical lines
Suggested Uses:
1. Mark pre-market, market, and post-market sessions
2. Highlight specific trading windows
3. Track time-based support/resistance levels
4. Monitor price ranges during specific time periods
Tips:
- Start by setting just one zone to get familiar with the controls
- Use different colors for different sessions/time periods
- Adjust transparency to maintain chart visibility
- Use the show/hide toggles to focus on specific times
- The horizontal lines automatically mark the high/low range between time points

Sessions Full Markets [TradingFinder] Forex Stocks Index 7 Time🔵 Introduction
In global financial markets, particularly in FOREX and stocks, precise timing of trading sessions plays a crucial role in the success of traders. Each trading session—Asian, European, and American—has its own unique characteristics in terms of volatility and trading volume.
The Asian session (Tokyo), Sydney session, Shanghai session, European session (London and Frankfurt), and American session (New York AM and New York PM) are examples of these trading sessions, each of which opens and closes at specific times.
This session indicator also includes a Time Convertor, enabling users to view FOREX market hours based on GMT, UTC, EST, and local time. Another valuable feature of this indicator is the automatic detection of Daylight Saving Time (DST), which automatically applies time changes for the New York, London, and Sydney sessions.
🔵 How to Use
The indicator also displays session times based on the exact opening and closing times for each geographic region. Users can utilize this indicator to view trading hours either locally or in UTC time, and if needed, set their own custom trading times.
Additionally, the session information table includes the start and end times of each session and whether they are open or closed. This functionality helps traders make better trading decisions by using accurate and precise time data.
Key Features of the Session Indicator
The session indicator is a versatile and advanced tool that provides several unique features for traders.
Some of these features are :
• Automatic Daylight Saving Time (DST) Detection : This indicator dynamically detects Daylight Saving Time (DST) changes for various trading sessions, including New York, London, and Sydney, without requiring manual adjustments. This feature allows traders to manage their trades without worrying about time changes.
Below are the start and end dates for DST in the New York, London, and Sydney trading sessions :
1. New York :
Start of DST: Second Sunday of March, at 2:00 AM.
End of DST: First Sunday of November, at 2:00 AM
2. London :
Start of DST: Last Sunday of March, at 1:00 AM.
End of DST: Last Sunday of October, at 2:00 AM.
3. Sydney :
Start of DST: First Sunday of October, at 2:00 AM.
End of DST: First Sunday of April, at 3:00 AM.
• Session Display Based on Different Time Zones : The session indicator allows users to view trading times based on different time zones, such as UTC, the local time of each market, or the user’s local time. This feature is especially useful for traders operating in diverse geographic regions.
• Custom Trading Time Setup : Another notable feature of this indicator is the ability to set custom trading times. Traders can adjust their own trading times according to their personal strategies and benefit from this flexibility.
• Session Information Table : The session indicator provides a complete information table that includes the exact start and end times of each trading session and whether they are open or closed. This table helps users simultaneously and accurately monitor the status of all trading sessions and make better trading decisions.
🟣 Session Trading Hours Based on Market Mode and Time Zones
The session indicator provides precise information on the start and end times of trading sessions.
These times are adjusted based on different market modes (FOREX, stocks, and TFlab suggestions) and time zones (UTC and local time) :
🟣 (FOREX Session Time) Forex Market Mode
• Sessions in UTC (DST inactive) :
Sydney: 22:00 - 06:00
Tokyo: 23:00 - 07:00
Shanghai: 01:00 - 09:00
Asia: 22:00 - 07:00
Europe: 07:00 - 16:00
London: 08:00 - 16:00
New York: 13:00 - 21:00
• Sessions in UTC (DST active) :
Sydney: 21:00 - 05:00
Tokyo: 23:00 - 07:00
Shanghai: 01:00 - 09:00
Asia: 21:00 - 07:00
Europe: 06:00 - 15:00
London: 07:00 - 15:00
New York: 12:00 - 20:00
• Sessions in Local Time :
Sydney: 08:00 - 16:00
Tokyo: 08:00 - 16:00
Shanghai: 09:00 - 17:00
Asia: 22:00 - 07:00
Europe: 07:00 - 16:00
London: 08:00 - 16:00
New York: 08:00 - 16:00
🟣 Stock Market Trading Hours (Stock Market Mode)
• Sessions in UTC (DST inactive) :
Sydney: 00:00 - 06:00
Asia: 00:00 - 06:00
Europe: 07:00 - 16:30
London: 08:00 - 16:30
New York: 14:30 - 21:00
Tokyo: 00:00 - 06:00
Shanghai: 01:30 - 07:00
• Sessions in UTC (DST active) :
Sydney: 23:00 - 05:00
Asia: 23:00 - 06:00
Europe: 06:00 - 15:30
London: 07:00 - 15:30
New York: 13:30 - 20:00
Tokyo: 00:00 - 06:00
Shanghai: 01:30 - 07:00
• Sessions in Local Time:
Sydney: 10:00 - 16:00
Tokyo: 09:00 - 15:00
Shanghai: 09:30 - 15:00
Asia: 00:00 - 06:00
Europe: 07:00 - 16:30
London: 08:00 - 16:30
New York: 09:30 - 16:00
🟣 TFlab Suggestion Mode
• Sessions in UTC (DST inactive) :
Sydney: 23:00 - 05:00
Tokyo: 00:00 - 06:00
Shanghai: 01:00 - 09:00
Asia: 23:00 - 06:00
Europe: 07:00 - 16:00
London: 08:00 - 16:00
New York: 13:00 - 21:00
• Sessions in UTC (DST active) :
Sydney: 22:00 - 04:00
Tokyo: 00:00 - 06:00
Shanghai: 01:00 - 09:00
Asia: 22:00 - 06:00
Europe: 06:00 - 15:00
London: 07:00 - 15:00
New York: 12:00 - 20:00
• Sessions in Local Time :
Sydney: 09:00 - 16:00
Tokyo: 09:00 - 15:00
Shanghai: 09:00 - 17:00
Asia: 23:00 - 06:00
Europe: 07:00 - 16:00
London: 08:00 - 16:00
New York: 08:00 - 16:00
🔵 Setting
Using the session indicator is straightforward and practical. Users can add this indicator to their trading chart and take advantage of its features.
The usage steps are as follows :
Selecting Market Mode : The user can choose one of the three main modes.
Forex Market Mode: Displays the forex market trading hours.
oStock Market Mode: Displays the trading hours of stock exchanges.
Custom Mode: Allows the user to set trading hours based on their needs.
TFlab Suggestion Mode: Displays the higher volume hours of the forex market in Asia.
Setting the Time Zone : The indicator allows displaying sessions based on various time zones. The user can select one of the following options:
UTC (Coordinated Universal Time)
Local Time of the Session
User’s Local Time
Displaying Comprehensive Session Information : The session information table includes the opening and closing times of each session and whether they are open or closed. This table helps users monitor all sessions at a glance and precisely set the best time for entering and exiting trades.
🔵Conclusion
The session indicator is a highly efficient and essential tool for active traders in the FOREX and stock markets. With its unique features, such as automatic DST detection and the ability to display sessions based on different time zones, the session indicator helps traders to precisely and efficiently adjust their trading activities.
This indicator not only shows users the exact opening and closing times of sessions, but by providing a session status table, it helps traders identify the best times to enter and exit trades. Moreover, the ability to set custom trading times allows traders to easily personalize their trading schedules according to their strategies.
In conclusion, using the session indicator ensures that traders are continuously and accurately informed of time changes and the opening and closing hours of markets, eliminating the need for manual updates to align with DST changes. These features enable traders to optimize their trading strategies with greater confidence and up-to-date information, allowing them to capitalize on opportunities in the market.

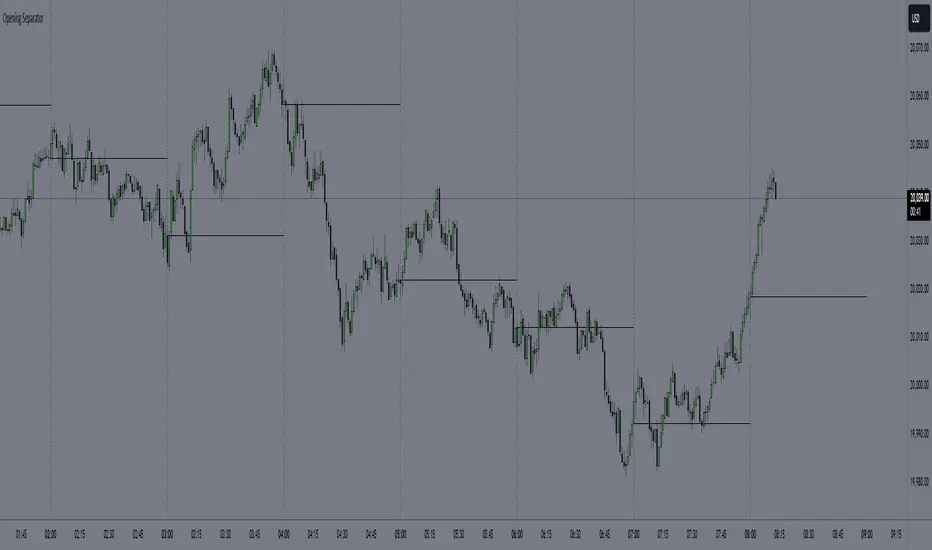
Hourly Separator + Opening LineThis indicator shows the vertical and horizontal opening lines for the hourly timeframe.
Also has options to choose a different opening time:
- 1 Hour
- 30 Min
- 15 Min
- 10 Min
- 5 Min
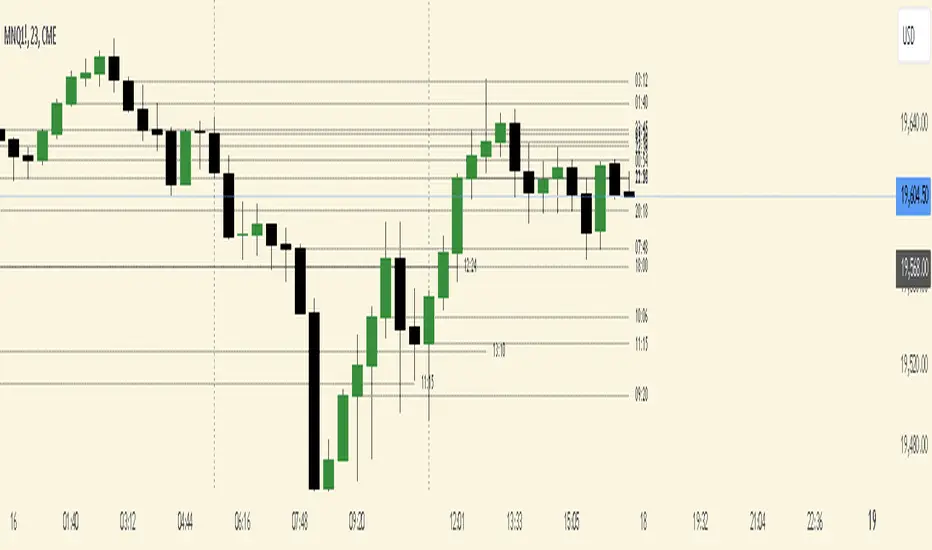
Time-input Lines [MFX]THE LINES
The indicator plots a horizontal price line at a specified hour and minute (default: 9:30 - Equities Open). This line extends for a predefined number of minutes (default: 60 minutes - Opening Range Full Spectrum). Additionally, the indicator can plot two vertical lines: one at the selected start time and another at the end of the horizontal line.
STYLE
Both the horizontal and vertical lines are fully customizable, allowing adjustments to color, style, and width. For a cleaner, minimalist chart, any of these lines can be disabled.
TIMEZONE
By default, the indicator operates in the New York time zone, but this can be modified by unchecking the option and specifying a custom offset relative to UTC/GMT. The default offset is +2, corresponding to CEST (Central European Summer Time, UTC/GMT+2). The offset can be adjusted with up to 15-minute precision, where 0.25 represents a quarter of an hour.

ICT Time Levels Description:
The Time Levels Indicator is designed to enhance trading decisions by marking significant price levels at key times throughout the trading day. This indicator specifically focuses on three crucial times: 8:30 AM, 9:30 AM, and 10:00 AM (UTC-4), which are often associated with significant market movements.
Key Features:
Customizable Time Levels: Users can toggle the display of price levels at 8:30 AM, 9:30 AM, and 10:00 AM. Each level is marked with a line on the chart, which helps traders visually identify these critical points.
Style and Color Options: Customize the appearance of each time level with different line styles (solid, dotted, dashed) and colors to match your chart preferences.
Dynamic Labeling: The indicator automatically places a label at the current price level for each time, making it easier to identify and track these levels as the day progresses.
Real-Time Updates: As the trading session unfolds, the indicator adjusts the lines and labels to reflect the latest price data at the specified times.
How It Works:
At the specified times (8:30 AM, 9:30 AM, and 10:00 AM), the indicator captures the opening price and plots a horizontal line at that level.
These lines serve as reference points, helping traders to observe how the price interacts with these key levels throughout the day.
The lines and labels are fully customizable, allowing users to adapt the indicator to their trading style and visual preferences.
Use Cases:
Market Open Strategies: Traders can use the 9:30 AM level to monitor the opening price of the New York Stock Exchange (NYSE), which often sets the tone for the trading session.
Morning Volatility: The 8:30 AM and 10:00 AM levels can be useful for identifying potential support and resistance levels during periods of increased volatility, such as economic data releases or after the market opens.
This indicator is particularly useful for intraday traders who focus on morning trading sessions and want to have a clear visual reference to guide their decisions.
Note: This script is designed to be simple yet effective, providing traders with essential information without cluttering the chart.

ICT Intraday Timeline [neo.|]ICT Intraday Timeline is a script that aims to cleanly display key times that the "Inner Circle Trader" often refers to during the day on a separate pane in your Tradingview chart. While using it, you can clearly see the time it is currently in New York time, as well as your own through Tradingview as usual, as well as relevant times such as the lunch times, Silver Bullet times, and Asian range time.
By using this indicator it is simpler to consider what every time is doing and the effect it has on your current bias, for example: you may want to look at the 8:30 am open which is where news usually comes out, if not you can use 9:30 am for formulating trades. The AM SB is a time for when the "Silver Bullet (ICT)" setup can be found and executed, as it refines a specific range and targets inefficiencies and allows liquidity to form for which it comes back for, meaning it may be a better time for you to enter a trade, these are just examples of what you can look for, and how considering time can help you come up with and refine trade ideas.
Other times which are included are the:
Asia Range: You can mark out the highs and lows which occur during this time to use as liquidity later.
Midnight Open: On equities price will often interact with the midnight opening price, meaning it is an important time to consider.
London Open SB and Premarket SB: As mentioned previously you can find the "Silver Bullet" setup in here.
NY Lunch & London Lunch: Lunch times usually mean less volume therefore you may see less probable trades at this time.
AM SB and PM SB: Once again, times where you can potentially find more probable trades.
You can also easily customize any of the colors such as the SB (Silver Bullet) times, London lunch and NY Lunch times, or the Asia range or line colors to your preference and individual chart style.

Key Times & Opening Prices [Olitrades]This indicator plots key time's (opening prices) with the possibility of vertical separators. It was initially created to utilize on the indices futures market, utilizing ICT logic.
These opening prices are often utilized to determine if price is currently at a premium or a discounted value.
The default times include:
Daily Open (18:00 PM)
Midnight (00:00 AM)
Settlement (15:00 PM)
7:30 AM
8:30 AM
9:30 AM (Equities Open)
10:00 AM (Morning 4h Candle Open)
14:00 PM (Afternoon 4h Candle Open)
Along with up to three custom time slots.
All times used in the indicator are Eastern Standard time (New York local time) and will automatically adjust no matter your time zone.
Historical
When in historical mode, the indicator will keep the previous levels so you can easily visualize them and their relation to price.
You can also choose how many past levels you want to see. This allows you to back test only specific days/weeks.
Other Inputs
The indicator contains an adjustable offset, to modify how far the line extends depending on the current timeframe.
Each one of the above-mentioned levels can be turned on and off, including the custom times. You can also choose between plotting just the opening price, a vertical line separator, or both! All of these lines have adjustable styles (dotted, dashed or solid) and width.
They also have custom cut offs. You may choose specific cut off times for custom time slots (when to stop extending the lines), as well as for AM (before noon) default levels and PM (after noon) default levels.
The indicator also allows to show text labels next to these lines, which is set by default but can be turned off. Custom times also include custom text options.

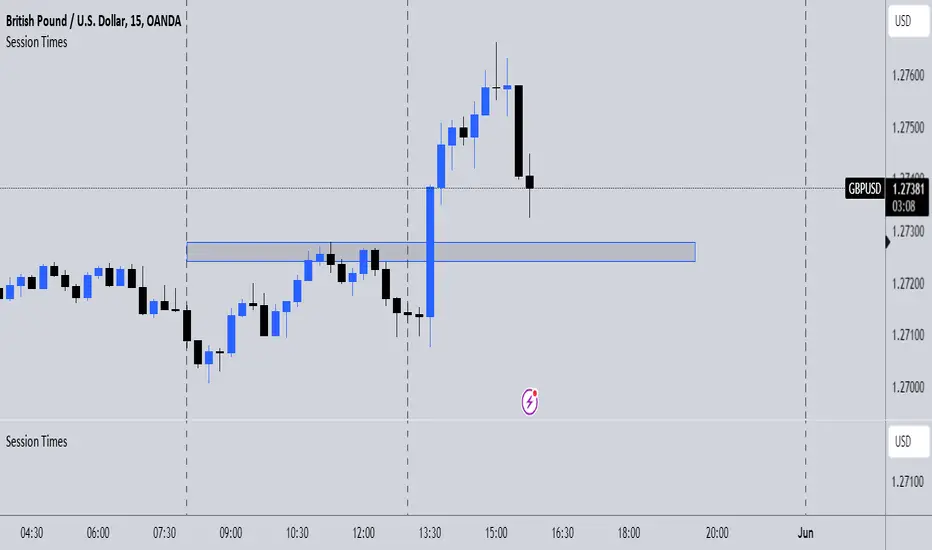
Muti TimeFrame 1st Minute High and a LowThis Pine Script code is designed to plot the high, close, and low prices at exactly 9:31 AM on any timeframe chart. Here's a breakdown of what the script does:
Inputs
Define the start time of the trading day (default: 9:30 AM)
Define the end time of the trading day (default: 4:00 PM)
Toggle to display daily open and close lines (default: true)
Toggle to extend lines for daily open and close (default: false)
Calculations
- Determines if the current bar is the first bar of the trading day (9:30 AM)
- Retrieves the high, close, and low prices at 9:31 AM for the current timeframe
- Plots these prices as crosses on the chart
- Draws lines for the 4 pm close and 9:30 am open, as well as lines for the high and low of the first candle
- Calculates the start and end times for a rectangle box and draws the box on the chart if the start price high and low are set
Features
- Plots the high, close, and low prices at exactly 9:31 AM on any timeframe chart
- Displays daily open and close lines
- Extends lines for daily open and close (optional)
- Draws a rectangle box around the first candle of the day (optional)
Markets
- Designed for use on various markets, including stocks, futures, forex, and crypto
This script is useful for traders who want to visualize the prices at the start of the trading day and track the market's movement throughout the day.

Ultra SessionsThe "Ultra Sessions" indicator is designed to enhance your trading strategy by clearly marking key market sessions and their associated "kill zones" directly on your chart. This powerful tool supports multiple time zones and provides customizable alerts for session opens, closes, and critical kill zones, ensuring you never miss important market movements.
Customizable Time Zones: Align the indicator with your local time by selecting from a wide range of global time zones.
Market Session Tracking: Visually track the New York, London, and Tokyo trading sessions with distinct color-coded markers.
Kill Zones: Highlight the high-volatility periods within each session to focus on key trading opportunities.
Alert System: Receive real-time alerts for session openings, closings, and kill zones, so you stay informed without constantly monitoring the chart.
Flexible Positioning: Choose the positioning of session markers to fit your chart layout, whether at the top or bottom.
Ideal for traders who want to optimize their entry and exit points by focusing on the most active and volatile times in the market, the indicator is a must-have for any serious trading setup.

World Clock [VHX]Keeping track of local times across different time zones has always been a challenge, especially when working with global markets.
But worry no more, as we now have a solution tailored for this very need. With this indicator, you can effortlessly add two different time zones to your chart, making it easier than ever to stay on top of market activity. The indicator not only shows the current date and time for the selected time zones but also integrates seamlessly with your chart, ensuring that you’re always aligned with the right market timings, no matter where you or your trades are based.
Unfortunately, the clock won't function when the market is closed.

Opening Price LinesThis script allows the user to set 16 custom opening time price lines and labels, as well as 4 vertical lines to delineate times of the day.
Opening price is crucial for PO3 and OHLC/OLHC market strategies. If you are bearish, you want to get in above the opening price of a candle; conversely if you are bullish you want to enter below the opening price of a candle.
This indicator will aid in identifying time clusters in price as well as identifying important times for whatever strategy the user employs.
*Many thanks to TFO for the framework from which this indicator was created.*
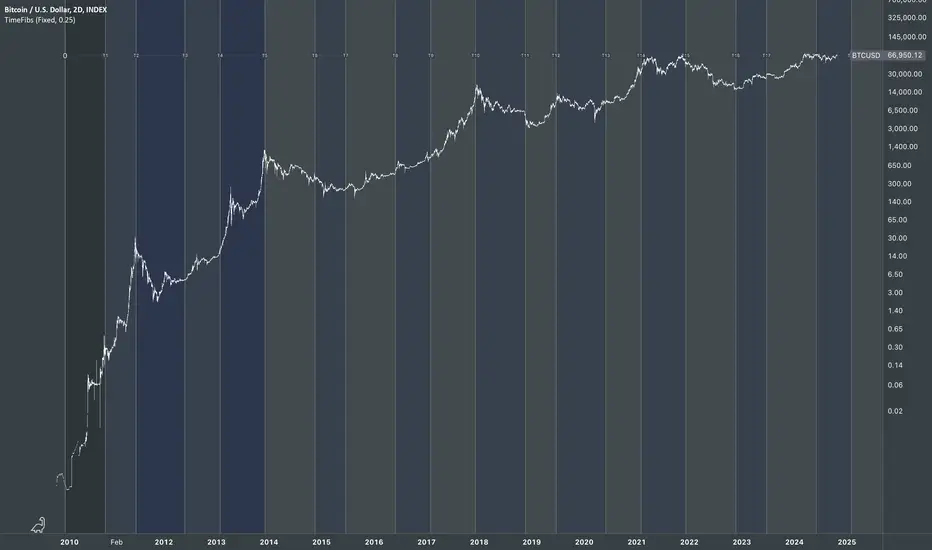
Fibonacci Time PeriodsThe " Fibonacci Time Periods " indicator uses power exponents of the constant Phi based on your custom time period to generate Fibonacci sequence-based progression on a given chart. This tool can help to anticipate the timing of potential turning points by highlighting Fib time zones where significant price movements may occur.
It is different from other alternatives specifically for the ability to alter the rate of progression .
Most famous regular Fib sequence expands with 1.618^(n+1) rate which produces vast change just after few iterations.
Those ever-expanding big intervals don't allow us to cover the smaller details of the chart which we might find crucial. So, the idea was born to break down the constant Phi to a self-fraction using power exponents. In other words, reducing rate of progression to make the expansion more gradual without losing properties of Fibonacci proportions.
Default settings have a rate of 0.25 which is basically Phi^1/4
That means we expect 4x more lines than in regular sequence to cover missing bits owing to formula: 1.618^(0.25*(n+1))
(Line 0.618 is added to enhance visual orientation and perception of proportions)
How it works:
Exponential rate of progression
First, it works out the difference between your custom start (0) and end (1) period
The result is multiplied by 1.618^rate to get the step
Rest lines are created by iterations. For instance, with default rate of 0.25, the 1st generated line = start + (End-Start)*1.618^0.25* 1 , second line = start + (End-Start)*1.618^0.25* 2 , etc.
If we change the rate to 1 it will produce the regular fib sequence with 1.618^(n+1) rate
Fixed rate of progression:
In this mode, when rate is 0.25, it grows exactly with exponent step of 0.25 so first, second, third, etc generated lines also have the fixed exponent of 0.25. The distance between lines do not expand.
How to use:
Set the start and end dates
Choose the type of progression
Choose your desired rate of progression
Customize the colors to match your chart preferences.
Observe the generated Fibonacci time intervals and use them to identify potential market movements and reactions.
Time Vertical LineThis indicator is designed to plot vertical lines at specified hourly intervals on a trading chart. The indicator includes default settings to draw vertical lines at every hour of the day and provides users with the flexibility to customize up to six additional vertical lines at specified times.
Traders can use the vertical lines to segment the trading day, making it easier to analyze market movements within specific hours.
Customizable lines allow traders to mark important times such as market openings, closings, and economic news releases.
This indicator is a powerful tool for traders who need to keep track of specific times and events during the trading day, providing a clear and customizable visual representation of time on their charts.
The indicator allows you to easily customize the appearance of the 24 default vertical lines that mark each hour of the day. You can change the color by adjusting the Color input, modify the transparency using the Transparency input, and set the line width with the Line Width input.
Each of custom lines can have its own color, transparency, and line width, giving you full control over their appearance. By default, these custom vertical lines are turned off. To activate them, go to the "Style" tab in the settings menu of the indicator.
The time for each vertical line is based on the exchange's timezone. You can set the time for each of the 6 custom vertical lines using decimal notation. For example:
Input 9.1 to display a vertical line at 9:10.
Input 9.15 to display a vertical line at 9:15.
The indicator should only be displayed in time frames less than 15 minutes. Go to "Visibility" in settings for options.

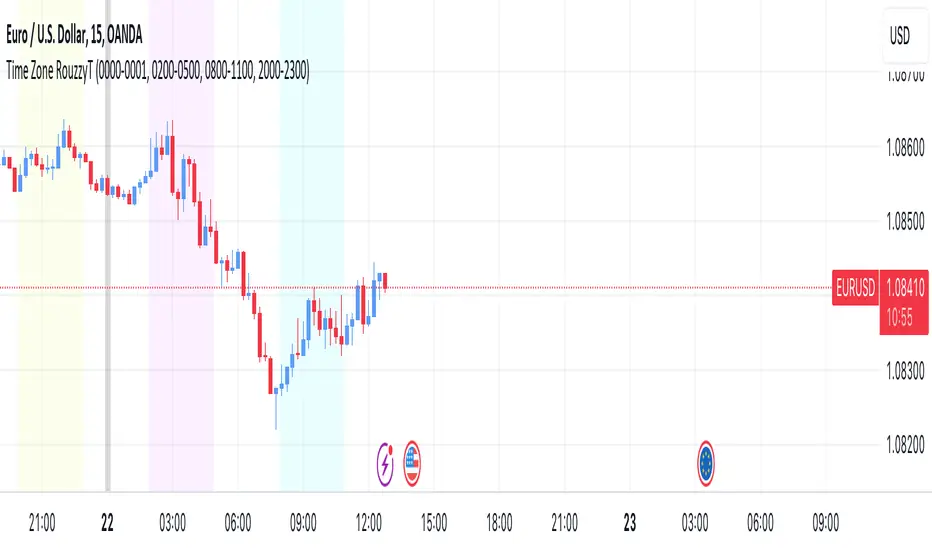
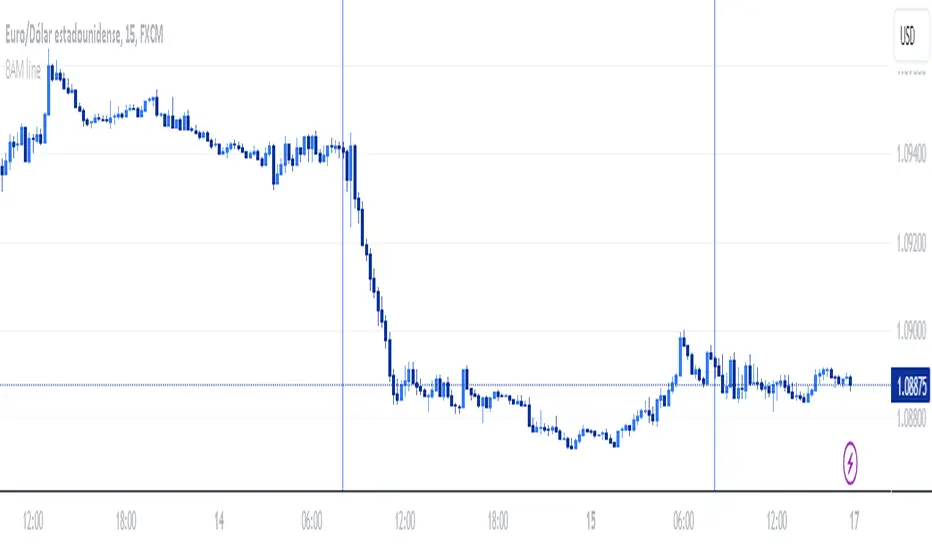
Time Zone RouzzyTNYC , London & Asia section
Each time-zone has a different color to be able to distinguish which section we are in at the moment.
These sessions have been identified to operate the EURUSD, apart from that it also works with the DXY.
London is identified with the color light purple.
NYC is identified with the color turquoise blue.
Asia is identified with the color yellow.
The beginnings of each Day are identified with the color gray.
London is from 2am to 5am
NYC from 8am to 11am
Asia from 8pm to 11pm
OANDA:EURUSD
FX:EURUSD
TVC:DXY
Seasonality Widget [LuxAlgo]The Seasonality Widget tool allows users to easily visualize seasonal trends from various data sources.
Users can select different levels of granularity as well as different statistics to express seasonal trends.
🔶 USAGE
Seasonality allows us to observe general trends occurring at regular intervals. These intervals can be user-selected from the granularity setting and determine how the data is grouped, these include:
Hour
Day Of Week
Day Of Month
Month
Day Of Year
The above seasonal chart shows the BTCUSD seasonal price change for every hour of the day, that is the average price change taken for every specific hour. This allows us to obtain an estimate of the expected price move at specific hours of the day.
Users can select when data should start being collected using the "From Date" setting, any data before the selected date will not be included in the calculation of the Seasonality Widget.
🔹 Data To Analyze
The Seasonality Widget can return the seasonality for the following data:
Price Change
Closing price minus the previous closing price.
Price Change (%)
Closing price minus the previous closing price, divided by the
previous closing price, then multiplied by 100.
Price Change (Sign)
Sign of the price change (-1 for negative change, 1 for positive change), normalized in a range (0, 100). Values above 50 suggest more positive changes on average.
Range
High price minus low price.
Price - SMA
Price minus its simple moving average. Users can select the SMA period.
Volume
Amount of contracts traded. Allow users to see which periods are generally the most /least liquid.
Volume - SMA
Volume minus its simple moving average. Users can select the SMA period.
🔹 Filter
In addition to the "From Date" threshold users can exclude data from specific periods of time, potentially removing outliers in the final results.
The period type can be specified in the "Filter Granularity" setting. The exact time to exclude can then be specified in the "Numerical Filter Input" setting, multiple values are supported and should be comma separated.
For example, if we want to exclude the entire 2008 period we can simply select "Year" as filter granularity, then input 2008 in the "Numerical Filter Input" setting.
Do note that "Sunday" uses the value 1 as a day of the week.
🔶 DETAILS
🔹 Supported Statistics
Users can apply different statistics to the grouped data to process. These include:
Mean
Median
Max
Min
Max-Min Average
Using the median allows for obtaining a measure more robust to outliers and potentially more representative of the actual central tendency of the data.
Max and Min do not express a general tendency but allow obtaining information on the highest/lowest value of the analyzed data for specific periods.
🔶 SETTINGS
Granularity: Periods used to group data.
From Data: Starting point where data starts being collected
🔹 Data
Analyze: Specific data to be processed by the seasonality widget.
SMA Length: Period of the simple moving average used for "Price - SMA" and "Volume - SMA" options in "Analyze".
Statistic: Statistic applied to the grouped data.
🔹 Filter
Filter Granularity: Period type to exclude in the processed data.
Numerical Filter Input: Determines which of the selected hour/day of week/day of month/month/year to exclude depending on the selected Filter Granularity. Only numerical inputs can be provided. Multiple values are supported and must be comma-separated.

Session TimesDescription:
This indicator simply when enabled will draw dashed lines at each of the session openings. This is based on UTC+1 Time. There will be lines at 00:00 & 08:00 (Asian Session), lines at 08:00 & 13:00 (London Session) and finally lines at 13:00 & 00:00 (New York Session).
Potential Use:
There are many ways you could use this indicator to benefit your trading, but the best way I find is that it makes it clear where the previous highs and lows are of a session, which are potential areas you could trade off. Obviously, there are many other ways you can use this to help you.
How The Script Works:
The way the script works isn't too complicated as it is only a short script. Simply it firstly calculates what are the weekdays (Whenever it isn't Saturday or Sunday). Then from there simply finds the times which I mentioned above, and adds a vertical dashed line there.
Future Updates:
In the future I will mainly be looking to make the indicator more customisable. Firstly, I will look to make it so that the user can adjust the times that the lines are drawn at so it still works wherever you are in the world. I would also like to make it so the user can choose the colour of the lines. If you have any other additions you would like added to this, then feel free to message me.
Timeframe Marker - know when timeframes start/end
When you're on a lower timeframe, it's important to know which timeframes are starting/ending.
Timeframe Marker will display a bars that stack notifying you of your chosen timeframes.
For example, if you're on the one minute chart or another low timeframe, you'll be aware of the larger timeframes are about to begin or start.
It's always good to select the lowest timeframe first in ascending order so that the lowest bar is the lowest timeframe and bars that stack on top are larger timeframes.
The default timeframes are:
• 5 minutes (green)
• 15 minutes (yellow)
• 1 hour (orange)
• 4 hour (red)
• daily (blue)
• weekly (purple)
• monthly (gray)
If your chart's timeframe is higher than the timeframe marker you've selected, then it won't display a bar stack for that timeframe as it would normally display on every bar (this is to avoid clutter).
The future timeframe marks basically will offset to future timeframes. Set how many bars forward you'd like to see.

itradesize /\ Time Cycles x Zeussy supplementaryThis is a supplementary script to my previous itradesize /\ Time Cycles x Zeussy script. It should be displayed in a new pane.
This script will display the 30 and 90 AMD Time Cycles, along with the Asia, London, and New York AM & PM sessions in a new pane, based on the times taught by Zeussy.
You have the option to customize which cycles you would like to display, as well as the arrangement of the cycles based on the location of the pane (above or below the current chart).
The script can also be used for backtesting; just uncheck the 'Draw Today's Only' option.
Session timings are as follows:
Asia: 20:00 - 00:00
London: 02:30 - 07:00
NY AM: 07:00 - 11:30
NY PM: 11:30 - 16:00
London Cycles:
- 02:30 - 04:00
- 04:00 - 05:30
- 05:30 - 07:00
AM Cycles:
- 07:00 - 08:30
- 08:30 - 10:00
- 10:00 - 11:30
PM Cycles:
- 11:30 - 13:00
- 13:00 - 14:30
- 14:30 - 16:00
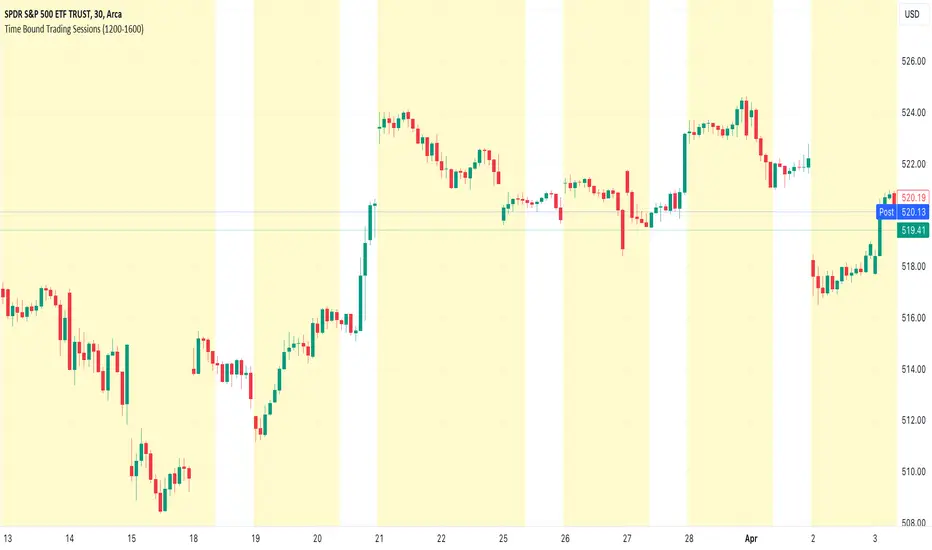
Time Bound Trading SessionsTime Bound Trading Sessions allows to add time bound conditions to your trading sessions given a date range , a time range and/or days of the week .
This indicator can be very handy if you want to control your trading sessions along those three time boundaries, applying them together and/or separately.
Feel free to reuse this code in your own strategy, and leverage the inSession condition as needed.
Features
+ It allows for date range start and/or end to be set.
+ It allows for session time range to be set.
+ It allows for days of the week to be set.
+ It applies chart background color if we are not within the given time bound session parameters.
+ It includes turn on/off functionality.
Settings
Date Range
+ {Start} checkbox: turns on/off start date
+ {Start} date/time
+ {End} checkbox: turns on/off end date
+ {End} date/time
Time Range
+ {Session} checkbox: turns on/off session time range
+ {Session} time range
Days
+ {M} checkbox: turns on/off Mondays
+ {T} checkbox: turns on/off Tuesdays
+ {W} checkbox: turns on/off Wednesdays
+ {T} checkbox: turns on/off Thursdays
+ {F} checkbox: turns on/off Fridays
+ {S} checkbox: turns on/off Saturdays
+ {S} checkbox: turns on/off Sundays
itradesize /\ Time Cycles x ZeussyI created this script based on Zeussy's & TOTK time cycle tweets.
The base 90-minute cycle starts at 2:30 AM NY time. For the best outcome, trade only during the New York AM & PM cycles. If you are a London trader, use mainly the Asian high and low instead of those 90-minute cycles as the algorithm mostly refers to them instead of the 90M cycles high or low.
In the current time cycle, we use the high and low of the previous cycle(s) to determine order flow.
During the current time cycle, IPDA refers to the previous cycle(s) as high or low. How the price reacts to these price levels is crucial for measuring order flow.
Every turning point in the market is timed and predetermined beforehand. The importance of timing can be seen by glancing at the history of the charts.
To measure order flow, we look for the following signs of reversal or continuation:
- If the price was bullish but does not find support at the previous cycle's high after breaking above it, it is the first warning sign that the order flow is potentially changing.
- If the price was bearish but does not find resistance at the previous cycle's low after breaking below it, it is the first warning sign that the order flow is potentially changing.
- If the price is bullish, then it should find support at the previous cycle's high after breaking above it.
- If the price is bearish, then it should find support at the previous cycle's low after breaking below it.
Each cycle has its Accumulation , Manipulation , and Distribution (AMD) characteristics within the larger sessions.
Even smaller cycles have these characteristics too. You can divide them further or add them up to get a more complex picture.
The indicator primarily shows the 90-minute cycles, but you can also view the multiples of 90-minute cycles to get a higher 270-minute picture. You can even divide them further into 30-minute cycles. (These 30-minute cycles can also be divided into 10-minute cycles.)
The AM sessions are from:
- 07:00 - 8:30
- 8:30 - 10:00
- 10:00 - 11:30
The PM sessions are from:
- 11:30 - 13:00
- 13:00 - 14:30
- 14:30 - 16:00
Regarding the features of the indicator, you can show the cycles as dividers or use boxes to highlight them.
The indicator also comes with a pivot high & low for the 90-minute cycles, which means the script automatically lengthens the high or low of the former 90-minute cycle until it's taken. If it has not been taken until the 90-minute cycle ends, it stops drawing.

Vertical line at 8 AMThis indicator plots a blue vertical line on the chart when it's 8 AM, providing a clear visual reference of this time point on the TradingView chart.
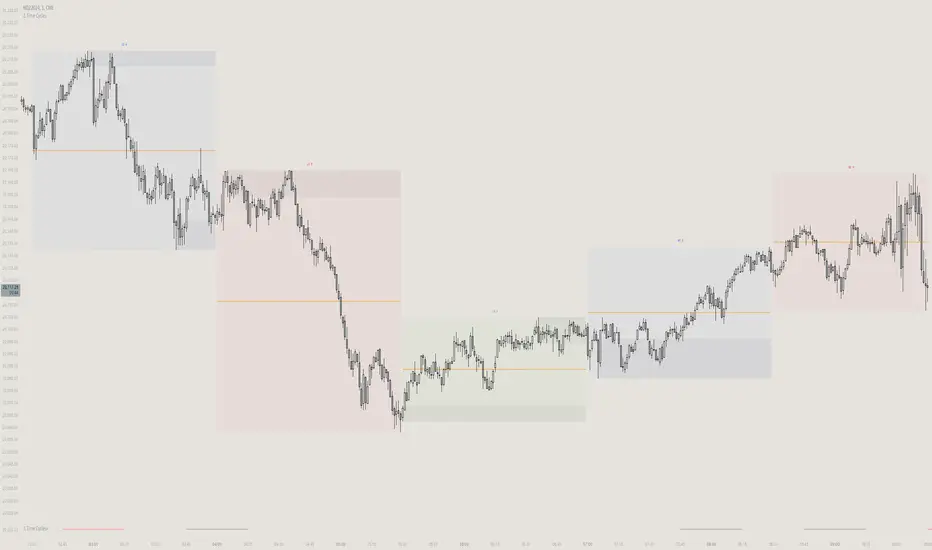
ICT Hydra MacrosThis indicator allows you to set a colored box at each time frame specified as Macro.
The purpose of this customizable color box is to be able to identify the start and end of the desired time frame, as well as the highest and lowest price during that time frame.
It also allows to place the schedule in numbers inside the box in order to quickly identify the painted time frame.
The indicator has up to 26 customizable boxes both in time frame and color. This allows to have different time frames that each Trader considers convenient for his strategy.
Settings:
General Settings:
Limit Days to Draw: Indicates the number of past days in which boxes will be drawn. Default value is 5 past days.
Timeframe Limit: Indicates the maximum time frame in which the boxes will be displayed. Default value is 5 minutes.
Timezone: Indicates the desired Timezone to calculate the schedules that will be configured later.
Macros Settings:
Show Macros Boxes: Enables or disables all boxes. It is enabled by default.
Display Text: Enables or disables all labels inside the boxes containing the time frame corresponding to the box. It is enabled by default.
Macros Transparency: Indicates the transparency percentage of the selected color for all boxes. By default it contains a value of 80% transparency.
Macro 1-26: Indicates the start time and end time, as well as the color of the individual box. Each Macro can be enabled or disabled individually. Note that the boxes of each Macro will be visible only if the "Show Macros Boxes" property is enabled. By default, there are specified certain Macros or time frames with a duration of 20 minutes, which are Manipulation or Expansion Macros that mentor Hydra has taught us based on the knowledge that ICT has provided for everyone.
The objective of this indicator is to provide a visual tool on the Macros or Time Frames in which the Trader can easily observe the desired schedule and which will automatically adjust according to the time and price on all 4 sides of the box.
