Fractal Reversal Stage 2Fractal Reversal Stage - is a high-precision trend-following and reversal indicator designed to capture market exhaustion points with mathematical accuracy. It utilizes a multi-timeframe analysis approach, combining momentum filtering with price action confirmation.
The indicator is built on a Non-Repainting Algorithm. Once a candle closes and a signal (BUY/SELL) is printed, it is fixed and will not disappear or shift. This makes it a reliable tool for both manual trading and alert-based strategies. The system includes a built-in state machine to manage trades, trailing trend lines, and a re-entry (averaging) system to optimize positions during deep pullbacks.
Main Features
Anti-Repaint Shield: Signals are confirmed only after the candle closes.
MTF Momentum Filter: Uses a higher timeframe RSI to filter out market noise.
State Machine Logic: Automatically tracks your trade from entry to exit.
Dynamic Re-entry: Provides signals to add to a position during extreme volatility.
Manual: Arguments & Settings
1. Timeframes / Таймфреймы
Working TF (Candles): The timeframe where you look for entry patterns and where the trend line is drawn.
RSI Filter TF: The timeframe for the momentum filter. Usually set higher than the Working TF to identify the global trend.
2. RSI Settings / Настройки RSI
RSI Length: The period for RSI calculation. Lower values are more sensitive; higher values are smoother.
Auto-Adjust Levels: When enabled, the script automatically tightens or loosens entry levels based on the RSI period.
Manual OB/OS Levels: Manually set the "Pale Zone" levels where the indicator starts looking for a trade.
3. Logic & Filters / Логика
Re-entry Dist (ATR Mult): Controls how far the price must move against you before an "Add" (▲/▼) signal appears. Uses ATR for volatility adjustment.
ATR Period: The lookback period for volatility calculation.
Min. Body %: A filter for candle strength. It requires the candle body to be a certain percentage of the total candle range to validate a signal.
4. Visuals / Визуал
Trend Line Width: Adjusts the thickness of the tracking line.
Colors: Customizable colors for exit dots and overbought/oversold background zones.
BUY/SELL Labels: Primary entry signals confirmed at the close of the candle.
Chevrons (▲/▼): Averaging points (Re-entry). These appear when the price moves against the initial trade into extreme zones, signaling an opportunity to optimize the position.
Black Dots: Trade Closure. These dots at the end of the trend lines mark the final exit point where the position should be fully closed.
Trend Lines: Visual tracking of the current active trade.
💡 Recommended Settings for Ethereum (ETH/USDT)
This specific configuration is optimized for the cyclical nature of Ethereum, aiming for "peak-to-peak" trade management:
Working TF: 15 min
RSI Filter TF: 2 hours
RSI Length: 10
Re-entry Dist: 1.5
ATR Period: 14
Min. Body %: 0.6
Note: Markets are diverse. You MUST adjust these settings for each specific coin or asset to account for different volatility and liquidity levels.
For questions regarding setup or optimization, please send a private message.
//______________________________________________________________________________//
Fractal Reversal Stage — это высокоточный трендовый и разворотный индикатор, разработанный для фиксации точек истощения рынка с математической точностью. Он использует мультифрактальный анализ, сочетая импульсную фильтрацию с подтверждением ценового действия.
Алгоритм индикатора не перерисовывает график. Как только свеча закрывается и появляется сигнал (BUY/SELL), он фиксируется и больше не исчезает. Это делает его надежным инструментом как для ручной торговли, так и для стратегий на основе алертов. Система включает в себя встроенную логику управления состоянием сделки, линии сопровождения тренда и систему усреднения (Re-entry).
Основные характеристики
Защита от перерисовки: Сигналы подтверждаются только после закрытия свечи.
MTF Фильтр: Использование старшего таймфрейма RSI для фильтрации рыночного шума.
Логика состояний: Автоматическое ведение сделки от входа до выхода.
Динамическое усреднение: Сигналы для добора позиции при экстремальной волатильности.
Мануал: Аргументы и Настройки
1. Timeframes / Таймфреймы
Working TF (Candles): Рабочий таймфрейм свечей, на котором ищутся паттерны и строится линия тренда.
RSI Filter TF: Таймфрейм для RSI фильтра. Обычно ставится выше рабочего для определения глобального тренда.
2. RSI Settings / Настройки RSI
RSI Length: Период расчета RSI. Меньшие значения более чувствительны, большие — более плавные.
Auto-Adjust Levels: При включении скрипт сам корректирует уровни входа в зависимости от периода RSI.
Manual OB/OS Levels: Ручная настройка уровней «бледной зоны», где начинается поиск сделки.
3. Logic & Filters / Логика
Re-entry Dist (ATR Mult): Определяет, как далеко цена должна уйти против вас, чтобы появился сигнал «Add» (▲/▼). Использует ATR для подстройки под волатильность.
ATR Period: Период усреднения волатильности.
Min. Body %: Фильтр силы свечи. Требует, чтобы тело свечи составляло определенный % от всего диапазона свечи.
4. Visuals / Визуал
Метки BUY/SELL: Основные сигналы на вход, подтвержденные закрытием свечи.
Шевроны (▲/▼): Точки для усреднения (Re-entry). Появляются, когда цена идет против сделки в экстремальные зоны, давая сигнал на добор позиции.
Чёрные точки: Закрытие сделки. Эти точки на концах линий тренда обозначают место выхода, где позиция должна быть полностью закрыта.
Линии тренда: Визуальное сопровождение активной сделки.
💡 Пример настройки для Ethereum (ETH/USDT)
Данная конфигурация оптимизирована для цикличного движения Эфира и нацелена на максимально точный выход на пиках:
Рабочий ТФ: 15 мин
ТФ Фильтра RSI: 2 часа
Период RSI: 10
Dist. Re-entry: 1.5
ATR Period: 14
Мин. тело свечи: 0.6
Важно: Рынки различаются. Вы ДОЛЖНЫ подбирать индивидуальные настройки для каждой монеты или актива, учитывая их волатильность и ликвидность.
По вопросам настройки и оптимизации пишите в личные сообщения.
Trand

MACD Enhanced [DCAUT]█ MACD Enhanced
📊 ORIGINALITY & INNOVATION
The MACD Enhanced represents a significant improvement over traditional MACD implementations. While Gerald Appel's original MACD from the 1970s was limited to exponential moving averages (EMA), this enhanced version expands algorithmic options by supporting 21 different moving average calculations for both the main MACD line and signal line independently.
This improvement addresses an important limitation of traditional MACD: the inability to adapt the indicator's mathematical foundation to different market conditions. By allowing traders to select from algorithms ranging from simple moving averages (SMA) for stability to advanced adaptive filters like Kalman Filter for noise reduction, this implementation changes MACD from a fixed-algorithm tool into a flexible instrument that can be adjusted for specific market environments and trading strategies.
The enhanced histogram visualization system uses a four-color gradient that helps communicate momentum strength and direction more clearly than traditional single-color histograms.
📐 MATHEMATICAL FOUNDATION
The core calculation maintains the proven MACD formula: Fast MA(source, fastLength) - Slow MA(source, slowLength), but extends it with algorithmic flexibility. The signal line applies the selected smoothing algorithm to the MACD line over the specified signal period, while the histogram represents the difference between MACD and signal lines.
Available Algorithms:
The implementation supports a comprehensive spectrum of technical analysis algorithms:
Basic Averages: SMA (arithmetic mean), EMA (exponential weighting), RMA (Wilder's smoothing), WMA (linear weighting)
Advanced Averages: HMA (Hull's low-lag), VWMA (volume-weighted), ALMA (Arnaud Legoux adaptive)
Mathematical Filters: LSMA (least squares regression), DEMA (double exponential), TEMA (triple exponential), ZLEMA (zero-lag exponential)
Adaptive Systems: T3 (Tillson T3), FRAMA (fractal adaptive), KAMA (Kaufman adaptive), MCGINLEY_DYNAMIC (reactive to volatility)
Signal Processing: ULTIMATE_SMOOTHER (low-pass filter), LAGUERRE_FILTER (four-pole IIR), SUPER_SMOOTHER (two-pole Butterworth), KALMAN_FILTER (state-space estimation)
Specialized: TMA (triangular moving average), LAGUERRE_BINOMIAL_FILTER (binomial smoothing)
Each algorithm responds differently to price action, allowing traders to match the indicator's behavior to market characteristics: trending markets benefit from responsive algorithms like EMA or HMA, while ranging markets require stable algorithms like SMA or RMA.
📊 COMPREHENSIVE SIGNAL ANALYSIS
Histogram Interpretation:
Positive Values: Indicate bullish momentum when MACD line exceeds signal line, suggesting upward price pressure and potential buying opportunities
Negative Values: Reflect bearish momentum when MACD line falls below signal line, indicating downward pressure and potential selling opportunities
Zero Line Crosses: MACD crossing above zero suggests transition to bullish bias, while crossing below indicates bearish bias shift
Momentum Changes: Rising histogram (regardless of positive/negative) signals accelerating momentum in the current direction, while declining histogram warns of momentum deceleration
Advanced Signal Recognition:
Divergences: Price making new highs/lows while MACD fails to confirm often precedes trend reversals
Convergence Patterns: MACD line approaching signal line suggests impending crossover and potential trade setup
Histogram Peaks: Extreme histogram values often mark momentum exhaustion points and potential reversal zones
🎯 STRATEGIC APPLICATIONS
Comprehensive Trend Confirmation Strategies:
Primary Trend Validation Protocol:
Identify primary trend direction using higher timeframe (4H or Daily) MACD position relative to zero line
Confirm trend strength by analyzing histogram progression: consistent expansion indicates strong momentum, contraction suggests weakening
Use secondary confirmation from MACD line angle: steep angles (>45°) indicate strong trends, shallow angles suggest consolidation
Validate with price structure: trending markets show consistent higher highs/higher lows (uptrend) or lower highs/lower lows (downtrend)
Entry Timing Techniques:
Pullback Entries in Uptrends: Wait for MACD histogram to decline toward zero line without crossing, then enter on histogram expansion with MACD line still above zero
Breakout Confirmations: Use MACD line crossing above zero as confirmation of upward breakouts from consolidation patterns
Continuation Signals: Look for MACD line re-acceleration (steepening angle) after brief consolidation periods as trend continuation signals
Advanced Divergence Trading Systems:
Regular Divergence Recognition:
Bullish Regular Divergence: Price creates lower lows while MACD line forms higher lows. This pattern is traditionally considered a potential upward reversal signal, but should be combined with other confirmation signals
Bearish Regular Divergence: Price makes higher highs while MACD shows lower highs. This pattern is traditionally considered a potential downward reversal signal, but trading decisions should incorporate proper risk management
Hidden Divergence Strategies:
Bullish Hidden Divergence: Price shows higher lows while MACD displays lower lows, indicating trend continuation potential. Use for adding to existing long positions during pullbacks
Bearish Hidden Divergence: Price creates lower highs while MACD forms higher highs, suggesting downtrend continuation. Optimal for adding to short positions during bear market rallies
Multi-Timeframe Coordination Framework:
Three-Timeframe Analysis Structure:
Primary Timeframe (Daily): Determine overall market bias and major trend direction. Only trade in alignment with daily MACD direction
Secondary Timeframe (4H): Identify intermediate trend changes and major entry opportunities. Use for position sizing decisions
Execution Timeframe (1H): Precise entry and exit timing. Look for MACD line crossovers that align with higher timeframe bias
Timeframe Synchronization Rules:
Daily MACD above zero + 4H MACD rising = Strong uptrend context for long positions
Daily MACD below zero + 4H MACD declining = Strong downtrend context for short positions
Conflicting signals between timeframes = Wait for alignment or use smaller position sizes
1H MACD signals only valid when aligned with both higher timeframes
Algorithm Considerations by Market Type:
Trending Markets: Responsive algorithms like EMA, HMA may be considered, but effectiveness should be tested for specific market conditions
Volatile Markets: Noise-reducing algorithms like KALMAN_FILTER, SUPER_SMOOTHER may help reduce false signals, though results vary by market
Range-Bound Markets: Stability-focused algorithms like SMA, RMA may provide smoother signals, but individual testing is required
Short Timeframes: Low-lag algorithms like ZLEMA, T3 theoretically respond faster but may also increase noise
Important Note: All algorithm choices and parameter settings should be thoroughly backtested and validated based on specific trading strategies, market conditions, and individual risk tolerance. Different market environments and trading styles may require different configuration approaches.
📋 DETAILED PARAMETER CONFIGURATION
Comprehensive Source Selection Strategy:
Price Source Analysis and Optimization:
Close Price (Default): Most commonly used, reflects final market sentiment of each period. Best for end-of-day analysis, swing trading, daily/weekly timeframes. Advantages: widely accepted standard, good for backtesting comparisons. Disadvantages: ignores intraday price action, may miss important highs/lows
HL2 (High+Low)/2: Midpoint of the trading range, reduces impact of opening gaps and closing spikes. Best for volatile markets, gap-prone assets, forex markets. Calculation impact: smoother MACD signals, reduced noise from price spikes. Optimal when asset shows frequent gaps, high volatility during specific sessions
HLC3 (High+Low+Close)/3: Weighted average emphasizing the close while including range information. Best for balanced analysis, most asset classes, medium-term trading. Mathematical effect: 33% weight to high/low, 33% to close, provides compromise between close and HL2. Use when standard close is too noisy but HL2 is too smooth
OHLC4 (Open+High+Low+Close)/4: True average of all price points, most comprehensive view. Best for complete price representation, algorithmic trading, statistical analysis. Considerations: includes opening sentiment, smoothest of all options but potentially less responsive. Optimal for markets with significant opening moves, comprehensive trend analysis
Parameter Configuration Principles:
Important Note: Different moving average algorithms have distinct mathematical characteristics and response patterns. The same parameter settings may produce vastly different results when using different algorithms. When switching algorithms, parameter settings should be re-evaluated and tested for appropriateness.
Length Parameter Considerations:
Fast Length (Default 12): Shorter periods provide faster response but may increase noise and false signals, longer periods offer more stable signals but slower response, different algorithms respond differently to the same parameters and may require adjustment
Slow Length (Default 26): Should maintain a reasonable proportional relationship with fast length, different timeframes may require different parameter configurations, algorithm characteristics influence optimal length settings
Signal Length (Default 9): Shorter lengths produce more frequent crossovers but may increase false signals, longer lengths provide better signal confirmation but slower response, should be adjusted based on trading style and chosen algorithm characteristics
Comprehensive Algorithm Selection Framework:
MACD Line Algorithm Decision Matrix:
EMA (Standard Choice): Mathematical properties: exponential weighting, recent price emphasis. Best for general use, traditional MACD behavior, backtesting compatibility. Performance characteristics: good balance of speed and smoothness, widely understood behavior
SMA (Stability Focus): Equal weighting of all periods, maximum smoothness. Best for ranging markets, noise reduction, conservative trading. Trade-offs: slower signal generation, reduced sensitivity to recent price changes
HMA (Speed Optimized): Hull Moving Average, designed for reduced lag. Best for trending markets, quick reversals, active trading. Technical advantage: square root period weighting, faster trend detection. Caution: can be more sensitive to noise
KAMA (Adaptive): Kaufman Adaptive MA, adjusts smoothing based on market efficiency. Best for varying market conditions, algorithmic trading. Mechanism: fast smoothing in trends, slow smoothing in sideways markets. Complexity: requires understanding of efficiency ratio
Signal Line Algorithm Optimization Strategies:
Matching Strategy: Use same algorithm for both MACD and signal lines. Benefits: consistent mathematical properties, predictable behavior. Best when backtesting historical strategies, maintaining traditional MACD characteristics
Contrast Strategy: Use different algorithms for optimization. Common combinations: MACD=EMA, Signal=SMA for smoother crossovers, MACD=HMA, Signal=RMA for balanced speed/stability, Advanced: MACD=KAMA, Signal=T3 for adaptive behavior with smooth signals
Market Regime Adaptation: Trending markets: both fast algorithms (EMA/HMA), Volatile markets: MACD=KALMAN_FILTER, Signal=SUPER_SMOOTHER, Range-bound: both slow algorithms (SMA/RMA)
Parameter Sensitivity Considerations:
Impact of Parameter Changes:
Length Parameter Sensitivity: Small parameter adjustments can significantly affect signal timing, while larger adjustments may fundamentally change indicator behavior characteristics
Algorithm Sensitivity: Different algorithms produce different signal characteristics. Thoroughly test the impact on your trading strategy before switching algorithms
Combined Effects: Changing multiple parameters simultaneously can create unexpected effects. Recommendation: adjust parameters one at a time and thoroughly test each change
📈 PERFORMANCE ANALYSIS & COMPETITIVE ADVANTAGES
Response Characteristics by Algorithm:
Fastest Response: ZLEMA, HMA, T3 - minimal lag but higher noise
Balanced Performance: EMA, DEMA, TEMA - good trade-off between speed and stability
Highest Stability: SMA, RMA, TMA - reduced noise but increased lag
Adaptive Behavior: KAMA, FRAMA, MCGINLEY_DYNAMIC - automatically adjust to market conditions
Noise Filtering Capabilities:
Advanced algorithms like KALMAN_FILTER and SUPER_SMOOTHER help reduce false signals compared to traditional EMA-based MACD. Noise-reducing algorithms can provide more stable signals in volatile market conditions, though results will vary based on market conditions and parameter settings.
Market Condition Adaptability:
Unlike fixed-algorithm MACD, this enhanced version allows real-time optimization. Trending markets benefit from responsive algorithms (EMA, HMA), while ranging markets perform better with stable algorithms (SMA, RMA). The ability to switch algorithms without changing indicators provides greater flexibility.
Comparative Performance vs Traditional MACD:
Algorithm Flexibility: 21 algorithms vs 1 fixed EMA
Signal Quality: Reduced false signals through noise filtering algorithms
Market Adaptability: Optimizable for any market condition vs fixed behavior
Customization Options: Independent algorithm selection for MACD and signal lines vs forced matching
Professional Features: Advanced color coding, multiple alert conditions, comprehensive parameter control
USAGE NOTES
This indicator is designed for technical analysis and educational purposes. Like all technical indicators, it has limitations and should not be used as the sole basis for trading decisions. Algorithm performance varies with market conditions, and past characteristics do not guarantee future results. Always combine with proper risk management and thorough strategy testing.

Adaptive Trend Flow [QuantAlgo]Adaptive Trend Flow 📈🌊
The Adaptive Trend Flow by QuantAlgo is a sophisticated technical indicator that harnesses the power of volatility-adjusted EMAs to navigate market trends with precision. By seamlessly integrating a dynamic dual-EMA system with adaptive volatility bands, this premium tool enables traders and investors to identify and capitalize on sustained market moves while effectively filtering out noise. The indicator's unique approach to trend detection combines classical technical analysis with modern adaptive techniques, providing traders and investors with clear, actionable signals across various market conditions and asset class.
💫 Indicator Architecture
The Adaptive Trend Flow provides a sophisticated framework for assessing market trends through a harmonious blend of EMA dynamics and volatility-based boundary calculations. Unlike traditional moving average systems that use fixed parameters, this indicator incorporates smart volatility measurements to automatically adjust its sensitivity to market conditions. The core algorithm employs a dual EMA system combined with standard deviation-based volatility bands, creating a self-adjusting mechanism that expands and contracts based on market volatility. This adaptive approach allows the indicator to maintain its effectiveness across different market phases - from ranging to trending conditions. The volatility-adjusted bands act as dynamic support and resistance levels, while the gradient visualization system provides instant visual feedback on trend strength and duration.
📊 Technical Composition and Calculation
The Adaptive Trend Flow is composed of several technical components that create a dynamic trending system:
Dual EMA System: Utilizes fast and slow EMAs for primary trend detection
Volatility Integration: Computes and smooths volatility for adaptive band calculation
Dynamic Band Generation: Creates volatility-adjusted boundaries for trend validation
Gradient Visualization: Provides progressive visual feedback on trend strength
📈 Key Indicators and Features
The Adaptive Trend Flow utilizes customizable length parameters for both EMAs and volatility calculations to adapt to different trading styles. The trend detection component evaluates price action relative to the dynamic bands to validate signals and identify potential reversals.
The indicator incorporates multi-layered visualization with:
Color-coded basis and trend lines (bullish/bearish)
Adaptive volatility-based bands
Progressive gradient background for trend duration
Clear trend reversal signals (𝑳/𝑺)
Smooth fills between key levels
Programmable alerts for trend changes
⚡️ Practical Applications and Examples
✅ Add the Indicator: Add the indicator to your TradingView chart by clicking on the star icon to add it to your favorites ⭐️
👀 Monitor Trends: Watch the basis line and trend band interactions to identify trend direction and strength. The gradient background intensity indicates trend duration and conviction.
🎯 Track Signals: Pay attention to the trend reversal markers that appear on the chart:
→ Long signals (𝑳) appear when price action confirms a bullish trend reversal
→ Short signals (𝑺) indicate validated bearish trend reversals
🔔 Set Alerts: Configure alerts for trend changes in both bullish and bearish directions, ensuring you never miss significant technical developments.
🌟 Summary and Tips
The Adaptive Trend Flow by QuantAlgo is a sophisticated technical tool designed to support trend-following strategies across different market environments and asset class. By combining dual EMA analysis with volatility-adjusted bands, it helps traders and investors identify significant trend changes while filtering out market noise, providing validated signals. The tool's adaptability through customizable EMA lengths, volatility smoothing, and sensitivity settings makes it suitable for various trading timeframes and styles, allowing users to capture trending opportunities while maintaining protection against false signals.
Key parameters to optimize for your trading and/or investing style:
Main Length: Adjust for more or less sensitivity to trend changes (default: 10)
Smoothing Length: Fine-tune volatility calculations for signal stability (default: 14)
Sensitivity: Balance band width for trend validation (default: 2.0)
Visual Settings: Customize appearance with color and display options
The Adaptive Trend Flow is particularly effective for:
Identifying sustained market trends
Detecting trend reversals with confirmation
Measuring trend strength and duration
Filtering out market noise and false signals
Remember to:
Allow the indicator to validate trend changes before taking action
Use the gradient background to gauge trend strength
Combine with volume analysis for additional confirmation
Consider multiple timeframes for a complete market view
Adjust sensitivity based on market volatility conditions

EMA Slope - ValenteThis indicator will show you the EMA SLOPE as a HISTOGRAM.
Este indicador mostra a INCLINACAO da EMA como um HISTOGRAMA

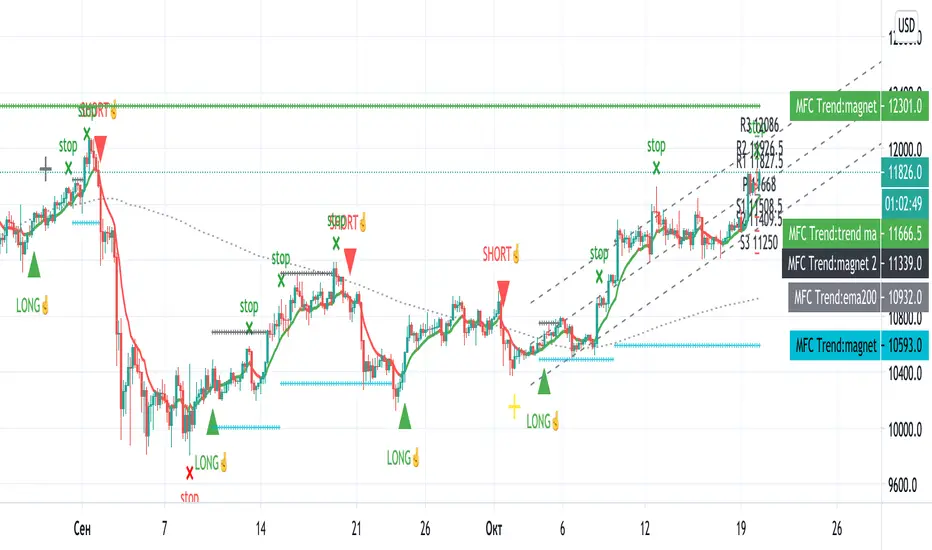
MFCTrade TREND v5 only 4 h The main trend indicator.
Suitable for 1H-1D, on any exchange and on any coin, currency pair, index.
There are basic settings that allow you to adjust the indicator individually for each situation.