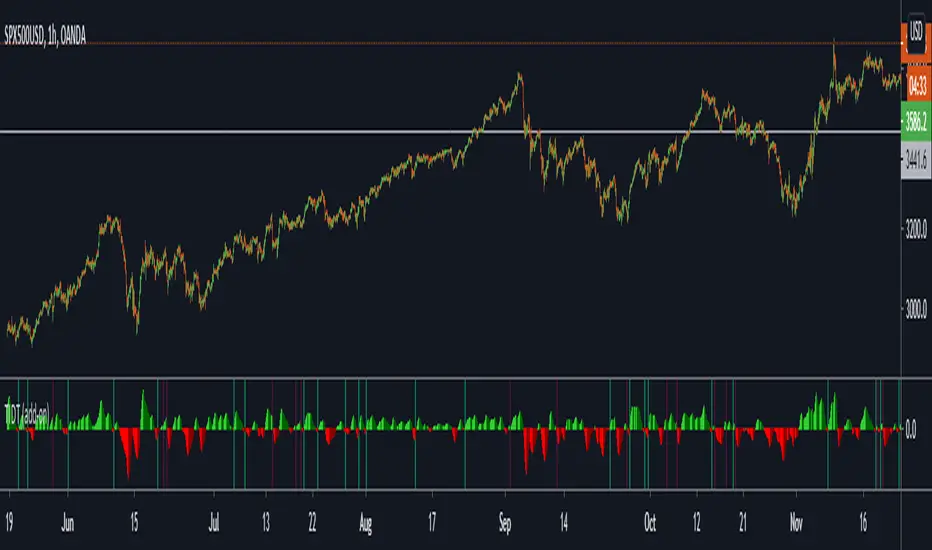
RP trend readerThis tool is a momentum reader
You can use this tools at any timeframe
When the momentum is meet the condition then it will show the signal
The signal are "Buy" and "Sell"
Buy means that you Long or exit your Short at the price
Sell means that you Short or exit your Long at the price
There's pivot line at there
Pivot line is showing how strong the momentum right now
If the price above or way above the pivot line then the uptrend is strong (very bullish)
If the price below or way below the pivot line then the downtrend is strong (very bearish)
Don't blindly Buy or Sell just because the signal is coming out
Combine it with the market structure, look at the big picture instead lower TF and the edge is yours
The best entry is when the price bounce close to the pivot point
Be carefull with the sideway or choppy market. You can see that the price is going up and down at the pivot line and the signals come out quite often
Follow your trading plan, be patience (don't FOMO) and be discipline with your plan... Cheers...
Trendfollowing
FEJ - DogeMarginFEJ - DogeMargin ist ein All-in-One Indikator.
Mit dem ihr euch praktisch das Upgrade auf eine bezahlte Tradingview Version sparen könnt.
- Wave-Detector: Bestehend aus einem innovativen Wave-Trenddetector mit dessen hilfe es sehr leicht ist einen Trendwechsel und die vorraussichtliche Stärke des kommenden Moves zu erkennen.
- NMA: Eine dynamische Trendlinie um die stärke der Signale zu überprüfen.
- Channel: Um potenzielle Trendwenden bzw. Überkaufte oder Überverkaufte Situationen zu erkennen.
- Golden- & Deathcross: SMA basierende Crosses um potenzielle Trendwendepunkte zu erkennen und bestehende Signale zu überprüfen. Die SMA Crosses sind in einem festgelegten Timeframe, welcher sich in den Einstellungen anpassen lässt. Die SMA´s sind optional einblendbar. In einem Update folgen noch MACD Crosses.
- Volume Candles: Dieser passt die Farbe der Candles entsprechend dem aktuellen Volumen und dessen Richtung an.
Dunkel Violett - Der Preis sinkt und das Volumen ist größer als 200% des Durchschnitts der letzten 20 Tage - Stark Bearish
Violett - Der Preis sinkt und das Volumen ist zwischen 50% und 200% des Durchschnitts der letzten 20 Tage - Volumen ist weder stark noch schwach
Helles Violett - Der Preis sinkt und das Volumen ist geringer 50% des Durchschnitts der letzten 20 Tage - Wenig Support für die aktuellen Preisbewegungen.
Aqua - Der Preis steigt und das Volumen ist größer als 200% des Durchschnitts der letzten 20 Tage - Stark Bullish
Blau - Der Preis steigt und das Volumen ist zwischen 50% und 200% des Durchschnitts der letzten 20 Tage - Volumen ist weder stark noch schwach
Helles Blau - Der Preis steigt und das Volumen ist geringer 50% des Durchschnitts der letzten 20 Tage - Wenig Support für die aktuellen Preisbewegungen.
- S & R Lines: Dieser Indikator zeigt die für diesen Timeframe aktuellen Support und Resistance Linien an.
- EMA Ribbons: Dieser Indikator zeigt ein Ribbon für den aktuellen Timeframe an.
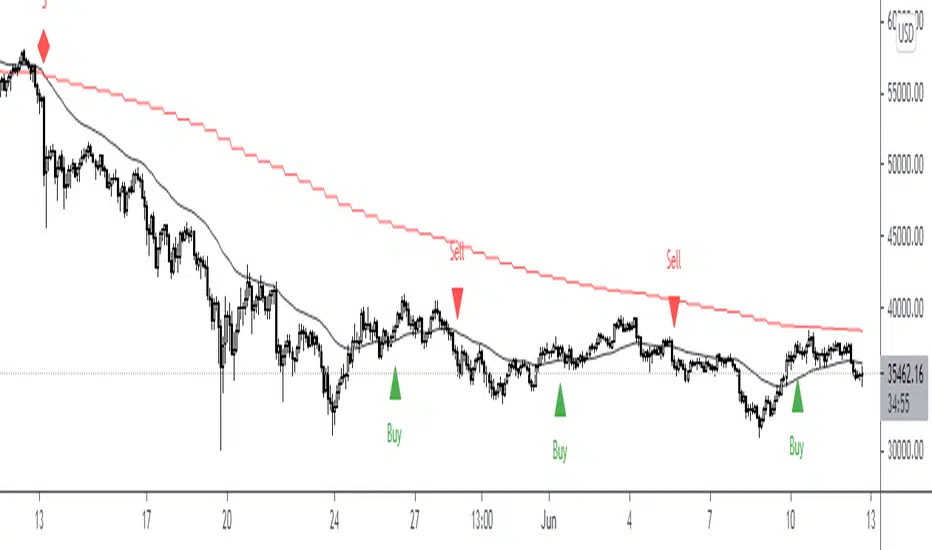
Wave
Mit Hilfe der Welle in der Mitte lassen sich Trendwenden erkennen.Die Trendwende ist besonders stark, wenn das Signal bei einem Bull-Signal unterhalb der gelben NMA-Line liegt ; bei einem Bear-Signaloberhalb der gelben NMA-Linie liegt.
Wenn Kurs in folge eines Signals nach der NMA schließt, deutet das auf einen Trendwechsel hin. Bis dahin
Mit hilfe des Dogeprotocol lassen sich diese Signale noch weiter verbessern undgegenprüfen
Channel
NMA
Golden- & Deathcross
Zeigt an wo sich entweder ein SMA Golden- oder Death-Cross befindet
WICHTIG: Der TimeFrame für die Crosses ist festgelegt - Standardmäßig auf 4h (240m)
Es macht am meisten Sinn, den TF auf 1/10 deines Beobachtungszeitramens zu stellen.
2x SMA´s
Volume Candles
S & R Lines
EMA Ribbos
____________________________________________________________________________________________________________________________
English:
FEJ - DogeMargin is an all-in-one indicator.
With which you practically do that Upgrading to a paid Tradingview version can save you money.
- Wave detector: Consists of an innovative wave trend detector with its help it is very easy to change the trend and the anticipated Recognize the strength of the upcoming move.
- NMA: A dynamic trend line to check the strength of the signals.
- Channel: Around potential trend reversals or overbought or oversold situations to recognize.
- Golden & Death cross: SMA based crosses around potential trend turning points to recognize and to check existing signals. The SMA Crosses are in a fixed timeframe, which can be found in the settings can be adjusted. The SMAs can optionally be faded in. MACD Crosses will follow in an update.
- Volume Candles: This adjusts the color of the candles according to the current volume and its direction.
Dark Purple - The price is falling and the volume is greater than 200% of the Last 20 Day Average - Strongly Bearish
Purple - The price is going down and the volume is between 50% and 200% of the Last 20 days average - volume is neither strong nor weak
Light purple - the price goes down and the volume is less than 50% of the Average of the last 20 days - Little support for the current ones Price movements.
Aqua - The price goes up and the volume is greater than 200% of the Last 20 days average - Strong Bullish
Blue - The price is increasing and the volume is between 50% and 200% of the Last 20 days average - volume is neither strong nor weak
Light blue - the price goes up and the volume is less 50% of the Average of the last 20 days - Little support for the current ones Price movements.
- S & R Lines: This indicator shows the current support and for this timeframe
Resistance lines on.
- EMA Ribbons: This indicator shows a ribbon for the current timeframe.
Wave
Trend reversals can be seen with the help of the wave in the middle.
The turnaround is particularly strong when the signal is at one
Bull signal is below the yellow NMA line; on a bear signal is above the yellow NMA line.
If course closes on a signal after the NMA , it indicates one
Change of trend. Until then
With the help of the Dogeprotocol, these signals can be improved even further
double check
Channel
NMA
Golden & Death Cross
Shows where either a SMA golden or death cross is located
IMPORTANT: The timeframe für crosses is fixed - by default to 4h (240m)
It makes the most sense to set the TF to 1/10 of your observation timeframe.
2x SMAs
Volume candles
S&R Lines
EMA Ribbos

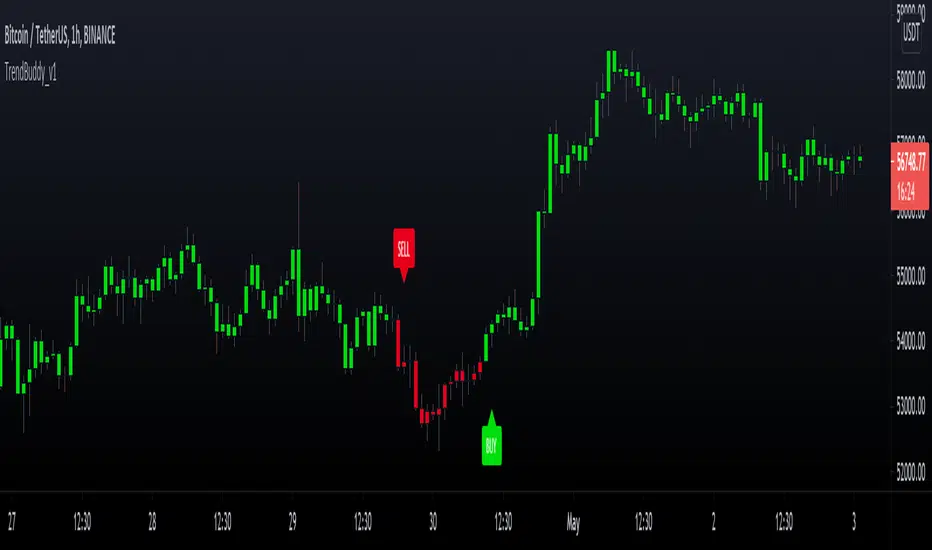
TrendBuddy_v1TrendBuddy is a trend signal generator indicator.
options:
control sensitivity of the signals
Sideways Market Detector
Filter signals based on Side Market
Indicator is based on combination of oscillators, moving averages, bollinger bands and price action.
The traders can use this tool to get trends when market is about to come out of choppy regions.
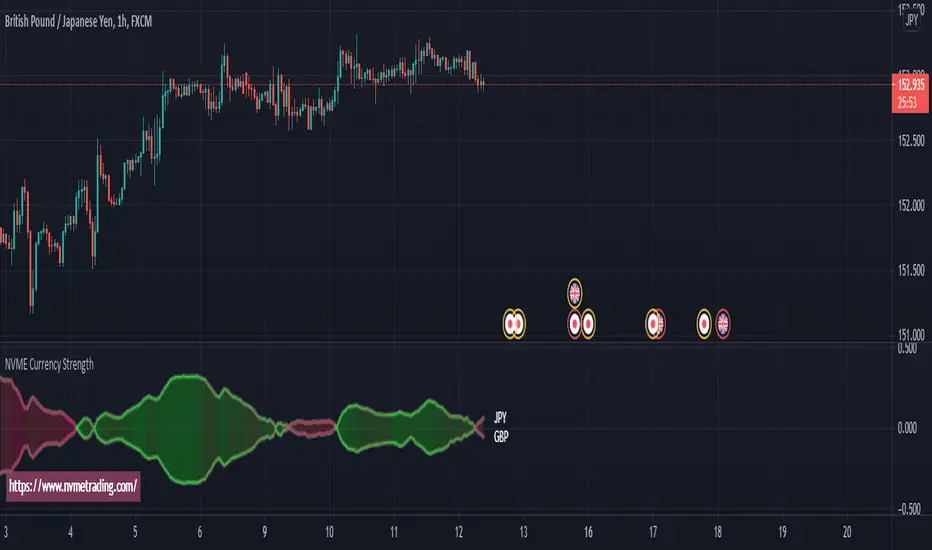
NVME Currency Strength ProNVME Currency Strength Pro was made to help confirm the trends, to help stay in winning positions longer and to help you get out of losing trades sooner. So why is ours unique? The answer is simple, unlike other currency strength indicators, ours loads in 2 seconds rather than 15 seconds or longer, which will cause less frustration when changing settings. Also, we have done a different approach to the usual line base for the currency strengths, with ours we have made implemented it with our module and used the data provided to create a price following bubble and oscillator that shows you what is in an uptrend or a downtrend. There are multiple options for you to customise and it is really easy to use and understand.
The steps to follow for using this indicator since data will be inputted manually:
1) Goto settings and change pair id 's input to the pair that you are currently analysing.
2) Change pair id 's input to a pair that begins with the ending of the first pair, for example 1st pair is EURUSD so 2nd pair would be any USD pair.
3) Play around with the calculation module pre-sets and the length settings to find what you like the look off.
4) Enjoy :)
NVME Currency Strength Pro works well with NVME Vanquisher X Algorithm and NVME Oscillator X.
RSI Trend Indicator [paRSI]The Relative Strength Index ( RSI ) is a measurement used by traders to assess the price momentum. It is scaled from 0 to 100. when RSI reads below 30, it is usually interpreted as oversold and when RSI is above 70 it is usually interpreted as overbought. However, it is usually not profitable to trade based on overbought and oversold signal.
RSI Trend Indicator or as I like to call it "paRSI" ("Parsa (my name) + RSI") shows that when RSI is above a specific number (default value = 60) it indicates bullish trend and when RSI is below a specific number (default value = 40 ) it indicates bearish trend. Lastly when RSI is below the 2 specified numbers it indicates a neutral trend.
I don't recommend trading based on this single indicator. If you're a trend trader this might be useful tool in addition to your own strategy
Usage:
If the created pattern has worked previously on the chart, you could enter on the first stages of the green or red section (depending on the market's trend).
It is not recommended to trade in any direction when there is no color
*THIS IS A TREND FOLLOWING STRATEGY AND DOES NOT WORK ON ALL MARKETS*

Rosebud Trend [DepthHouse]Rosebud Trend Indicator uses complex range calculations to easily detect trend changes, critical support and resistance levels, and even aid in spotting reversals. The Critical Support & Resistance Zones are plotted via the red and green cloud. This cloud not only visually displays the expected trend direction but often acts as major support and resistance zones. The outer band measures the expected range in which the assets trades within over longer periods of time.
Users can switch the ‘Trend Sensitivity’ between ‘Low’ and ‘High’ to increase or decrease the rate at which the cloud changes.
By altering the S/R Band Thickness users can furthermore increase or decrease the rate at which a trend changes by altering the thickness of the cloud. I prefer to keep these settings at 0.55 , 0.382, or 0.236.
The bar colors are generated by a combination of Rosebuds primary function and our ATR AUTO Oscillator base functions. Users have 3 bar color options to select from: Simple, Complex, and Off .
Simple: Bars colors alternate between shades of red and green based on the trend direction and the ATR Auto strength. Stronger the shade, the stronger the trend.
Complex: This adds a few extra variables to the script which generates a more complex bar color display. Using this option, Rosebud will generate light red bars in a bull trend if downward movement is strong and vice versa in a bear trend. It also will generate a purple bar if the candle successfully closes above or below the Top & Bottom Range Bands; We call this a range break , and it could be an early sign of strong upward or downward movement.
Off: In case you like to keep things even simpler, this option hides all overlay bar colors.
Sample of Complex Bar Colors:
Bull, Bear signals along with Up and Down arrows are too based on a combination of our trend direction and ATR Auto Oscillator calculations.
Users have the option to adjust both bar color, and shape generation settings via:
Smoothed Signal Option: Turns advance smoothing on or off. On will reduce signal noise, while Off could land you that perfect bottom signal with a lower success rate.
Candlestick Length: Default factor for bar color and shape generation, higher the number the fewer signals that will generate.
Candlestick Smoothing: Default smoothing for the Candlestick Length
Signal Lookback: Adjust the factor at which Bull, Bear, Up, and Down. Lower this to 2 for more signals.
Cross Thresholds: The lower this number the easier it is for ‘Bull’, ‘Bear’, and over extended signals to generate; see image below:
*Users also have the option to hide all signal visuals via the 'Shapes' On/Off option.
Users have multiple built in Alerts to choose from:
Bullish Trend Change: When the critical cloud switches to Bullish
Bearish Trend Change: When the critical cloud switches to Bearish
Upper Range Break: When the price action closes above the Range Top
Lower Range Break: When the price action closes below the Range Bottom
Light Bullish Cross: Early bullish signal; also displayed by up arrows by default
Light Bearish Cross: Early bear signal: also displayed by down arrows by default
Verified Bullish Cross: Occurs when a Bull signal is generated.
Verified Bearish Cross: Occurs when a Bear signal is generated.
*Past performance is no guarantee of future results*

Support Resistance ChannelsHello All,
For Long time I was planning to make Support/Resistance Channels script, finally I had time and here it is.
How this script works?
- it finds and keeps Pivot Points
- when it found a new Pivot Point it clears older S/R channels then;
- for each pivot point it searches all pivot points in its own channel with dynamic width
- while creating the S/R channel it calculates its strength
- then sorts all S/R channels by strength
- it shows the strongest S/R channels, before doing this it checks old location in the list and adjust them for better visibility
- if any S/R channel was broken on last move then it gives alert and put shape below/above the candle
- The colors of the S/R channels are adjusted automatically
You can set/change following settings:
- Pivot Period
- Source : High/Low or Close/Open can be used
- Maximum Channel Width %: this is the maximum channel width rate, this is calculated using Highest/Lowest levels in last 300 bars
- Number of S/R to show : this is the number of Strongest S/R to show
- Loopback Period: While calculating S/R levels it checks Pivot Points in LoopBack Period
- Show S/R on last # Bars: To see S/R levels only on last N bars
- Start Date: the script starts calculating Pivot Point from this date, the reason I put this option is for visuality. Explained below
- You can set colors/transparency
- and You can enable/disable shapes for broken S/R levels
Examples:
You can change colors as you wish:
here " Show S/R on last # Bars " set 100:
Sometimes visuality may corrupt because of old S/R levels, to solve it you need to set "Start Date" in the options to start the script in visual part (last 292 bars)
here in first screenshot it doesn't look good (shrink), then on second screenshot I set the "Start Date" it looks better, if you change time frame don't forget to set it again :)
Enjoy!

Robust Channel [tbiktag]Introducing the Robust Channel indicator.
This indicator is based on a remarkable property of robust statistics , namely, the resistance to the presence of data points that deviate significantly from the established trend (generally speaking, outliers ). Being outlier-resistant, the Robust Channel indicator “remembers” a pre-existing trend and thus exhibits a very peculiar "lag" in case of a sharp price change. This allows high-confidence identification of such price actions as a trend reversal, range break, pullback, etc.
In the case of trending and range-bound market conditions, the price remains within the channel most of the time, fluctuating around the central line.
Technical details
The central line is calculated using the repeated median slope algorithm. For each data point in a lookback window of a user-specified Length , this method calculates the median slope of the lines that connect that point to all other points inside the window. The overall median of these median slopes is then calculated and used as an estimate of the trend slope. The algorithm is very efficient as it uses an on-the-fly procedure to update the array containing the slopes (new data pushed - old data removed).
The outer line is then calculated as the central line plus the Length -period standard deviation of the price data multiplied by a user-defined Channel Width Factor . The inner line is defined analogously below the central line.
Usage
As a stand-alone indicator, the Robust Channel can be applied similarly to the Bollinger Bands and the Keltner Channel:
A close above the outer line can be interpreted as a bullish signal and a close below the inner line as a bearish signal.
Likewise, a return to the channel from below after a break may serve as a bullish signal, while a return from above may indicate bearish sentiment.
Robust Channel can be also used to confirm chart patterns such as double tops and double bottoms.
If you like this indicator, feel free to leave your feedback in the comments below!

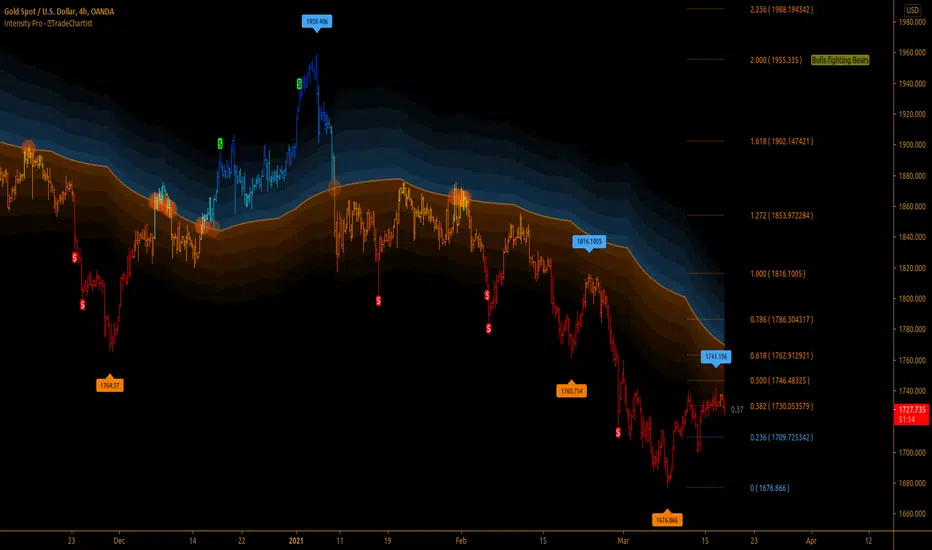
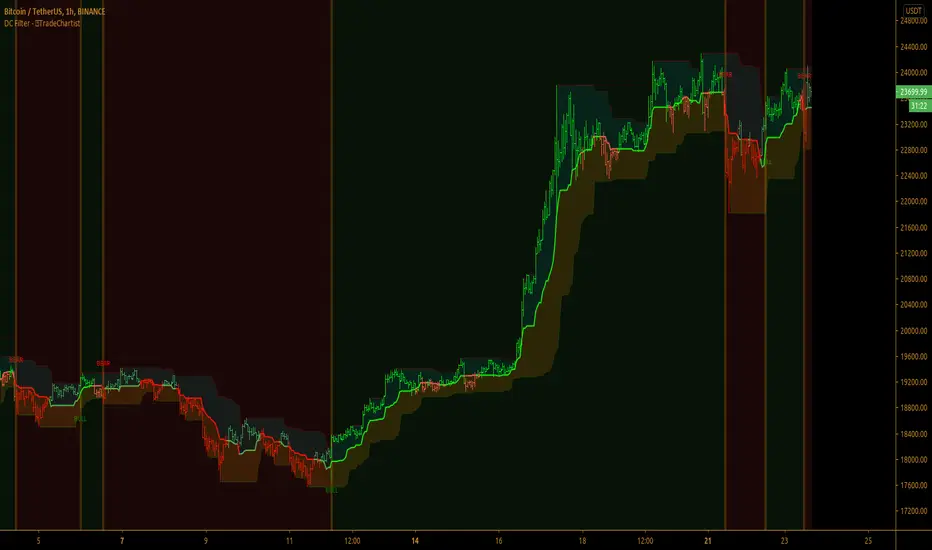
TradeChartist Intensity Pro™TradeChartist Intensity Pro is a visual indicator that comes with 5 Visual Themes and Auto-fibs feature that helps traders with Entry/Exit and levels confirmation based on where the price is, in relation to the Orange Price Equilibrium line and the 5 zones of Bull/Bear limits that fade into the top or bottom outer space.
™TradeChartist Intensity is an original Mean Reversion Model that requires no user input and Intensity Pro incorporates User adjustable Auto-Fibs and manual Fibonacci retracement feature and plots customisable Fib levels along with prices.
======================================================================================
Intensity Pro Features
Orange Mean Equilibrium Line
Bull and Bear Intensity Bands
5 Visual Themes
Trend based Bar Colours
Auto Fibonacci Levels
Custom Auto-Fib Levels
Fibonacci Levels based on Days or Bars Lookback
Current Fib Level label
High and Low Plots
Take Profit Bars
======================================================================================
Example Charts:
1. 4hr BTC-USDT
2. SPX Daily
3. EUR-USD 1hr
======================================================================================
Best Practice: Test with different settings first using Paper Trades before trading with real money
======================================================================================
This is not a free to use indicator. Get in touch with me (PM me directly if you would like trial access to test the indicator)
Premium Scripts - Trial access and Information
Trial access offered on all Premium scripts.
PM me directly to request trial access to the scripts or for more information.
======================================================================================
SSI.FX Global AlgoVersion 1
The SSI.FX Global Algo uses a very fine tune trend filter that helps eliminate the noise of the market
This is a trend following indicator based off a moving average, but this is a exceptionally calculated Non-Repainting/Zero Lag moving average that allows you to enter the market with a mathematically calculated; high probability certainty. This indicator can be modified to the users liking, this is still early stages of the release so things will change over time.
Again, this is a trend following indicator this will not get sniper entries, even though a high amount of the time it may seem like that. Just like any indicator I always suggest using it for confluence to your trend bias.
How To Use
Blue Moving Average = Bullish
Red Moving Average = Bearish
I personally take a Macro and Micro trend approach. Look for trend flips and trends on higher time frames like the 1H, 4H, 1D, 1W then go to a lower time frame to take the micro trades of that prevailing trend. I generally look at 2 to 3 time frame segments lower than my higher time frame bias
example: 4H trend bias, I'd be looking at the 30m or 15m for potential trade entries
Pairs to Trade
Currencies, Stocks, Commodities, Metals, Energy, Bitcoin, Alt Coins.
Alert System
I did build an alert system that you can set to notify you when ever there is a new Long or Short Signal.
Development Roadmap
Multi-Time Frame Settings/Plotting
Better GUI
Trade Types: Basic Trades, Smart Trades
Big thanks to all the people who have helped in the development of this project!
Please leave feedback and any suggestions on what you'd like to see happen with this project!

Buy The Retrace studyA trend-following strategy entering pullbacks
Simple but efficient
The components of the script:
-MTF ATR based Trend
-Fib based cloud to help determine the trend
-Oscillator which is based on the current close relative to the close-only high-low range over a given period of time
The signal frequency can be changed on:
- Period - Length of the period to look for - i.e 25 means, the last 25 candles
- Bullline - signals created if oscillator above this level
- Bearline - signals created if oscillator below this level
I'd recommend taking the first few signals once the trend has changed.
Alerts are available as:
- First long / short signal
- Long / short signal
- Take profit long / short signal
- HTF trend change any direction
- HTF trend change up / down
Does not repaint - however, wait for a candle to close before entering a signal.

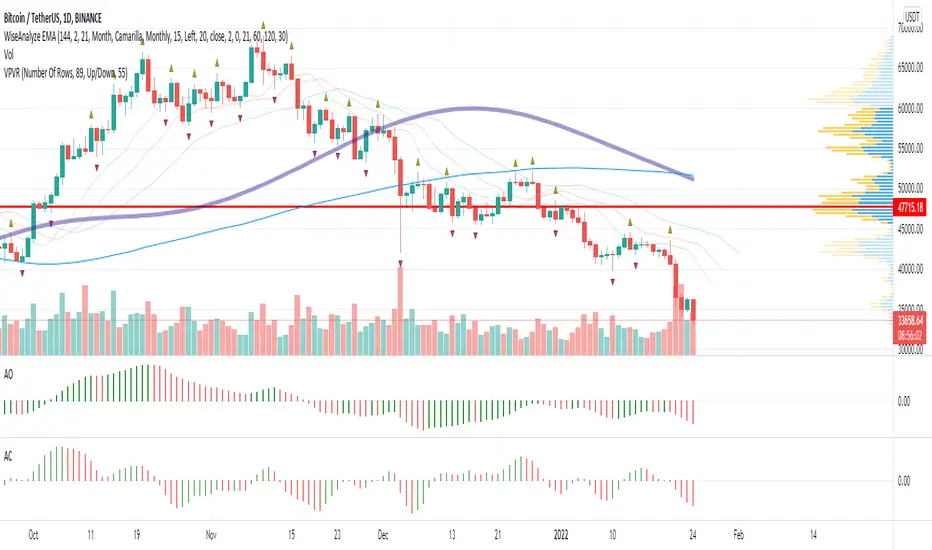
WiseAnalyze EMA + fractalsCombination of exponential moving averages allow to spot the trend reversal and expansion, Bill Williams fractals and support resistance zones allow to trade without drawing anything. Just follow the trend.
Study your chart. Note which EMA act as support and bounce most of tests. Most often I use 21/34 EMA for new entries.
Most powerful trend indicator is MAWV. Don't try to trade against it. If price above go long. If below - short.
Stops should be placed behind fractals. Breakout entries on price crossing fractals.
EMA 3/5/10/20/50/100/200Trend follow the fastest moving stocks with the right EMAs to trail your stops.

[astropark] Trend Skywalker V1 [alarms]Dear Followers,
today another awesome Swing and Scalping Trading Strategy indicator: Trend Skywalker !
It shows a trend cloud that reacts very fast to price action, so it's perfect for trending markets: it helps a lot to find out
when a trend is going to end and a new is going to start
when to enter again within a trending market
where to put your stoploss
In this example below you can see the three points above:
In fact in a trending market it will highlight that:
price consolidation within the could is a trend weakening signal , so you can easily spot when a trend is going to end and a new is going to start
bullish/bearish trend cloud retests are nice opportunity to re-enter within a trending market, especially if cloud is thick
where to put your stoploss ( below the cloud and/or recent low in a buy scenario , above the cloud and/or recent high in a sell scenario )
This strategy/indicator has the following options:
change analysis window (the lower, the more reactive; the higher, the less reactive)
enable/disable signals on chart
enable/disable "more confirmations" signals filter
enable/disable bars and background coloring based on trend
enable/disable an automatic Trailing Stop strategy option (Automatic Stops)
enable/disable a peak profit tracker (the max percentage profit labels)
enable/disable highlights of trend cloud retests
enable/disable highlights of trend cloud price breakouts
Here below some examples how the indicator works on many markets and timeframe.
ETH/USD 4h
EUR/USD 15m
LTC/BTC 1h
This strategy only trigger 1 buy (where to start a long trade) or 1 sell (for short trade).
Keep in mind that proper risk management and money management strategies are very important to manage your trades (DM me if you need any clarification on these points).
This script will let you set all notifications you may need in order to be alerted on each triggered signals.
The one for backtesting purpose can be found by searching for the astropark's "Trend Skywalker" and then choosing the indicator with "strategy" suffix in the name, or you can find here below:
This is a premium indicator , so send me a private message in order to get access to this script.

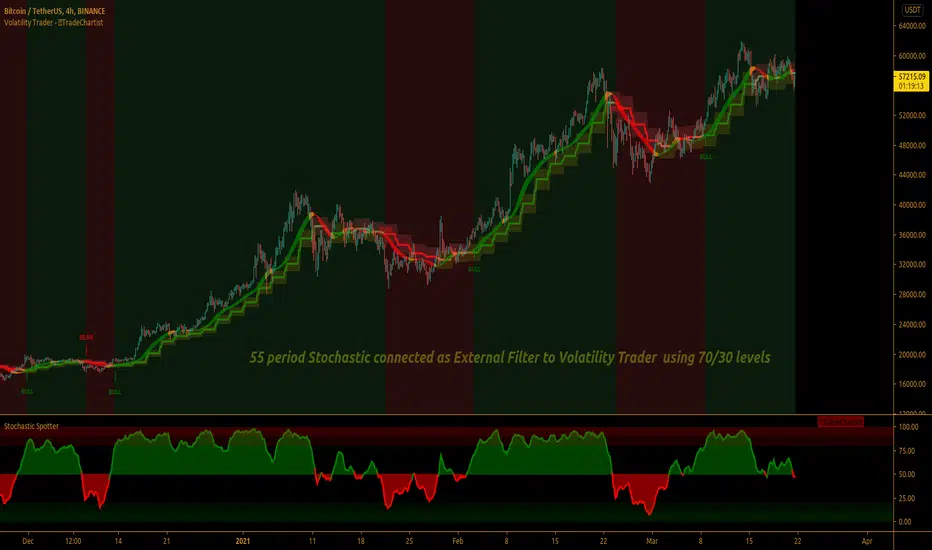
TradeChartist Volatility Trader ™TradeChartist Volatility Trader is a Price Volatility based Trend indicator that uses simple to visualize Volatility steps and a Volatility Ribbon to trade volatility breakouts and price action based on lookback length.
===================================================================================================================
Features of ™TradeChartist Volatility Trader
======================================
The Volatility steps consists of an Upper band, a Lower band and a Mean price line that are used for detecting the breakouts and also used in plotting the Volatility Ribbon based on the price action. The Mean Line is colour coded based on Bull/Bear Volatility and exhaustion based on Price action trend.
In addition to the system of Volatility Steps and Volatility Ribbon, ™TradeChartist Volatility Trader also plots Bull and Bear zones based on high probability volatility breakouts and divides the chart into Bull and Bear trade zones.
Use of External Filter is also possible by connecting an Oscillatory (like RSI, MACD, Stoch or any Oscillator) or a non-Oscillatory (Moving Average, Supertrend, any price scale based plots) Signal to confirm the Bull and Bear Trade zones. When the indicator detects the Volatility breakouts, it also checks if the connected external signal agrees with the trend before generating the Bull/Bear entries and plotting the trade zones.
Alerts can be created for Long and Short entries using Once per bar close .
===================================================================================================================
Note:
Higher the lookback length, higher the Risk/Reward from the trade zones.
This indicator does not repaint , but on the alert creation, a potential repaint warning would appear as the script uses security function. Users need not worry as this is normal on scripts that employs security functions. For trust and confidence using the indicator, users can do bar replay to check the plots/trade entries time stamps to make sure the plots and entries stay in the same place.
™TradeChartist Volatility Trader can be connected to ™TradeChartist Plug and Trade to generate Trade Entries, Targets etc by connecting Volatility Trader's Trend Identifier as Oscillatory Signal to Plug and Trade.
===================================================================================================================
Best Practice: Test with different settings first using Paper Trades before trading with real money
===================================================================================================================
This is not a free to use indicator. Get in touch with me (PM me directly if you would like trial access to test the indicator)
Premium Scripts - Trial access and Information
Trial access offered on all Premium scripts.
PM me directly to request trial access to the scripts or for more information.
===================================================================================================================
V3 - LFT PROGRAM BY ALGOZThis is an Updation to our LFT PROGRAM V2. We have corrected some bugs like multiple order triggers.
We have introduced system to take continuation signal from yesterday which was missing in the V2. we will be using Once per bar, instead of Once per bar close. The rest all are same and the description of the Algo is given below
This strategy takes trades based on swing high and swing low. When ever a swing high is made and a momentum follow thru is there trade will be taken. By doing this we can exit early same time we would be able to enter a trade early. some time when minor swing highs and lows are there we avoid using a filter. Only Major swing highs and lows are taken.
While Traditional Trend following systems has drawbacks like Late entry and Delayed Exit, this program is designed to enter as early as possible with the support of momentum and swing high and exit also happens the same way. for new signal it should come with momentum. This program will take multiple entries as the sensitivity is to set to high. So it can be used on any instruments.
This is tuned for intraday. Users can modify input for market closing time. The default is set to close at 15:20 considering Indian NSE market. If you want to trade commodity then change the closing time respectively. Only factor to consider is that the minutes should be round number matched to the time frame. if its 5 min it should be divisible by 5 , if you are applying on 3 min, the minutes should be divisible by 3.
You can request Access using my Default signature below or through trading view chat box.
All the Best !!!

PRIO Trend FollowingWith this indicator you can generate automatic BUY-SELL signal on your chart and trade with an ease. This is a trend following indicator based on HIGH-LOW ema channel. You can choose ema period from the input menu on settings, and add to your favourite time frame.

Divergence for Many Indicators v4Hello Traders,
Here is my new year gift for the community, Digergence for Many Indicators v4 . I tried to make it modular and readable as much as I can. Thanks to Pine Team for improving Pine Platform all the time!
How it works?
- On each candle it checks divergences between current and any of last 16 Pivot Points for the indicators.
- it search divergence on choisen indicators => RSI , MACD , MACD Histogram, Stochastic , CCI , Momentum, OBV, VWMACD, CMF and any External Indicator !
- it checks following divergences for 16 pivot points that is in last 100 bars for each Indicator.
--> Regular Positive Digergences
--> Regular Negative Digergences
--> Hidden Positive Digergences
--> Hidden Negative Digergences
- for positive divergences first it checks if closing price is higher than last closing price and indicator value is higher than perious value, then start searching divergence
- for negative divergences first it checks if closing price is lower than last closing price and indicator value is lower than perious value, then start searching divergence
Some Options:
Pivot Period: you set Pivot Period as you wish. you can see Pivot Points using "Show Pivot Points" option
Source for Pivot Points: you can use Close or High/Low as source
Divergence Type: you can choose Divergence type to be shown => "Regular", "Hidden", "Regular/Hidden"
Show Indicator Names: you have different options to show indicator names => "Full", "First Letter", "Don't Show"
Show Divergence Number: option to see number of indicators which has Divergence
Show Only Last Divergence : if you enable this option then it shows only last Positive and Negative Divergences
you can include any External Indicator to see if there is divergence
- enable "Check External Indicator"
- and then choose External indicator name in the list, "External Indicator"
- External indicator name is shown as Extrn
- related external indicator must be added before enabling this option
Coloring, line width and line style options for different type of divergences.
Following Alerts added:
- Positive Regular Divergence Detected
- Negative Regular Divergence Detected
- Positive Hidden Divergence Detected
- Negative Hidden Divergence Detected
Now lets see some examples:
Hidden Divergences:
Regular and Hidden Divergences together:
Showing first letters of indicators:
You can see only the number of indicators which has divergence:
You can see only divergence lines without indicators names and numbers:
option to used different label/line/text colors:
You have option to see only last divergences:
You can change Pivot Period, in following example Pivot Period = 15:
You can use Close or High/Low as Source for Divergence
You can include external indicators and get divergences on it:
Wish you all a happy new year!
Enjoy!

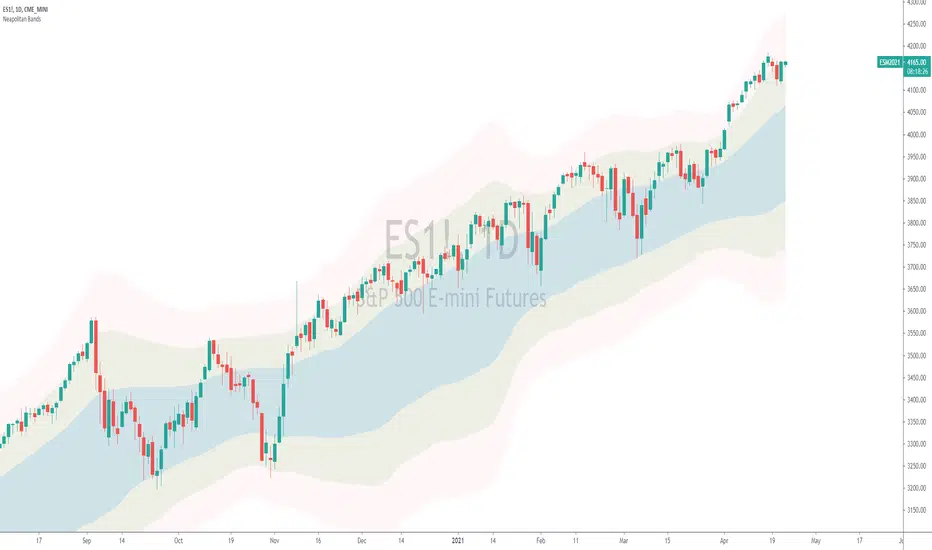
Neapolitan BandsThe Neapolitan Bands were derived from Jean Marc Guillot's 2001 IFTA trading strategy. In his study published by the International Federation of Technical Analysis titled, "Using Indicators from the Derivatives Markets to Forecast FX Moves" Guillot utilizes multiple bollinger bands of various deviations to determine trends and reversals, entries and exits. I isolated this particular part of his overall trading strategy because it has been a useful trend following indicator for me.
Some basics:
Neapolitan Bands can help identify points that a trend starts and ends, as well as reversals when price is ranging.
These bands are typically paired with another indicator like Guillot did to help separate/time trend or reversal signals. (He used MACD, Slow Stochastic, and RSI)
Parts of this indicator:
The period is by default 55 to identify "intermediate" trends. Not short or long term ones.
The blue area shows the 1st standard deviation. This is the "normal range" where price "likes" to be.
The green area shows the 2nd standard deviation and identifies/defines trends. Closes in this area are used for entering trends long or short.
The red area shows the 3rd standard deviation that shows either a spot to take profit/enter a reversal trade, or a point where the market is free falling.
Trend trading rules:
Entry and exit signals for trends are based on price closing above and below the 1st standard deviation, or blue area. If you expect a bullish trend, you buy once price enters the upper green area.
Guillot recommends setting a stop loss to the MA period of the Neapolitan Bands. So if it's 55 periods, you set the stop loss at the 55 SMA.
Reversal trading rules:
For reversals Guillot says, "In a trading range, bands act as supports and resistances. In extreme conditions reversals can occur within or past the 2nd standard deviation." For us, this means that technically anywhere in the green or red areas, a reversal can occur when the price is ranging. Typically this happens at the edges of the bands.
The "edge to edge" trade:
This is a strategy I took from Ichimoku Clouds and applied to the Neapolitan Bands. An "edge to edge" trade is when price closes back into the blue area from one edge, and price travels all the way to the other edge of the blue area. This can apply going from the edge of one green area to the other edge.
Note that this is one piece of Guillot's trading system, and not the whole thing. On top of that I have modified the original parameters to suit the function of trend following, and added an extra bollinger band. Using a shorter period like 20 is more optimal for shorter expected trends or reversals, and it's what Guillot used himself.
Thanks to Sean Nance for reminding me the indicator looks like ice cream! ( coming up with the name :P )
TradeChartist Donchian Channels Breakout Filter™TradeChartist Donchian Channels Breakout Filter is an elegant version of the classic Donchian Channels with few extra variations and option to filter breakouts based on user preferred Breakout price selection to generate Trade Entries.
===================================================================================================================
Features of ™TradeChartist Donchian Channels Breakout Filter
======================================================
Option to plot Donchian Channels of user preferred length, based on the Source price in addition to High/Low Donchian Channels.
Generates trade entries based on user preferred Breakout Price. For example, if the user prefers HL2 as breakout price, irrespective of the Donchian Channels type, trade entries are generated only when hl2 price (average of high/low) breaks out of the upper or lower band.
Option to plot background colour based on Breakout trend. The bull zones are filled with green background, the Bear zones are filled with red background and the bar that broke out is filled with orange background.
Option to colour price bars using Donchian Channels price trend. The Donchian Channels basis line is plotted using the same colours as coloured bars as default.
Alerts can be created for long and short entries using Once per Bar Close .
Note: This script does not repaint . To use the script for trade entries, wait for the bar close and use a second confirmator (includes fundamentals) based on asset type as some markets require users to have good pulse on the fundamentals as trading by Technicals/price action dynamic alone may not be safe.
===================================================================================================================
Best Practice: Test with different settings first using Paper Trades before trading with real money
===================================================================================================================
This is not a free to use indicator. Get in touch with me (PM me directly if you would like trial access to test the indicator)
Premium Scripts - Trial access and Information
Trial access offered on all Premium scripts.
PM me directly to request trial access to the scripts or for more information.
===================================================================================================================
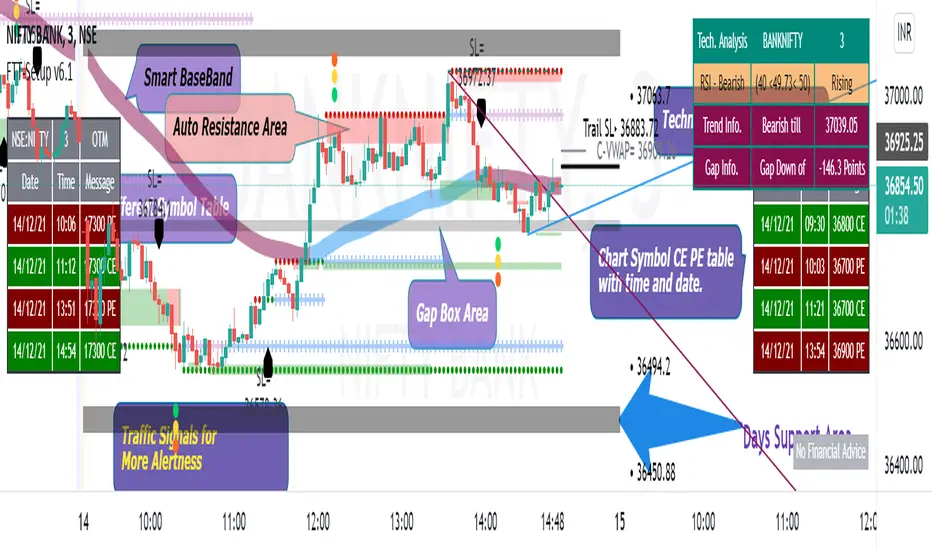
Fishing The Trend - SetupFishing The Trend - Setup
HOW Does it work ?
The name itself says we must have a trading setup for ease of trading for getting the most from the market.
i.e. Combining the most useful indicator under one roof...
Fishing The Trend - Setup have following ::-
1) IntraDay Range.
2) Four Friends.
3) Fishing The Trend.
4) Multi Time Frame - Custom VWAP.
5) RSI based SMA.
1) Intraday Range
HOW Does it work ?
For calculating the average most probable range for any plotted security, it plots 2 bands higher band and a lower band for a particular range using the default ADR. This indicator is on - as default.
# Upper and Lower band act as support and resistance , user may see a reversal in trend from these bands
# If the price breaks these bands, don't take a trade expecting a reversal
# These bands are calculated by averaging the previous x number of days' highs and lows of the security.
2) Four Friends
HOW Does it work ?
Plotting different EMA for finding the direction of Trend / Market, There are actually 5 EMAs- F1 = 20 EMA, F2 = 50 EMA, F3 = 100EMA, F4= 150, and Trend = 200-EMA. Usually 200 EMA is used to find the trend of market whether bearish / bullish, if market is above 200 ema than we may say its bullish and below 200 ema its bearish. The 50 EMA and 100 EMA works as best pullbacks in the trending market, user can configure as per his trading style and method. This indicator can be changed to multi timeframe as required. User can plot lower time frame data onto higher time or vice-versa for finding better opportunities for early trend detection, also the user have the option to use feature of non-repainting or vice versa. The default Color MA option is un=ticked, means plotting 5 different color EMAs, If the user ticks this feature, the whole 5 EMA color will change into red or orange as per direction of closing candle, user can change color as per his / her color combination. Default plotting time is of 1 min. This second indicator is off by default - user have to tick-it to activate it
3) Fishing The Trend
HOW Does it work ?
The code uses dynamic current levels to identify trend, This indicator is using SuperTrend, ATR and relatively Smoothened ATR for
early trend reversal detection to determine the trend and direction so that a fruitful decision can be made.
To Indicate the strength of the trendline, The standard calculations of SuperTrend, along with multiple smoothen ATR results are clubbed determine the direction, a step ahead. However, the indicator is not appropriate for all the situations. It works when the market is trending. Hence it is best to use for short-term technical analysis . SuperTrend uses only the two parameters of ATR and multiplier which are not sufficient under certain conditions to predict the accurate direction of the market. Here in this indicator ATR value is not editable and after long backtests the best ATR value is kept that helps the indicator working very well.
The default setting is best for use, but user can customize the Multiplier for his own fine tunings, So once the Levels are matched, a Long / Short suggestion is plotted. Best Time Frames to use : starting from 1, 3, 5, 15, 30 Mins and so on... to determine Trend.
Long = L and Short = S.
Where and how to use?
The main use of this indicator is quick scalping and Intra-day trading. The Indicator shows the option to show Long/Short Signals which the use can be turned on or off. The indicator shows a very useful option for early detection of the ongoing trend whether there will be reversal of trend or not ?
Stop Loss - That should be done by following ones risk appetite, Ideally the High of the Previous Candle should be the stop loss for
the Long / Short but everyone has their own Risk Management Strategies based on the capital deployed.
by default this comes on..
4) Multi Time Frame - Custom VWAP.
HOW Does it work ?
VWAP = The volume weighted average price (VWAP) is a trading benchmark used by traders that gives the average price a
security has traded at throughout the day, based on both volume and price. It is important because it provides traders with insight into both the trend and value of a security.
This indicator is programmed for using vwap for spot indices / securities not having volume calculations but have futures, specially banknifty and nifty of Indian markets. User has option to change the plotting timeframe as per his requirements for checking the trend under vwap or over vwap. The user have to type the equivalent script symbol in the space provided to calculate the vwap of that particular security and plot on the non-volume script. Seems confusing !!!! have a look
at example..
eg. - if you have chart of banknifty spot and u want to place vwap on in then just write security name in the blank field banknifty future of continuous contract running month " BANKNIFTY1! " Futures Chart... that's it and u will have futures vwap plotting on spot chart... this can give user a definite idea about the vwap line. User have option to change color of bar and change color of the
vwap line which is plotted.
By default this comes off..
Note = This indicator changes bar color
5) RSI based SMA
HOW Does it work ?
# This indicator is for user using RSI, The twist is that not only it uses RSI but also simple moving average, So this makes the user more safe as it is a combination of RSI and SMA.
# Multi-colored ----> Green/Red/Yellow user can change ..moving average of choice
# user can change overbought / over sold values of RSI as required. The time frame here is fixed.
* There is an On/Off Option for each Indicator.
Disclaimer : There could be scenarios when the candle is shown as a long or short and then the candle turns into opposite direction red/green. In such scenarios , Please refer to the just preceding candle and the early detection signal and if this candle is moving into positive direction only then go for long, Similarly opposite for Short, the value of multiplier 1.0 is determined using series of back test across various assets with different time frames.
User Options : Choice of turning on / off the Long / Short Labels and early detection/StopLoss Option can also be activated or deactivated.
Visual Checks - The user could manually validate the back test results on various assets they would like to use this strategy on before putting it live.
Usage/Markets : Index Trading / Equities and also well with Commodities and Currencies
How to get access
Please click on the link / email available in the signature or send me a private message to get access.
Feedback
Please click on the link/email in the signature or send me a private message for suggestions/feedbacks.
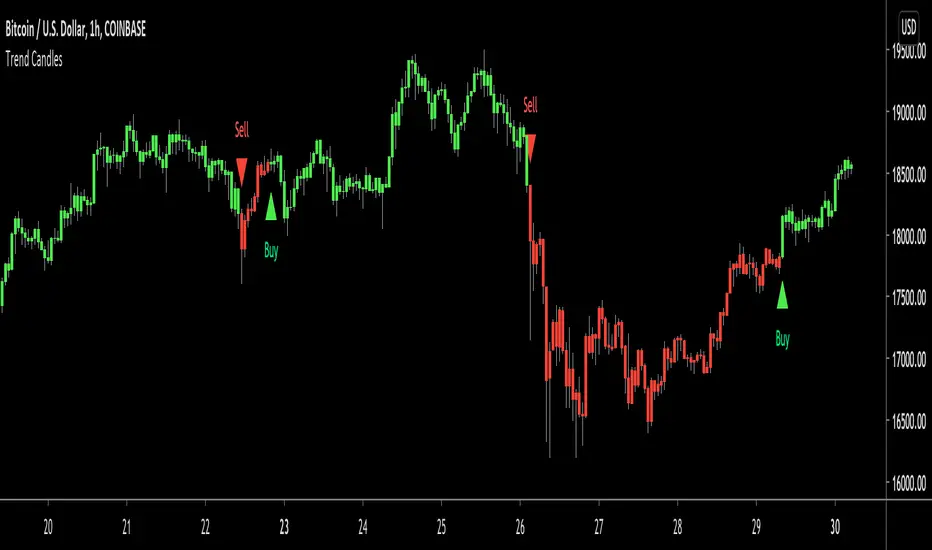
Trend CandlesTrend Candles is a simple indicator based on the trend following strategy that shows you exactly when to buy, sell and close trades on every chart, market and timeframe. It's always in a trade, either long or short as indicated by the color of the candles, when the candles are green that means go long, when they switch to red that means go short until the next green candle appears.
It's best used on markets that tend to trend a lot like currencies, futures and cryptos, however it also works well on stocks and ETFs (long-only).
How Is It Different From Other Indicators?
- Designed specifically for the trend following strategy
- Color coded candles for visually appealing chart guidance
- Signals are based on current and past volatility
- They aren't as sensitive to false signals after periods of contracted volatility
- Helps to keep you in the trend without being "shaken out"
- Can be applied to all markets and timeframes
How To Use The Indicator?
1) Visit our website URL shown below this description and subscribe
2) We will then grant your TradingView username permission to use our indicators
3) Go to your Indicators window, then the Invite-Only section and add our indicators to your chart
4) Our indicators will then show on every chart you now look at
5) You can set up alerts to be notified in real time of trading signals from our indicators
6) Read our user manual for all the best tips on how to use our indicators
7) Feel free to reach out to us for personal one-on-one help with getting setup
What Markets and Conditions Does It Work Best On?
All markets cycle between trending and ranging modes, and the key to successfully using these indicators is identifying when the market is in or likely to go into a trending mode, and as such it can be applied to all markets and timeframes. After a market has contracted for a period of time in a tight range, the 1st entry signal after the period of consolidation can become the start of a powerful trend. On the flip side taking every signal when a market is ranging will result in churn.
Our indicators are primarily designed for day trading and swing trading, however they can also be used for position trading and investing by keeping you invested in the trend which can be very difficult to do without a good indicator due to all of us being vulnerable to getting "shaken out" of a trend. This indicator will always respond to changes in price and will never keep you in a trend going against you, and like all good trend following it adheres to the principles of cutting your losses and letting your winners run so long as the trend is intact. It's the top 1-5% of your trades that account for 80-90% of your profits, as fat tail moves happen more often in markets than a normal distribution would suggest and that's why trend following albeit difficult to practice, will always work.
With stocks and ETFs, we recommend sticking to long only as shorting stocks is very difficult no matter the strategy or indicator used. If you're an investor you can use Trend Candles on the daily or weekly charts to help keep you in good stocks and industries and avoid holding onto perpetual losers.
As always indicators should be used as part of a trading strategy to assist in making decisions, instead of just blindly following every signal they produce you should always seek to compliment technical trading signals with additional analysis to reduce your risk and increase your odds of making a winning trade.
Examples Of Trend Candles On Various Markets and Timeframes
FOREX - EURJPY (5 Minute Chart)
CRYPTOCURRENCY - ETHUSD (30 Minute Chart)
STOCKS - TSLA (Daily Chart)
COMMODITIES - GOLD (Daily Chart)

To gain access to Trend Candles today visit our website shown below.
Happy Trend Following :)
Trend Indicator for Directional Trading (add-on)TIDT is a two-part trend-based indicator designed to recognize the general direction and help you identify good opportunities for going long or short (both indicators are called the same way with "main" and "add-on" additions).
This is the add-on indicator that is added below the chart and aside from identifying trending opportunities, it also shows Bullish and Bearish Divergences. Similar to the main indicator, it is based on 3 Moving Averages over which you have full control. You can choose between the following 7 types:
- Simple Moving Average ( SMA )
- Exponential Moving Average ( EMA )
- Weighted Moving Average ( WMA )
- Running Moving Average (RMA)
- Hull Moving Average ( HMA )
- Volume Weighted Moving Average ( VWMA )
- Arnaud Legoux Moving Average ( ALMA )
I strongly suggest that the types and periods for your MAs in the main and the add-on versions are identical so that you get a better visual of the whole picture. However, you may develop a trading strategy that relies on two different types of signals, so that's entirely up to you. Once you have set up the MAs and chosen the lookback period, the rest is taken care of for you. You get two types of signals:
1) Pullbacks - the divergences between your MAs generate a result, which is then averaged as a percentage gain or loss and worked out into a histogram. The colors of the histogram indicate opportunities to buy (if green), short (if red), or sit tight (if white) unless an explicit signal is given by the indicator. Overall the principle is simple - establish the trend and look for weaknesses so that you can open an order in the direction of the trend.
2) Divergences - generated in a similar way to the Pullbacks strategy with some minor adjustments and improvements to better catch the divergences. The histogram is slightly different, as the positive results are plotted above 0 and the negative ones below 0. As such, the histogram looks a lot like MACD, but with different calculations. The color principle mentioned above is the same - green for longs, red for shorts, and white for neutral unless specified by a signal. The change of the shade of the color shows an increase or a decrease in the momentum. A Long signal comes up when the price makes a lower low, while the momentum makes a higher low. A Short signal comes up when the price makes a higher high, but the momentum makes a lower high.
Ticking a box next to the signal type will show the associated histogram and its signals. Due to the different ways those two histograms are calculated and displayed I recommend having either of them On, but not both. However, you may want to be able to see both types of signals, so I've left this as an option. Once again, all colors are fully configurable.
The complete Trend Indicator for Directional Trading has gone over 1,500 revisions, has been forked over 10 times, and has been worked out to be as minimalistic, useful, and practical as possible. A great deal of work, time, and experience have been poured into this indicator to do what it's supposed to do - help you identify better entry opportunities for increased profitability.
If you have any questions regarding the indicator or suggestions on how it could be improved, please let me know. Thank you.