Advanced Market Structure [Rogman]Rogman's Advanced Market Structure Indicator
The Ultimate All-in-One Market Structure Analysis Tool for TradingView
Take your technical analysis to the next level with a comprehensive, professional-grade tool designed for traders who demand precision and clarity in their charts.
🎯 Who Is This For?
ICT/SMC Traders seeking liquidity zones and market structure analysis
Day Traders monitoring session-based price action and kill zones
Swing Traders identifying key higher timeframe levels
Price Action Traders analyzing structure breaks and trend changes
Any Serious Trader wanting a clean, comprehensive market structure overlay
✨ Key Features
📊 Market Sessions Visualization
Track the three major trading sessions with our unique bracket-style display:
Asia, London, and New York sessions are clearly marked
Sessions display as SESSION ════════════ below price action
Smart vertical stacking prevents overlapping when sessions have similar lows
Fully customizable session times for any timezone
Perfect for identifying session highs/lows and optimal kill zone timing
📈 Higher Timeframe (HTF) Levels
Never miss a key level again:
Display Daily and Weekly Open, High, and Low levels
Instant visual reference for HTF support and resistance
Separate color controls for lines and labels
Choose from Solid, Dashed, or Dotted line styles
Essential for determining HTF bias and key decision points
🔄 Automatic Swing Detection
Let the indicator do the heavy lifting:
Auto-detection of swing highs (▼) and swing lows (▲)
Configurable lookback period for sensitivity adjustment
Optional horizontal level lines extending from swing points
Customizable colors, widths, and line styles
Identify potential reversal points and structure levels instantly
💧 Liquidity Zone Mapping
See where the money is hiding:
Automatic identification of buy-side liquidity (above swing highs)
Automatic identification of sell-side liquidity (below swing lows)
Visual zones show where stop losses are clustered
Real-time tracking when liquidity gets swept
Swept zones change color — know when liquidity has been taken
📉 Multi-Method Trend Detection
Three powerful methods to confirm trend direction:
Swing Structure — Based on higher highs/lows or lower highs/lows
EMA — Trend based on price position relative to EMA
Supertrend — Uses the popular Supertrend indicator
Features include:
Optional background coloring for at-a-glance trend identification
Real-time trend status label (UPTREND/DOWNTREND/NEUTRAL)
Customizable colors and transparency
🏷️ HH/HL/LH/LL Labels
Automatic market structure labeling:
HH (Higher High) — Bullish continuation signal
HL (Higher Low) — Bullish continuation signal
LH (Lower High) — Bearish continuation signal
LL (Lower Low) — Bearish continuation signal
Color-coded for instant visual recognition
📋 Information Dashboard
All critical data at a glance:
Current ticker symbol
Trend direction and status
Daily and Weekly bias
Last swing high and low prices
Active liquidity zone count
Positionable in any corner of your chart
🔔 Built-in Alerts
Never miss a key event:
Trend change alerts (Bullish/Bearish)
Swing high/low formation alerts
Set up notifications for critical market structure changes
🎨 Fully Customizable
Every feature can be:
Toggled on/off individually via the Feature Toggles menu
Color customized to match your chart theme
Size adjusted for optimal visibility
Fine-tuned with sensitivity parameters
Organized settings groups make configuration intuitive and fast.
🚀 Why Choose This Indicator?
Feature: Benefit: All-in-One Solution. Replace multiple indicators with one comprehensive tool. Clean Design and Thoughtful visual hierarchy keep charts readable. Smart Overlap Prevention. Session bars automatically stack to avoid visual clutter. Real-Time Updates: All elements update dynamically as the price moves. Professional Quality-Built with best practices in Pine Script v6. Extensive Documentation, clear code comments, and an organized structure
📖 How to Use
Add the indicator to your TradingView chart
Enable/disable features using the Feature Toggles menu
Customize colors and settings to match your preferences
Adjust session times for your timezone
Set up alerts for trend changes and swing formations
Pro Tips:
Use session times to identify optimal entry windows during kill zones
Watch for price sweeping liquidity zones before looking for reversals
Combine HTF bias with lower timeframe entries for higher probability trades
Use swing levels as potential support/resistance for entries and targets
Monitor the dashboard for a quick market assessment before trading
⚠️ Disclaimer
This indicator is provided for educational and informational purposes only. It does not constitute financial advice. Trading involves substantial risk and is not suitable for all investors. Past performance is not indicative of future results. Always conduct your own analysis and consider your financial situation before making trading decisions.
Trendlinesupportzone
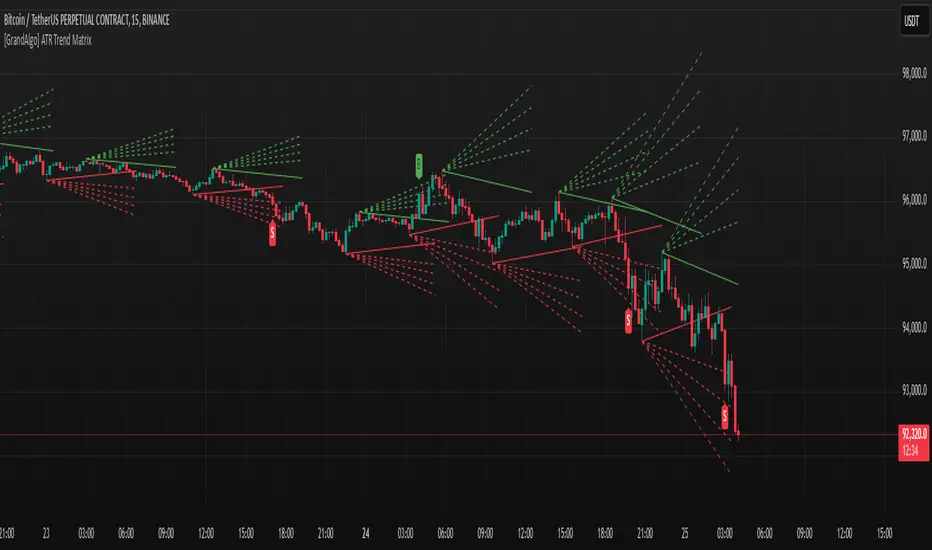
[GrandAlgo] ATR Trend MatrixThe ATR Trend Matrix is a dynamic trendline indicator designed to help traders visualize market structure using ATR-based trend projections. This tool adapts to price action and highlights potential support and resistance zones based on Average True Range (ATR) calculations.
Key Features
ATR-Based Trendlines – Calculates and plots dynamic trendlines using an adjustable ATR factor.
Multi-Level Matrix System – Provides up to four matrix levels, each customizable with different ATR multipliers.
Swing High & Low Detection – Automatically detects market pivots to serve as anchor points for trendlines.
Adjustable Trend Length – Fine-tune the sensitivity of trendlines using the Swing Length and Trend-Line Length Multiplier.
Auto-Adjustment Mode – When enabled, trendlines update dynamically as ATR evolves.
Buy & Sell Signals – Marks potential trade setups when price crosses below or above Matrix Level 1.
How It Works
Detects Swing Points – Identifies key highs and lows in the market using the length setting.
Plots ATR-Based Trendlines – Calculates trendlines using ATR with user-defined multipliers for four matrix levels.
Adjusts Dynamically – If Auto Adjust is enabled, trendlines shift with ATR movements.
Identifies Trade Signals – Highlights potential buy/sell zones when price interacts with Matrix Level 1 trendlines.
Manages Active Trendlines – Automatically updates and removes trendlines based on price interaction.
User Settings
General Settings
ATR Factor – Controls the ATR multiplier for trendline calculation.
Swing Length – Defines the number of bars for swing high/low detection.
Trend-Line Length Multiplier – Adjusts the extension length of trendlines.
Auto Adjust Trendlines – Enables real-time adjustment of trendlines as ATR changes.
Matrix Settings
Matrix Level 1-4 – Enable or disable individual trendline levels.
Matrix Factors – Customize the ATR multipliers for each matrix level.
Trading Applications
Trend Confirmation – Use the primary trendline and matrix levels to gauge trend strength.
Support & Resistance Zones – ATR-based trendlines can act as dynamic support/resistance.
Breakout & Rejection Signals – Identify potential breakouts or reversals when price interacts with matrix levels.
Volatility-Based Trading – ATR helps adjust trendlines based on market volatility.
The ATR Trend Matrix is a powerful tool for traders who want a dynamic, adaptive trendline system that reacts to market structure and volatility. With customizable settings, multi-level ATR projections, and trade signal detection, this indicator provides a comprehensive approach to price action analysis.
Trendlines (long)Hi all!
I hope that this indicator helps you to be a more efficient trader. The concept is well known and useful. So this is not some magic algorithm founded by me, but rather a well known concept. The concept is the drawing of trendlines.
It draws trendlines that has a retest. It draws the trendlines in different colors, the colors used are blue, red, fuchsia and lime.
These are the steps for finding a trendline:
1. Find a generic retest
Find a low that has 2 earlier lows and 1 later low that are higher. This is the reason that a trendline will be created "1 bar late". This is the base and the indicator goes on from here, meaning that this needs to be true to continue.
2. Find an uptrend
Look back 8 bars to find a low that is lower than the retest low.
3. Create the first point of a trendline
Go thru every bar between the user defined "Lookback" and the retest bar (minus the user defined "Skip gap" that's needed between points to create a trendline). From the earliest bar to the latest.
4. Create the second point of the trendline
Go thru every bar between the retest bar and the the first point (bar) minus the "Skip gap". From latest bar to the earliest. A trendline between the two bars are invalidated if some of the criteria are met in-between the bars creating the trendline:
- closed above the trendline (trendline broken)
- is not within the retest bar
- the slope of the trendline is upwards (this indicator is for long entries only)
- at least 1 of the bars creating the retest (1 main bar and 2 earlier bars) has NOT been above the trendline
- is not the created trendline (between the two points) that's closest to the low of the retest bar
TODO:
- add functionality to draw trendlines directly on breakouts
- add volume (high volume needed to create a trendline from a breakout/retest)
- ...?
I hope this explanation makes sense, let me know otherwise. Also let me know if you have any suggestions on improvements.
Best of luck trading!


