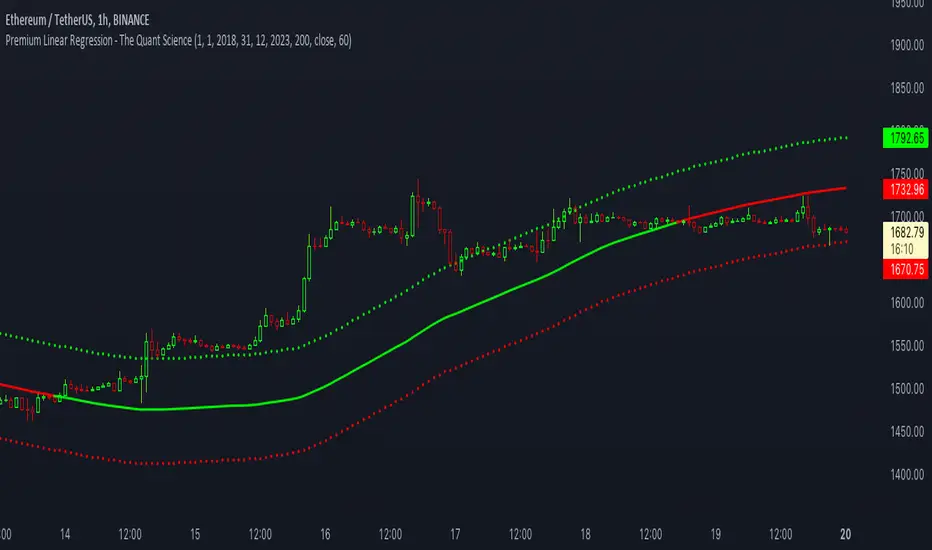
Cyberpunk Hyper-Linear ChannelCyberpunk Hyper-Linear Channel is a next-generation linear regression channel designed to visualize trend direction, volatility, and price positioning with high clarity and minimal noise.
Unlike traditional regression channels, this indicator applies EMA smoothing to both slope and intercept, significantly reducing sudden angle shifts and visual jitter.
The result is a stable, latency-controlled trend channel that adapts smoothly to market structure.
🔹 Core Concept
・Linear regression defines the trend axis
・Standard deviation determines dynamic channel width
・Slope & intercept smoothing improves structural stability
・Neon zones highlight bullish / bearish pressure in real time
🔹 Key Features
・Smoothed Linear Regression Channel (trend-focused, low noise)
・Volatility-based adaptive upper & lower boundaries
・Dynamic neon fill that reacts to price position
・Clear trend bias visualization without repainting clutter
・Cyberpunk-inspired, clean and modern aesthetic
🔹 How to Use
・Price near center line → Mean reversion / equilibrium zone
・Price approaching channel edges → Volatility expansion
・Upper zone dominance → Bullish trend pressure
・Lower zone dominance → Bearish trend pressure
・Breakouts beyond the channel may signal trend acceleration or exhaustion
🔹 Best Use Cases
・Trend-following confirmation
・Dynamic support & resistance mapping
・Market structure visualization across all assets
Cyberpunk Hyper-Linear Channel は、
トレンド方向・ボラティリティ・価格の位置関係を
ノイズを極力排除して可視化する次世代線形回帰チャネルです。
従来の線形回帰チャネルと異なり、
傾き(Slope)と切片(Intercept)の両方にEMAスムージングを適用。
これにより、角度の急変や視覚的ブレを抑えた
安定性の高いトレンド構造を描画します。
🔹 コンセプト
・線形回帰によるトレンド軸の定義
・標準偏差による動的チャネル幅
・スムージングで構造ノイズを低減
・価格位置に応じたネオンゾーンの動的強調表示
🔹 特徴
・低ノイズ・高安定な線形回帰チャネル
・ボラティリティ連動型の上下バンド
・価格位置に反応するダイナミックな発色
・リペイント感のないクリーンな描画
・サイバーパンク調の洗練されたデザイン
🔹 使い方
・中央線付近 → 平衡・持ち合いゾーン
・チャネル上限 / 下限付近 → ボラ拡大・圧力増加
・上部ゾーン優勢 → 上昇トレンド圧力
・下部ゾーン優勢 → 下降トレンド圧力
・チャネル外へのブレイクは加速 or 行き過ぎの兆候として注視
🔹 想定用途
・トレンドフォローの補助
・動的サポート / レジスタンスの把握
・相場構造の視覚的理解
Visualindicator
Cyberpunk Vortex IndicatorCyberpunk Vortex Indicator is a visually enhanced Vortex-based momentum indicator designed to clearly capture trend strength and directional dominance.
This indicator calculates VI+ (bullish pressure) and VI− (bearish pressure) using the classic Vortex methodology, then renders them with a layered neon cyberpunk-style glow for maximum readability and impact.
🔹 Key Features
・Vortex Indicator (VI+ / VI−) with SMA smoothing
・Multi-layer laser-style glow (outer / inner / core lines)
・Clear visual distinction between bullish and bearish momentum
・Subtle background and fill effects for intuitive trend recognition
・Clean, modern design without clutter
🔹 How to Use
・VI+ above VI− → Bullish momentum dominates
・VI− above VI+ → Bearish momentum dominates
・The 1.0 baseline helps identify strengthening or weakening trends
・Best used as a trend confirmation tool, not a standalone signal
🔹 Recommended Timeframes
Works well across multiple timeframes.
Commonly effective on 15m, 1H, 4H, and higher.
This indicator focuses on clarity, aesthetics, and momentum visualization, making it ideal for traders who value both performance and design.
Cyberpunk Vortex Indicator は、トレンドの強さと方向性を直感的に把握するために設計された、視認性とデザイン性を重視したボルテックス系モメンタム指標です。
クラシックな Vortex Indicator(VI+ / VI−)をベースに、サイバーパンク調のネオン発光レイヤーで描画することで、買い圧力・売り圧力の優位性を一目で判断できます。
🔹 特徴
・Vortex Indicator(VI+ / VI−)をSMAでスムージング
・外側・内側・芯の3層レーザー風グロー表現
・上昇 / 下降モメンタムの視認性を大幅に向上
・控えめな背景・塗りつぶしで相場の空気感を演出
・ノイズの少ない、洗練されたデザイン
🔹 使い方
・VI+ が VI− を上回る → 上昇トレンド優勢
・VI− が VI+ を上回る → 下降トレンド優勢
・1.0 の基準線でトレンドの勢いを確認
・単体判断ではなく、トレンド確認用としての使用を推奨
🔹 推奨時間足
マルチタイムフレーム対応。
特に 15分足 / 1時間足 / 4時間足以上で安定。
本インジケーターは
「見やすさ」「美しさ」「モメンタムの可視化」を重視しており、
デザインと実用性の両立を求めるトレーダー向けです。
Blockunity Drawdown Visualizer (BDV)Monitor the drawdown (value of the drop between the highest and lowest points) of assets and act accordingly to reduce your risk.
Introducing BDV, the incredibly intuitive metric that visualizes asset drawdowns in the most visually appealing manner. With its color gradient display, BDV allows you to instantly grasp the state of retracement from the asset’s highest price level. But that’s not all – you have the option to display the oscillator’s colorization directly on your chart, enhancing your analysis even further.
The Idea
The goal is to provide the community with the best and most complete tool for visualizing the Drawdown of any asset.
How to Use
Very simple to use, the indicator takes the form of an oscillator, with colors ranging from red to green depending on the Drawdown level. A table summarizes several key data points.
Elements
On the oscillator, you'll find a line with a color gradient showing the asset's Drawdown. The flatter line represents the Max Drawdown (the lowest value reached).
In addition, the table summarizes several data:
The asset's All Time High (ATH).
Current Drawdown.
The Max Drawdown that has been reached.
Settings
First of all, you can activate a "Bar Color" in the settings (You must also uncheck "Borders" and "Wick" in your Chart Settings):
You can display Fibonacci levels on the oscillator. You'll see that levels can be relevant to drawdown. The color of the levels is also configurable.
In the calculation parameters, you can first choose between taking the High of the candles or the Close. By default this is Close, but if you change the parameter to High, the indication next to ATH in the table will change, and you'll see that the values in the table will be affected.
The second calculation parameter (Start Date) lets you modify the effective start date of the ATH, which will affect the drawdown level. Here's an example:
How it Works
First, we calculate the ATH:
var bdv_top = bdv_source
bdv_top := na(bdv_top ) ? bdv_source : math.max(bdv_source, bdv_top )
Then the drawdown is calculated as follows:
bdv = ((bdv_source / bdv_top) * 100) - 100
Then the max drawdown :
bdv_max = bdv
bdv_max := na(bdv_max ) ? bdv : math.min(bdv, bdv_max )
Dip & Rip Patterns - The Quant Science🇺🇸
GENERAL OVERVIEW
This indicator detects Dip and Rip patterns by quickly highlighting them on the chart.
These patterns have become popular during the pandemic period mainly in the stock, ETF and cryptocurrency markets on which traders use two interesting strategies:
Buy The Dip
Sell The Rip
Before going into the merits of this technical indicator, let's understand what these two patterns mean and what they identify precisely.
Rip (Rise In Price) : wants to identify a market condition in which the price rises rapidly, for example from $100 to $110 in a few minutes or hours.
Dip (Drop In Price) : wants to identify a market condition in which the price drops rapidly, for example from $100 to $90 in a few minutes or hours.
HOW TO USE
For a better user experience, we recommend choosing a neutral colour for the candles while analysing with this indicator. You can quickly change the colour in Chart Settings > Symbol > Candles .
Depending on the configuration set by the user, the indicator will show Dip (Dip In Price) patterns in red and Rip (Rise In Price) patterns in green.
When the pattern forms, a circle will be displayed and a vertical line will be coloured on the chart along with the body of the candle. The user will then be able to quickly and easily track the configured market conditions.
In this example, we decided to use a 4H timeframe on the BTC/USDT pair (Binance).
Set in the user interface:
Period: 20
Dip (%): -25
Rip (%): 20
Price falls by 25% or more in 80 hours (Dip Pattern).
Price rise by 25% or more in 80 hours (Rip Pattern).
The user can easily configure the parameters via the user interface in the Inputs section (A) and change the indicator design in the Properties section (B).
🇮🇹
PANORAMICA GENERALE
Questo indicatore rileva i Dip e Rip patterns evidenziandoli velocemente sul grafico.
Questi patterns sono diventati famosi durante il periodo pandemico principalmente nel mercato delle azioni, ETF e Criptovalute su cui i trader utilizzano due interessanti strategie:
Buy The Dip
Sell The Rip
Prima di entrare nel merito di questo indicatore tecnico, comprendiamo il significato di questi due pattern e cosa identificano precisamente.
Rip (Rise In Price) : vuole identificare una condizione di mercato in cui il prezzo sale rapidamente, per esempio passando da 100$ a 110$ in pochi minuti o poche ore.
Dip (Drop In Price) : vuole identificare una condizione di mercato in cui il prezzo cala rapidamente, per esempio passando da 100$ a 90$ in pochi minuti o poche ore.
UTILIZZO
Per una migliore esperienza utente consigliamo di scegliere un colore neutro per le candele mentre si analizza con questo indicatore. Puoi cambiare velocemente il colore in Chart Settings > Symbol > Candles .
In base alla configurazione impostata dall'utente l'indicatore mostrerà in rosso i pattern Dip (Dip In Price) e in verde i pattern Rip (Rise In Price).
Quando il pattern si forma verrà visualizzato un cerchio e una linea verticale sul grafico che sarà colorata insieme al corpo della candela. L'utente quindi potrà tracciare facilmente e velocemente le condizioni di mercato configurate.
In questo esempio abbiamo deciso di utilizzare un timeframe 4H con l'obbiettivo di ricercare i patterns sul pair BTC/USDT (Binance).
Impostiamo nell'interfaccia utente:
Period: 20
Dip (%): -25
Rip (%): 20
Il prezzo diminuisce del 25% o più in 80 ore (Dip Pattern).
Il prezzo aumenta del 25% o più in 80 ore (Rip Pattern).
L' utente può configurare facilmente i parametri attraverso l'interfaccia utente nella sezione Inputs (A) e modificare il design dell'indicatore nella sezione Properties (B).
Premium Linear Regression - The Quant ScienceThis script calculates the average deviation of the source data from the linear regression. When used with the indicator, it can plot the data line and display various pieces of information, including the maximum average dispersion around the linear regression.
The code includes various user configurations, allowing for the specification of the start and end dates of the period for which to calculate linear regression, the length of the period to use for the calculation, and the data source to use.
The indicator is designed for multi-timeframe use and to facilitate analysis for traders who use regression models in their analysis. It displays a green linear regression line when the price is above the line and a red line when the price is below. The indicator also highlights areas of dispersion around the regression using circles, with bullish areas shown in green and bearish areas shown in red.
Zero Phase Filtering [Repaint] - ExperimentalImportant !
The indicator is for experimental purpose only, it must not be used as a decisional tool but only as a visual one (like Zig-Zag, Fractal etc). The information this indicator display is uncertain and subject to drastic changes over time. If you have further question feel free to pm me.
Introduction
Most of the filters you will find are causal, this mean that they depend on present and past input values, this explain the lag they produce. Non causal filters however will use future input values. A well know way to get a zero-phase filter is by using the forward backward method, but this is not possible in pinescript as i recall. So we have to use some kind of function that will display future values, this is possible using the security function in version 2 or the one in version 3 using barmerge.lookahead_on .
The Use Of A Repainting Indicator
Its always better to filter data in order to have a clearer view of what is happening, this can be useful when doing some forecasting or doing less formal kind of analysis. However since it repaint you cant use it as a signal provider or use signals of other indicators using this filter as source.
For example if you want to forecast a smooth indicator, the forecast of this indicator under normal circumstances could still have lag associated with it, so you would have to react before your forecast, this wont happen if you apply this filter as your indicator source.
The Filter
We smooth with a simple moving average the price provided by the security function twice, length control the smoothing level. Since security depend on the time frame you are in you must select your time frame in the indicator parameter selection window.
Filtering using 45 minutes time frame close price in a 5 minutes chart, we fix this by selecting our time frame.
Consider the fact that the input of the indicator is just periodic price, so sometimes the lag can sometimes be less or more than 0 and the estimation not centered.
The indicator can work on time frames up to 1h, after that the filter have some lag, i tried fixing this and i ended up having data errors.
Applying our filter as source for the rsi oscillator.
Conclusion
It is possible to have a kind of zero-phase filters, but it would be better if pinescript could support backward indexing thus making us able to do forward backward filtering.
Since noise can affect our analysis, applying smoothing without having to use offset in plot can be considered useful.
3 Sessions DividerAsia (Syndey + Tokio)
London
NY
Made for GMT-6 (Central US Time)
Sessions may Overlap.


