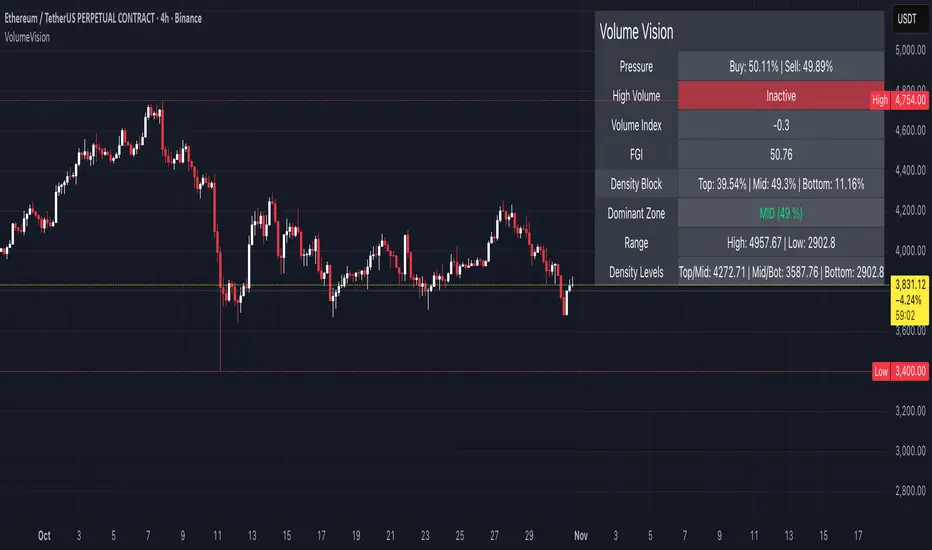
Volume VisionVolume Vision is a precision volume-analysis system that exposes how trading activity is distributed inside the current market range.
It divides the active price structure into three live zones — Top, Middle, and Bottom — and measures where real participation is concentrated.
This creates a dynamic “volume map” that allows you to instantly see whether the market is being driven by accumulation, distribution, or equilibrium.
At the heart of the indicator is a fully original implementation of the FGI — a proprietary composite metric designed to read market emotion and internal pressure.
It transforms several hidden components — volume, volatility, dominance, and directional momentum — into one unified curve of sentiment.
FGI values around 30 typically reflect phases of fear, capitulation, and potential accumulation.
Values near 80 mark conditions of greed, overextension, and possible distribution.
Observing these boundaries helps detect when the market is preparing to shift from compression to expansion or from euphoria to cooling.
Core Functions
Density Zones: Splits recent price movement into Top / Mid / Bottom areas, quantifying volume within each.
Dominant Zone: Highlights where the major share of liquidity currently resides.
Pressure Meter: Shows the balance between buy and sell volume in real time.
Volume Index: Normalizes present volume activity against its historical range to spot abnormal behaviour.
FGI Reading: Custom sentiment curve ranging from fear (≈ 30) to greed (≈ 80).
Alerts: Optional signals for High Volume and Rising Volume moments.
Dashboard: Compact on-chart table that summarizes all key readings without cluttering the view.
Interpretation Guide
When FGI drops near 30, the market often forms accumulation bases or bottom structures.
When FGI climbs toward 80, momentum usually reaches its limit and profit-taking or distribution begins.
A dominant Top zone with strong sell pressure indicates distribution, while Bottom dominance with buy pressure suggests accumulation.
Mid-zone dominance with neutral FGI reflects balance — a state of indecision before the next move.
Watch for volume spikes accompanied by FGI shifts: these often precede major impulse starts or ends.
Style: non-repainting core, minimal visuals, real-time clarity.
Created for traders who need to see where the energy is flowing, not just what price is printing.
by MahaTrend
ボラティリティ
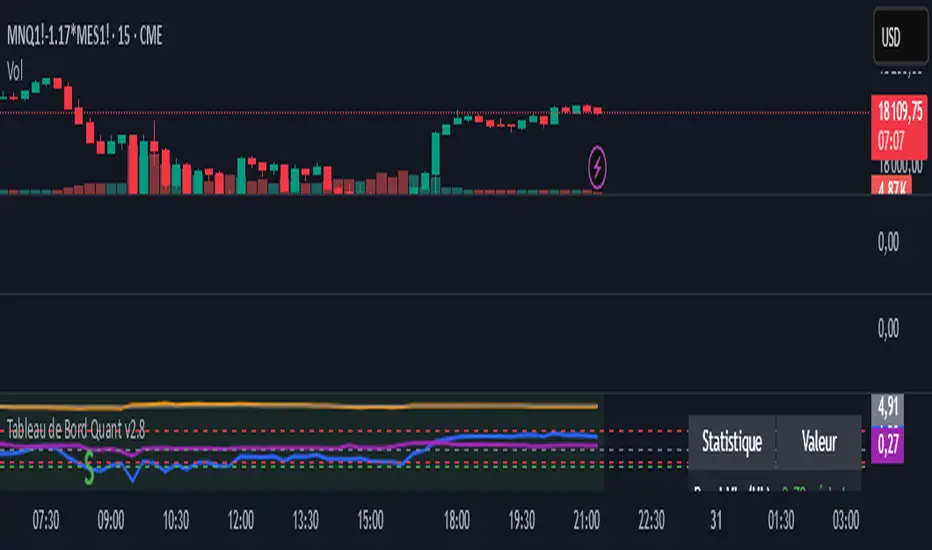
Zscore correlation volatility Demi vie IlkerThis is an all-in-one "regime" dashboard for pairs trading. It's designed to stop you from taking bad mean-reversion trades by first identifying if the market conditions are stable.
It answers two key questions:
1. "Is this a good time to trade a mean-reversion strategy?" (The Regime Filter)
2. "If yes, how fast should I expect the trade to work?" (The Half-Life)
## 📈 Key Features
This script runs four main calculations at once:
1. The Price Z-Score (Blue Line)
This is your primary entry signal. It shows you how "cheap" (e.g., -2.0) or "expensive" (e.g., +2.0) the spread is relative to its short-term history (z_len).
2. The Regime Background (Green / Red)
This is the most important part. It acts as a "traffic light" for your trading:
• 🟢 GREEN (Stable Regime): It's safe to look for mean-reversion trades. This means both the correlation and volatility filters are stable.
• 🔴 RED (Unstable Regime): DO NOT trade mean-reversion. The relationship between the assets is broken. Any signal is likely a trap.
3. The Regime Filters (Your "Guards")
These two filters determine the background color:
• Correlation Z-Score (Purple Line): It measures the stability of the correlation. If this purple line drops below the red threshold (corr_z_threshold), it means the correlation has broken down, and the background turns RED.
• Volatility Ratio (Orange Line): It compares the volatility of the two assets. If one asset suddenly becomes much more volatile than the other (deviating from its average ratio), the background turns RED.
4. The Half-Life Dashboard (Top-Right Table)
This is your "speedometer." Based on an Ornstein-Uhlenbeck model, it calculates the average time (in bars) it takes for the spread to revert 50% of the way back to its mean.
• HL: 13.86 periods: You can expect it to take ~14 bars to go from a Z-Score of 2.0 to 1.0.
• N/A (Divergent): A critical warning. The math shows the spread is currently diverging and has no tendency to revert.
## 💡 How to Use This Indicator
Setup (Required):
1. Load a spread chart (e.g., type MES/MNQ or MGC/SIL into the TradingView search).
2. Add this indicator to the spread chart.
3. Go into the indicator's Settings (⚙).
4. In the "Inputs" tab, you must enter the two individual tickers:
• Symbol 1 Ticker: MGC
• Symbol 2 Ticker: SIL
(This is so the script can calculate the Correlation and Volatility filters).
Trading Signals
1. Mean-Reversion Signals
• BUY Signal (Green Triangle ▲): Appears only if the background is GREEN and the Price Z-Score (blue line) crosses below the -2.0 band.
• SELL Signal (Red Triangle ▼): Appears only if the background is GREEN and the Price Z-Score (blue line) crosses above the +2.0 band.
• EXIT: Your target is a reversion back to the 0 line. The Half-Life value gives you an idea of how long to wait.
2. Divergence Warning Signals
• Blue/Fuchsia Triangles (▲ / ▼): These appear at the exact moment the background turns RED. They warn you that the "stable" regime is broken and a new "divergence" or "trend" regime may be starting. This is a signal to stay out or manage any existing positions.
This tool is designed to add a layer of quantitative, risk-management logic to a standard Z-Score strategy. It helps you trade only when the statistics are in your favor.
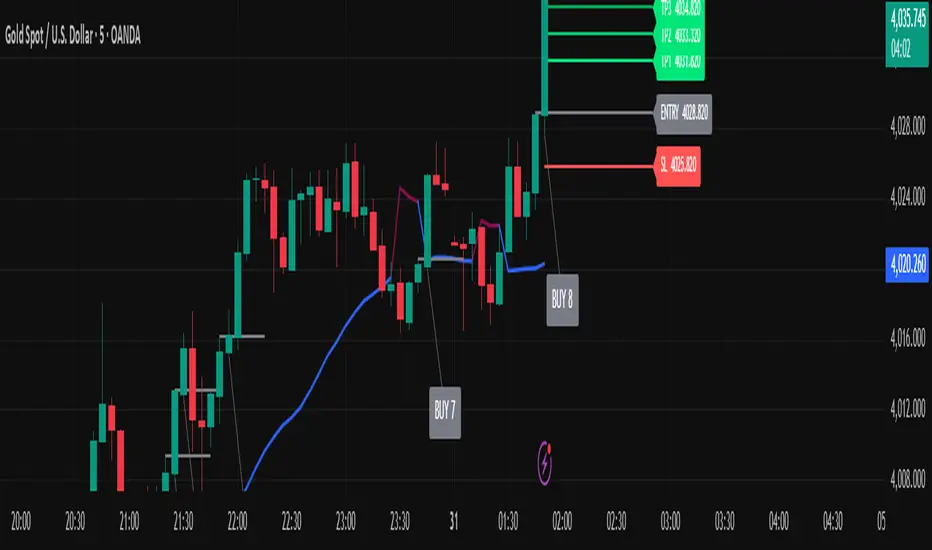
Golden Ladder – Louay Joha (Wave & Gann Hi/Lo + ATR R-Levels)Overview
Golden Ladder is a momentum-and-structure tool that detects three-bar ladder waves and filters them with a Gann Hi/Lo regime guide (SMA-based). When a valid wave aligns with the current Hi/Lo bias and passes optional market filters (ADX, RSI, and proximity to recent extremes), the script prints BUY/SELL n labels (n = wave index) and draws a complete Entry / SL / TP1–TP4 ladder using ATR-based risk units (R) or fixed caps—configured for clarity and consistency. The script also keeps the chart clean: the last trade remains fully drawn while historical groups are trimmed to compact “ENTRY-only” stubs.
Why these components together (originality)
Three-bar ladder captures short-term momentum structure (progressively higher highs/lows for buys; the reverse for sells).
Gann Hi/Lo (SMA of highs/lows with a directional state) acts as a regime filter, reducing counter-trend ladders.
ATR-based R ladder turns signals into an actionable plan: a volatility-aware SL and TP1–TP4 that scale across instruments/timeframes.
Smart Entry filters (ADX strength, RSI extremes, and distance from recent top/bottom using ATR buffers) seek to avoid low-quality, stretched entries.
Slim history keeps only a short ENTRY stub for prior groups, so the signal you just got is always the most readable.
This is not a mere mashup; each layer constrains the others to produce fewer, clearer setups.
How it works (high-level logic)
Regime (Gann Hi/Lo):
Compute SMA(high, HPeriod) and SMA(low, LPeriod).
Direction state HLv flips when the close crosses above/below its track; one unified Hi/Lo guide is plotted.
Ladder signal (structure + confirmation):
BUY ladder: three consecutive green bars with rising highs and rising lows and HLv == +1.
SELL ladder: mirror conditions with HLv == -1.
Signals evaluate intrabar and are controlled by Smart Entry filters (ADX/RSI/extreme checks).
Risk ladder (R-based or capped):
Default: risk = ATR(atr_len) × SL_multiple and TPs in R.
Optional fixed caps by timeframe (e.g., M1/M5) using USD per point.
Longs: SL = entry – risk; TPi = entry + (Ri × risk).
Shorts: SL = entry + risk; TPi = entry – (Ri × risk).
All levels auto-reflow to the right as bars print.
Chart hygiene:
The latest trade shows ENTRY/SL/TP1–TP4 fully.
Older trades are automatically trimmed (only a short ENTRY line remains, with optional label).
Alerts:
BUY – Smart Entry (Tick) & SELL – Smart Entry (Tick) fire on live-qualified signals.
You can connect alerts to your automation, respecting your broker’s risk controls.
Inputs (English summary of UI)
Label settings: label size; ATR-based vs fixed-tick offsets; leader line width/transparency; horizontal label shift.
Gann Hi/Lo: HIGH Period (HPeriod), LOW Period (LPeriod).
Market filters: ADX (length, smoothing, minimum), RSI (length + caps), recent extremes (lookback + ATR buffer).
Entry/SL/TP Levels: TP1–TP4 (R), label right-shift, show last-trade prices on labels.
Fixed SL Caps: per-timeframe caps (M1/M5) via USD per point.
How to use
Apply on your instrument/timeframe; tune H/L periods and filters to your market (e.g., XAUUSD on M1/M5).
Favor signals aligned with the Hi/Lo regime; tighten filters (higher ADX, stricter RSI caps) to reduce noise.
Choose ATR-Risk or fixed caps depending on your preferences.
The drawing policy ensures the most recent trade remains front-and-center.
Notes & limitations
Signals can evaluate intrabar; MA-based context is inherently lagging.
ATR-based ladders adapt to volatility; extreme spikes can widen risk.
This is a technical analysis tool, not financial advice.
True Range(TR) + Average True Range (ATR) COMBINEDThis indicator combines True Range (TR) and Average True Range (ATR) into a single panel for a clearer understanding of price volatility.
True Range (TR) measures the absolute price movement between highs, lows, and previous closes — showing raw, unsmoothed volatility.
Average True Range (ATR) is a moving average of the True Range, providing a smoother, more stable volatility signal.
📊 Usage Tips:
High TR/ATR values indicate strong price movement or volatility expansion.
Low values suggest compression or a potential volatility breakout zone.
Can be used for stop-loss placement, volatility filters, or trend strength confirmation.
⚙️ Features:
Multiple smoothing methods: RMA, SMA, EMA, WMA.
Adjustable ATR length.
Separate colored plots for TR (yellow) and ATR (red).
Works across all timeframes and instruments.
True Range(TR) & ATR Combined – Volatility Strength IndicatorThis indicator combines True Range (TR) and Average True Range (ATR) into a single panel for a clearer understanding of price volatility.
True Range (TR) measures the absolute price movement between highs, lows, and previous closes — showing raw, unsmoothed volatility.
Average True Range (ATR) is a moving average of the True Range, providing a smoother, more stable volatility signal.
📊 Usage Tips:
High TR/ATR values indicate strong price movement or volatility expansion.
Low values suggest compression or a potential volatility breakout zone.
Can be used for stop-loss placement, volatility filters, or trend strength confirmation.
⚙️ Features:
Multiple smoothing methods: RMA, SMA, EMA, WMA.
Adjustable ATR length.
Separate colored plots for TR (yellow) and ATR (red).
Works across all timeframes and instruments.
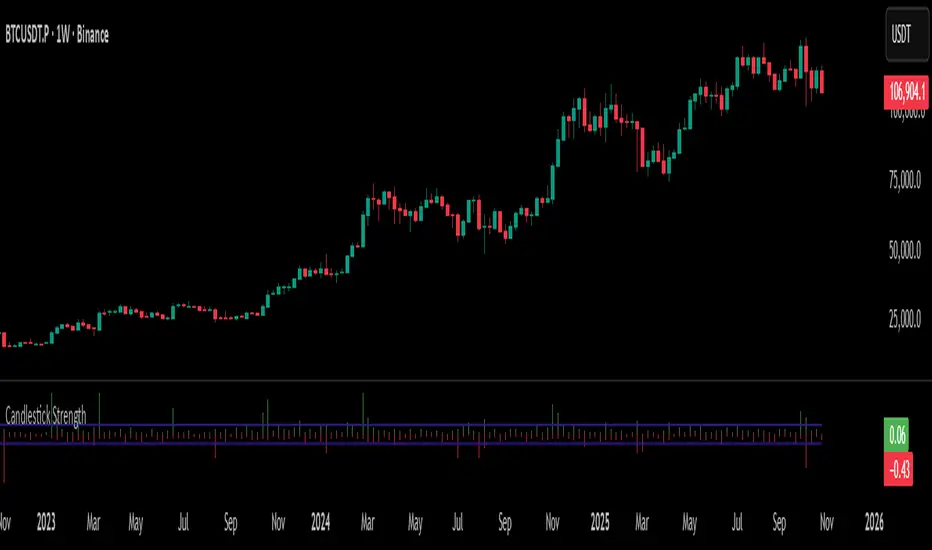
Candlestick StrengthThis indicator quantifies the “energy” of each candlestick by combining its height (high–low span), trading volume, and internal structure (body vs. wick proportions). It provides a numeric measure of how strongly each candle contributes to market momentum, allowing traders to distinguish meaningful price action from indecision or noise.
Concept
Every candlestick represents a short-term contest between buyers and sellers. Large candles with significant volume indicate strong market participation, while small or low-volume candles suggest hesitation or absorption. Candlestick Strength captures this by calculating a normalized measure of each candle’s energy relative to recent activity, making it comparable across different market conditions and timeframes.
The indicator also analyzes the candle’s internal structure:
The body reflects net directional movement.
The wicks represent back-and-forth price traversal within the candle. Because wick movement does not fully contribute to directional momentum, it is weighted at half the body’s contribution. This ensures the indicator emphasizes sustained directional pressure while still acknowledging rejection or absorption.
Interpretation
High values indicate candles with energy above recent averages — suggesting expanding momentum and strong directional intent.
Average values reflect typical candle activity, representing neutral or steady market behavior.
Low values suggest weak candles — either the market is pausing, consolidating, or momentum is fading.
The outputs are displayed as a symmetric histogram: bullish candle energy is shown in green above zero, bearish energy in red below zero, with ±1 reference lines marking the normalized average energy level.
Usage
Combine with trend analysis, swing highs/lows, or volume-weighted averages to validate breakouts or trend continuation.
Monitor for divergence between price movement and candle energy to identify exhaustion, absorption, or potential reversals.
Filter out false momentum signals caused by narrow-range or low-volume candles.
Adaptable across timeframes: normalized energy allows comparison between small and large timeframe candles.
ATR x Trend x Volume SignalsATR x Trend x Volume Signals is a multi-factor indicator that combines volatility, trend, and volume analysis into one adaptive framework. It is designed for traders who use technical confluence and prefer clear, rule-based setups.
🎯 Purpose
This tool identifies high-probability market moments when volatility structure (ATR), momentum direction (CCI-based trend logic), and volume expansion all align. It helps filter out noise and focus on clean, actionable trade conditions.
⚙️ Structure
The indicator consists of three main analytical layers:
1️⃣ ATR Trailing Stop – calculates two adaptive ATR lines (fast and slow) that define volatility context, trend bias, and potential reversal points.
2️⃣ Trend Indicator (CCI + ATR) – uses a CCI-based logic combined with ATR smoothing to determine the dominant trend direction and reduce false flips.
3️⃣ Volume Analysis – evaluates volume deviations from their historical average using standard deviation. Bars are highlighted as medium, high, or extra-high volume depending on intensity.
💡 Signal Logic
A Buy Signal (green) appears when all of the following are true:
• The ATR (slow) line is green.
• The Trend Indicator is blue.
• A bullish candle closes above both the ATR (slow) and the Trend Indicator.
• The candle shows medium, high, or extra-high volume.
A Sell Signal (red) appears when:
• The ATR (slow) line is red.
• The Trend Indicator is red.
• A bearish candle closes below both the ATR (slow) and the Trend Indicator.
• The candle shows medium, high, or extra-high volume.
Only one signal can appear per ATR trend phase. A new signal is generated only after the ATR direction changes.
❌ Exit Logic
Exit markers are shown when price crosses the slow ATR line. This behavior simulates a trailing stop exit. The exit is triggered one bar after entry to prevent same-bar exits.
⏰ Session Filter
Signals are generated only between the user-defined session start and end times (default: 14:00–18:00 chart time). This allows the trader to limit signal generation to active trading hours.
💬 Practical Use
It is recommended to trade with a fixed risk-reward ratio such as 1 : 1.5. Stop-loss placement should be beyond the slow ATR line and adjusted gradually as the trade develops.
For better confirmation, the Trend Indicator timeframe should be higher than the chart timeframe (for example: trading on 1 min → set Trend Indicator timeframe to 15 min; trading on 5 min → set to 1 hour).
🧠 Main Features
• Dual ATR volatility structure (fast and slow)
• CCI-based trend direction filtering
• Volume deviation heatmap logic
• Time-restricted signal generation
• Dynamic trailing-stop exit system
• Non-repainting logic
• Fully optimized for Pine Script v6
📊 Usage Tip
Best results are achieved when combining this indicator with additional technical context such as support-resistance, higher-timeframe confirmation, or market structure analysis.
📈 Credits
Inspired by:
• ATR Trailing Stop by Ceyhun
• Trend Magic by Kivanc Ozbilgic
• Heatmap Volume by xdecow

APXTradez - TTM Squeeze🔹 APXTradez TTM Squeeze — Summary & How To Use It
What this indicator is
- This is a volatility + momentum engine built for options trading.
It does two jobs at the same time:
- Shows when price is coiling and ready to move (volatility compression using Bollinger Bands vs Keltner Channels).
- Shows which side has control (bullish vs bearish momentum, and whether that pressure is growing or cooling off).
- You use it to time entries on explosive directional moves (breakouts/breakdowns) and to avoid dead chop.
1. Volatility / Compression Logic (the dots)
- This script measures how tight price is by comparing:
- Bollinger Bands (BB): tracks standard deviation (volatility).
- Keltner Channels (KC): tracks ATR (true range / movement).
- When the Bollinger Bands get tighter than the Keltner Channels, price is literally getting bottled up. That’s what traders call “a squeeze.”
- This script splits that squeeze into tiers so you know how aggressive it is:
Orange Dot = High Compression
- BB are inside the tightest Keltner channel (kcMultHigh).
- This is the tightest coil. Energy is loaded.
- Translation: “Something is about to happen here. Pay attention.”
Red Dot = Medium Compression
- BB still inside KC, but looser than orange.
- Pressure building, not maxed.
Yellow Dot = Low Compression
- Still compressed, but wider than red.
- Early stage coil.
Black/Dark Dot = Fired / No Compression
- BB are no longer inside KC.
- The squeeze “released.”
- Translation: “The move is now happening.”
So visually, you’ll often see a sequence like:
yellow → red → orange → black.
That’s the life cycle:
Coil tighter and tighter.
Then BOOM: release.
That release is often where traders take entries.
How to trade the dots
- When you see orange dots stacking, you’re in max coil. You prepare, you don’t FOMO-enter yet.
- When the dots flip to black, that means volatility just expanded (squeeze fired).
- You only want to follow that release in the direction of momentum (see histogram section below). Do not blindly buy every “black.”
So:
- Identify compression (orange/red/yellow).
- Wait for “fired” (black).
- Then check: is momentum actually pushing bullish or bearish, or is it weak?
- That prevents chasing fake breaks.
2. Momentum Histogram (the bars)
- The lower histogram measures momentum using a linear regression on price and a smoothed EMA. In simple terms: it’s checking if price is pushing with force or fading.
It splits momentum into four readable states:
Bullish Side
- Bull Rising (Teal Bright)
- Momentum is above 0 and increasing.
Translation: “Buyers are in control and getting stronger.”
- This is the ideal bullish continuation / call side pressure.
Bull Cooling (Teal Faded)
- Momentum is above 0 but starting to slow down.
Translation: “Still bullish, but momentum is losing steam.”
- You can still stay in the trade, but be aware it’s not accelerating anymore.
Bearish Side
- Bear Pressing (Yellow Bright)
- Momentum is below 0 and getting more negative.
Translation: “Sellers are in control and pressure is increasing.”
- Great for puts / downside continuation.
Bear Cooling (Yellow Faded)
- Momentum is below 0 but starting to weaken.
Translation: “Still bearish, but selling force is easing.”
- Possible bottoming / potential reversal building soon.
- There’s also a zero line plotted. That’s your “neutral axis.”
Bars above zero = bullish regime.
Bars below zero = bearish regime.
Cross through zero = possible momentum flip.
How to read the histogram with the dots
- This is where it gets powerful.
Bullish breakout setup (calls):
- You’ve had compression dots (yellow/red/orange).
- Dots flip to black (squeeze fired).
- Histogram is teal and in “Bull Rising” (bright teal above zero and increasing).
→ That means volatility JUST expanded, and buyers are actually in control. That’s your A+ long/bullish continuation scenario.
Bearish breakdown setup (puts):
- You’ve had compression dots.
- Dots flip to black.
- Histogram is “Bear Pressing” (bright yellow below zero, getting more negative).
→ That means the release is to the downside with real selling pressure, not just a fake wick. That’s your A+ put/downside continuation scenario.
3. Timeframe and Trade Intent
This thing is designed to sit in its own lower panel (overlay = false). You watch it like MACD / Squeeze Pro, but cleaner and more obvious.
Recommended for:
- 4H and Daily: locating swings (2–5 day option plays).
- 5m / 15m / 1h: timing entries on liquid names if you’re doing intraday.
Flow is usually:
- Find the setup on a higher timeframe (Daily / 4H squeeze).
- Drop down one timeframe (1H / 15m) and enter on the first bullish or bearish “fire” in the same direction.
- This keeps you from randomly guessing entries.
4. Cheat Sheet (what to actually do)
Calls (bullish swing):
- You see clustered orange/red/yellow dots → stock is coiling.
- Then you get a black dot → squeeze fired.
- At the same time, the histogram turns bright teal (Bull Rising) and stays above zero.
-That’s your “calls / long continuation” look.
Puts (bearish swing):
- Compression dots first.
- Black dot shows up.
- Histogram turns bright yellow (Bear Pressing) and stays below zero.
That’s your “puts / short continuation” look.
Take profit / De-risk signs:
- Bullish but teal fades to dull teal → momentum is cooling.
- Bearish but yellow fades to dull yellow → selling is cooling.
- You’re still in trend, but gas pedal is coming off. That’s when you scale or trail.
5. Why this version is different from generic TTM Squeeze
-Most public squeeze indicators just tell you “in squeeze / out of squeeze” and show one color.
APXTradez version:
- Breaks compression into three levels (high / medium / low) so you know how “charged” the setup is, not just whether a squeeze exists.
- Shows the release (black dot) separately, so you instantly see “the moment it fired.”
- Splits momentum into four states, not two. You don’t just see “above / below zero,” you see:
- Building bullish
- Cooling bullish
- Building bearish
- Cooling bearish
That means you can tell:
“Is momentum gaining or dying?” instead of just “Is it green or red?”
Which is way more useful for options timing.

Volume Sentiment Breakout Channels [AlgoAlpha]🟠 OVERVIEW
This tool visualizes breakout zones based on volume sentiment within dynamic price channels . It identifies high-impact consolidation areas, quantifies buy/sell dominance inside those zones, and then displays real-time shifts in sentiment strength. When the market breaks above or below these sentiment-weighted channels, traders can interpret the event as a change in conviction, not just a technical breakout.
🟠 CONCEPTS
The script builds on two layers of logic:
Channel Detection : A volatility-based algorithm locates price compression areas using normalized highs and lows over a defined lookback. These “boxes” mark accumulation or distribution ranges.
Volume Sentiment Profiling : Each channel is internally divided into small bins, where volume is aggregated and signed by candle direction. This produces a granular sentiment map showing which levels are dominated by buyers or sellers.
When a breakout occurs, the script clears the previous box and forms a new one, letting traders visually track transitions between phases of control. The colored gradients and text updates continuously reflect the internal bias—green for net-buying, red for net-selling—so you can see conviction strength at a glance.
🟠 FEATURES
Volume-weighted sentiment map inside each box, with gradient color intensity proportional to participation.
Dynamic text display of current and overall sentiment within each channel.
Real-time trail lines to show active bullish/bearish trend extensions after breakout.
🟠 USAGE
Setup : Add the script to your chart and enable Strong Closes Only if you prefer cleaner breakouts. Use shorter normalization length (e.g., 50–80) for fast markets; longer (100–200) for smoother transitions.
Read Signals : Transparent boxes mark active sentiment channels. Green gradients show buy-side dominance, red shows sell-side. The middle dashed line is the equilibrium of the channel. “▲” appears when price breaks upward, “▼” when it breaks downward.
Understanding Sentiment : The sentiment profile can be used to show the probability of the price moving up or down at respective price levels.

MTF K-Means Price Regimes [matteovesperi] ⚠️ The preview uses a custom example to identify support/resistance zones. due to the fact that this identifier clusterizes, this is possible. this example was set up "in a hurry", therefore it has a possible inaccuracy. When setting up the indicator, it is extremely important to select the correct parameters and double-check them on the selected history.
📊 OVERVIEW
Purpose
MTF K-Means Price Regimes is a TradingView indicator that automatically identifies and classifies the current market regime based on the K-Means machine learning algorithm. The indicator uses data from a higher timeframe (Multi-TimeFrame, MTF) to build stable classification and applies it to the working timeframe in real-time.
Key Features
✅ Automatic market regime detection — the algorithm finds clusters of similar market conditions
✅ Multi-timeframe (MTF) — clustering on higher TF, application on lower TF
✅ Adaptive — model recalculates when a new HTF bar appears with a rolling window
✅ Non-Repainting — classification is performed only on closed bars
✅ Visualization — bar coloring + information panel with cluster characteristics
✅ Flexible settings — from 2 to 10 clusters, customizable feature periods, HTF selection
━━━━━━━━━━━━━━━━━━━━━━━━━━━━━━━━━━━━━━━━━━━━━━━━━━━━━━━━━━━━━━━━━
🔬 TECHNICAL DETAILS
K-Means Clustering Algorithm
What is K-Means?
K-Means is one of the most popular clustering algorithms (unsupervised machine learning). It divides a dataset into K groups (clusters) so that similar elements are within each cluster, and different elements are between clusters.
Algorithm objective:
Minimize within-cluster variance (sum of squared distances from points to their cluster center).
How Does K-Means Work in Our Indicator?
Step 1: Data Collection
The indicator accumulates history from the higher timeframe (HTF):
RSI (Relative Strength Index) — overbought/oversold indicator
ATR% (Average True Range as % of price) — volatility indicator
ΔP% (Price Change in %) — trend strength and direction indicator
By default, 200 HTF bars are accumulated (clusterLookback parameter).
Step 2: Creating Feature Vectors
Each HTF bar is described by a three-dimensional vector:
Vector =
Step 3: Normalization (Z-Score)
All features are normalized to bring them to a common scale:
Normalized_Value = (Value - Mean) / StdDev
This is critically important, as RSI is in the range 0-100, while ATR% and ΔP% have different scales. Without normalization, one feature would dominate over others.
Step 4: K-Means++ Centroid Initialization
Instead of random selection of K initial centers, an improved K-Means++ method is used:
First centroid is randomly selected from the data
Each subsequent centroid is selected with probability proportional to the square of the distance to the nearest already selected centroid
This ensures better initial centroid distribution and faster convergence
Step 5: Iterative Optimization (Lloyd's Algorithm)
Repeat until convergence (or maxIterations):
1. Assignment step:
For each point find the nearest centroid and assign it to this cluster
2. Update step:
Recalculate centroids as the average of all points in each cluster
3. Convergence check:
If centroids shifted less than 0.001 → STOP
Euclidean distance in 3D space is used:
Distance = sqrt((RSI1 - RSI2)² + (ATR1 - ATR2)² + (ΔP1 - ΔP2)²)
Step 6: Adaptive Update
With each new HTF bar:
The oldest bar is removed from history (rolling window method)
New bar is added to history
K-Means algorithm is executed again on updated data
Model remains relevant for current market conditions
Real-Time Classification
After building the model (clusters + centroids), the indicator works in classification mode:
On each closed bar of the current timeframe, RSI, ATR%, ΔP% are calculated
Feature vector is normalized using HTF statistics (Mean/StdDev)
Distance to all K centroids is calculated
Bar is assigned to the cluster with minimum distance
Bar is colored with the corresponding cluster color
Important: Classification occurs only on a closed bar (barstate.isconfirmed), which guarantees no repainting .
Data Architecture
Persistent variables (var):
├── featureVectors - Normalized HTF feature vectors
├── centroids - Cluster center coordinates (K * 3 values)
├── assignments - Assignment of each HTF bar to a cluster
├── htfRsiHistory - History of RSI values from HTF
├── htfAtrHistory - History of ATR values from HTF
├── htfPcHistory - History of price changes from HTF
├── htfCloseHistory - History of close prices from HTF
├── htfRsiMean, htfRsiStd - Statistics for RSI normalization
├── htfAtrMean, htfAtrStd - Statistics for ATR normalization
├── htfPcMean, htfPcStd - Statistics for Price Change normalization
├── isCalculated - Model readiness flag
└── currentCluster - Current active cluster
All arrays are synchronized and updated atomically when a new HTF bar appears.
Computational Complexity
Data collection: O(1) per bar
K-Means (one pass):
- Assignment: O(N * K) where N = number of points, K = number of clusters
- Update: O(N * K)
- Total: O(N * K * I) where I = number of iterations (usually 5-20)
Example: With N=200 HTF bars, K=5 clusters, I=20 iterations:
200 * 5 * 20 = 20,000 operations (executes quickly)
━━━━━━━━━━━━━━━━━━━━━━━━━━━━━━━━━━━━━━━━━━━━━━━━━━━━━━━━━━━━━━━━━
📖 USER GUIDE
Quick Start
1. Adding the Indicator
TradingView → Indicators → Favorites → MTF K-Means Price Regimes
Or copy the code from mtf_kmeans_price_regimes.pine into Pine Editor.
2. First Launch
When adding the indicator to the chart, you'll see a table in the upper right corner:
┌─────────────────────────┐
│ Status │ Collecting HTF │
├─────────────────────────┤
│ Collected│ 15 / 50 │
└─────────────────────────┘
This means the indicator is accumulating history from the higher timeframe. Wait until the counter reaches the minimum (default 50 bars for K=5).
3. Active Operation
After data collection is complete, the main table with cluster information will appear:
┌────┬──────┬──────┬──────┬──────────────┬────────┐
│ ID │ RSI │ ATR% │ ΔP% │ Description │Current │
├────┼──────┼──────┼──────┼──────────────┼────────┤
│ 1 │ 68.5 │ 2.15 │ 1.2 │ High Vol,Bull│ │
│ 2 │ 52.3 │ 0.85 │ 0.1 │ Low Vol,Flat │ ► │
│ 3 │ 35.2 │ 1.95 │ -1.5 │ High Vol,Bear│ │
└────┴──────┴──────┴──────┴──────────────┴────────┘
The arrow ► indicates the current active regime. Chart bars are colored with the corresponding cluster color.
Customizing for Your Strategy
Choosing Higher Timeframe (HTF)
Rule: HTF should be at least 4 times higher than the working timeframe.
| Working TF | Recommended HTF |
|------------|-----------------|
| 1 min | 15 min - 1H |
| 5 min | 1H - 4H |
| 15 min | 4H - D |
| 1H | D - W |
| 4H | D - W |
| D | W - M |
HTF Selection Effect:
Lower HTF (closer to working TF): More sensitive, frequently changing classification
Higher HTF (much larger than working TF): More stable, long-term regime assessment
Number of Clusters (K)
K = 2-3: Rough division (e.g., "uptrend", "downtrend", "flat")
K = 4-5: Optimal for most cases (DEFAULT: 5)
K = 6-8: Detailed segmentation (requires more data)
K = 9-10: Very fine division (only for long-term analysis with large windows)
Important constraint:
clusterLookback ≥ numClusters * 10
I.e., for K=5 you need at least 50 HTF bars, for K=10 — at least 100 bars.
Clustering Depth (clusterLookback)
This is the rolling window size for building the model.
50-100 HTF bars: Fast adaptation to market changes
200 HTF bars: Optimal balance (DEFAULT)
500-1000 HTF bars: Long-term, stable model
If you get an "Insufficient data" error:
Decrease clusterLookback
Or select a lower HTF (e.g., "4H" instead of "D")
Or decrease numClusters
Color Scheme
Default 10 colors:
Red → Often: strong bearish, high volatility
Orange → Transition, medium volatility
Yellow → Neutral, decreasing activity
Green → Often: strong bullish, high volatility
Blue → Medium bullish, medium volatility
Purple → Oversold, possible reversal
Fuchsia → Overbought, possible reversal
Lime → Strong upward momentum
Aqua → Consolidation, low volatility
White → Undefined regime (rare)
Important: Cluster colors are assigned randomly at each model recalculation! Don't rely on "red = bearish". Instead, look at the description in the table (RSI, ATR%, ΔP%).
You can customize colors in the "Colors" settings section.
━━━━━━━━━━━━━━━━━━━━━━━━━━━━━━━━━━━━━━━━━━━━━━━━━━━━━━━━━━━━━━━━━
⚙️ INDICATOR PARAMETERS
Main Parameters
Higher Timeframe (htf)
Type: Timeframe selection
Default: "D" (daily)
Description: Timeframe on which the clustering model is built
Recommendation: At least 4 times larger than your working TF
Clustering Depth (clusterLookback)
Type: Integer
Range: 50 - 2000
Default: 200
Description: Number of HTF bars for building the model (rolling window size)
Recommendation:
- Increase for more stable long-term model
- Decrease for fast adaptation or if there's insufficient historical data
Number of Clusters (K) (numClusters)
Type: Integer
Range: 2 - 10
Default: 5
Description: Number of market regimes the algorithm will identify
Recommendation:
- K=3-4 for simple strategies (trending/ranging)
- K=5-6 for universal strategies
- K=7-10 only when clusterLookback ≥ 100*K
Max K-Means Iterations (maxIterations)
Type: Integer
Range: 5 - 50
Default: 20
Description: Maximum number of algorithm iterations
Recommendation:
- 10-20 is sufficient for most cases
- Increase to 30-50 if using K > 7
Feature Parameters
RSI Period (rsiLength)
Type: Integer
Default: 14
Description: Period for RSI calculation (overbought/oversold feature)
Recommendation:
- 14 — standard
- 7-10 — more sensitive
- 20-25 — more smoothed
ATR Period (atrLength)
Type: Integer
Default: 14
Description: Period for ATR calculation (volatility feature)
Recommendation: Usually kept equal to rsiLength
Price Change Period (pcLength)
Type: Integer
Default: 5
Description: Period for percentage price change calculation (trend feature)
Recommendation:
- 3-5 — short-term trend
- 10-20 — medium-term trend
Visualization
Show Info Panel (showDashboard)
Type: Checkbox
Default: true
Description: Enables/disables the information table on the chart
Cluster Color 1-10
Type: Color selection
Description: Customize colors for visual cluster distinction
Recommendation: Use contrasting colors for better readability
━━━━━━━━━━━━━━━━━━━━━━━━━━━━━━━━━━━━━━━━━━━━━━━━━━━━━━━━━━━━━━━━━
📊 INTERPRETING RESULTS
Reading the Information Table
┌────┬──────┬──────┬──────┬──────────────┬────────┐
│ ID │ RSI │ ATR% │ ΔP% │ Description │Current │
├────┼──────┼──────┼──────┼──────────────┼────────┤
│ 1 │ 68.5 │ 2.15 │ 1.2 │ High Vol,Bull│ │
│ 2 │ 52.3 │ 0.85 │ 0.1 │ Low Vol,Flat │ ► │
│ 3 │ 35.2 │ 1.95 │ -1.5 │ High Vol,Bear│ │
│ 4 │ 45.0 │ 1.20 │ -0.3 │ Low Vol,Bear │ │
│ 5 │ 72.1 │ 3.05 │ 2.8 │ High Vol,Bull│ │
└────┴──────┴──────┴──────┴──────────────┴────────┘
"ID" Column
Cluster number (1-K). Order doesn't matter.
"RSI" Column
Average RSI value in the cluster (0-100):
< 30: Oversold zone
30-45: Bearish sentiment
45-55: Neutral zone
55-70: Bullish sentiment
> 70: Overbought zone
"ATR%" Column
Average volatility in the cluster (as % of price):
< 1%: Low volatility (consolidation, narrow range)
1-2%: Normal volatility
2-3%: Elevated volatility
> 3%: High volatility (strong movements, impulses)
Compared to the average volatility across all clusters to determine "High Vol" or "Low Vol".
"ΔP%" Column
Average price change in the cluster (in % over pcLength period):
> +0.05%: Bullish regime
-0.05% ... +0.05%: Flat (sideways movement)
< -0.05%: Bearish regime
"Description" Column
Automatic interpretation:
"High Vol, Bull" → Strong upward momentum, high activity
"Low Vol, Flat" → Consolidation, narrow range, uncertainty
"High Vol, Bear" → Strong decline, panic, high activity
"Low Vol, Bull" → Slow growth, low activity
"Low Vol, Bear" → Slow decline, low activity
"Current" Column
Arrow ► shows which cluster the last closed bar of your working timeframe is in.
Typical Cluster Patterns
Example 1: Trend/Flat Division (K=3)
Cluster 1: RSI=65, ATR%=2.5, ΔP%=+1.5 → Bullish trend
Cluster 2: RSI=50, ATR%=0.8, ΔP%=0.0 → Flat/Consolidation
Cluster 3: RSI=35, ATR%=2.3, ΔP%=-1.4 → Bearish trend
Strategy: Open positions when regime changes Flat → Trend, avoid flat.
Example 2: Volatility Breakdown (K=5)
Cluster 1: RSI=72, ATR%=3.5, ΔP%=+2.5 → Strong bullish impulse (high risk)
Cluster 2: RSI=60, ATR%=1.5, ΔP%=+0.8 → Moderate bullish (optimal entry point)
Cluster 3: RSI=50, ATR%=0.7, ΔP%=0.0 → Flat
Cluster 4: RSI=40, ATR%=1.4, ΔP%=-0.7 → Moderate bearish
Cluster 5: RSI=28, ATR%=3.2, ΔP%=-2.3 → Strong bearish impulse (panic)
Strategy: Enter in Cluster 2 or 4, avoid extremes (1, 5).
Example 3: Mixed Regimes (K=7+)
With large K, clusters can represent condition combinations:
High RSI + Low volatility → "Quiet overbought"
Neutral RSI + High volatility → "Uncertainty with high activity"
Etc.
Requires individual analysis of each cluster.
Regime Changes
Important signal: Transition from one cluster to another!
Trading situation examples:
Flat → Bullish trend → Buy signal
Bullish trend → Flat → Take profit, close longs
Flat → Bearish trend → Sell signal
Bearish trend → Flat → Close shorts, wait
You can build a trading system based on the current active cluster and transitions between them.
━━━━━━━━━━━━━━━━━━━━━━━━━━━━━━━━━━━━━━━━━━━━━━━━━━━━━━━━━━━━━━━━━
💡 USAGE EXAMPLES
Example 1: Scalping with HTF Filter
Task: Scalping on 5-minute charts, but only enter in the direction of the daily regime.
Settings:
Working TF: 5 min
HTF: D (daily)
K: 3 (simple division)
clusterLookback: 100
Logic:
IF current cluster = "Bullish" (ΔP% > 0.5)
→ Look for long entry points on 5M
IF current cluster = "Bearish" (ΔP% < -0.5)
→ Look for short entry points on 5M
IF current cluster = "Flat"
→ Don't trade / reduce risk
Example 2: Swing Trading with Volatility Filtering
Task: Swing trading on 4H, enter only in regimes with medium volatility.
Settings:
Working TF: 4H
HTF: D (daily)
K: 5
clusterLookback: 200
Logic:
Allowed clusters for entry:
- ATR% from 1.5% to 2.5% (not too quiet, not too chaotic)
- ΔP% with clear direction (|ΔP%| > 0.5)
Prohibited clusters:
- ATR% > 3% → Too risky (possible gaps, sharp reversals)
- ATR% < 1% → Too quiet (small movements, commissions eat profit)
Example 3: Portfolio Rotation
Task: Managing a portfolio of multiple assets, allocate capital depending on regimes.
Settings:
Working TF: D (daily)
HTF: W (weekly)
K: 4
clusterLookback: 100
Logic:
For each asset in portfolio:
IF regime = "Strong trend + Low volatility"
→ Increase asset weight in portfolio (40-50%)
IF regime = "Medium trend + Medium volatility"
→ Standard weight (20-30%)
IF regime = "Flat" or "High volatility without trend"
→ Minimum weight or exclude (0-10%)
Example 4: Combining with Other Indicators
MTF K-Means as a filter:
Main strategy: MA Crossover
Filter: MTF K-Means on higher TF
Rule:
IF MA_fast > MA_slow AND Cluster = "Bullish regime"
→ LONG
IF MA_fast < MA_slow AND Cluster = "Bearish regime"
→ SHORT
ELSE
→ Don't trade (regime doesn't confirm signal)
This dramatically reduces false signals in unsuitable market conditions.
━━━━━━━━━━━━━━━━━━━━━━━━━━━━━━━━━━━━━━━━━━━━━━━━━━━━━━━━━━━━━━━━━
📈 OPTIMIZATION RECOMMENDATIONS
Optimal Settings for Different Styles
Day Trading
Working TF: 5M - 15M
HTF: 1H - 4H
numClusters: 4-5
clusterLookback: 100-150
Swing Trading
Working TF: 1H - 4H
HTF: D
numClusters: 5-6
clusterLookback: 150-250
Position Trading
Working TF: D
HTF: W - M
numClusters: 4-5
clusterLookback: 100-200
Scalping
Working TF: 1M - 5M
HTF: 15M - 1H
numClusters: 3-4
clusterLookback: 50-100
Backtesting
To evaluate effectiveness:
Load historical data (minimum 2x clusterLookback HTF bars)
Apply the indicator with your settings
Study cluster change history:
- Do changes coincide with actual trend transitions?
- How often do false signals occur?
Optimize parameters:
- If too much noise → increase HTF or clusterLookback
- If reaction too slow → decrease HTF or increase numClusters
Combining with Other Techniques
Regime-Based Approach:
MTF K-Means (regime identification)
↓
+---+---+---+
| | | |
v v v v
Trend Flat High_Vol Low_Vol
↓ ↓ ↓ ↓
Strategy_A Strategy_B Don't_trade
Examples:
Trend: Use trend-following strategies (MA crossover, Breakout)
Flat: Use mean-reversion strategies (RSI, Bollinger Bands)
High volatility: Reduce position sizes, widen stops
Low volatility: Expect breakout, don't open positions inside range
━━━━━━━━━━━━━━━━━━━━━━━━━━━━━━━━━━━━━━━━━━━━━━━━━━━━━━━━━━━━━━━━━
📞 SUPPORT
Report an Issue
If you found a bug or have a suggestion for improvement:
Describe the problem in as much detail as possible
Specify your indicator settings
Attach a screenshot (if possible)
Specify the asset and timeframe where the problem is observed

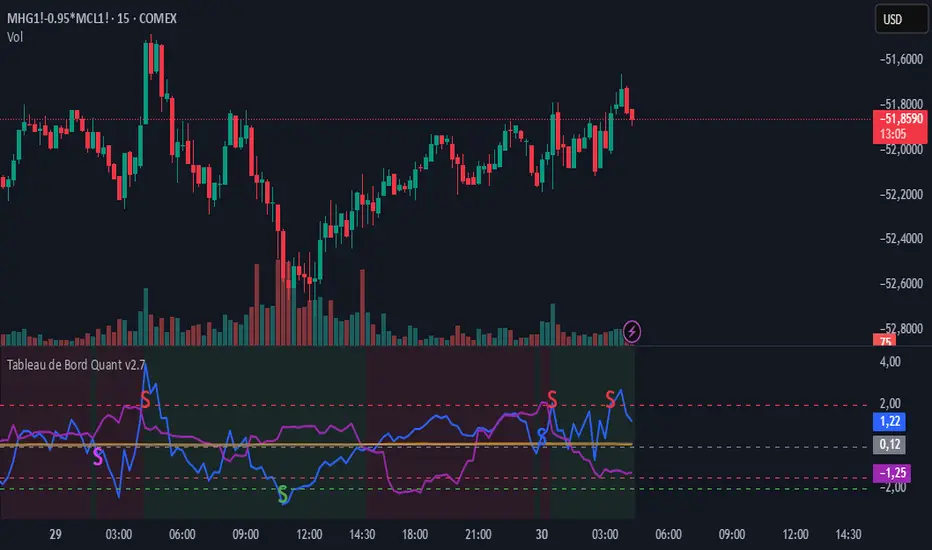
Zscore COrrelation volatility OberlinThis is a complete multi-strategy dashboard for statistical arbitrage (pairs trading). It is designed to solve the biggest challenge in pairs trading: knowing when to trade mean-reversion and when to trade a regime break.
This indicator automatically analyzes the stability of the pair's relationship using two critical filters (a Volatility Ratio filter and a Correlation Z-Score filter). It then provides clear, actionable signals for two opposite strategies based on the current market "regime."
The Regime "Traffic Light" System
The indicator's background color tells you which strategy is currently active.
• 🟢 GREEN Background (Stable Regime): This is the "Mean Reversion" regime. It means both the volatility and correlation filters are stable. The pair is behaving predictably, and you can trust the Z-Score to revert to its mean.
• 🔴 RED Background (Unstable Regime): This is the "Divergence" or "Breakout" regime. It means the pair's relationship has failed (correlation has broken down OR volatility has exploded). In this regime, the Z-Score is not expected to revert and may continue to diverge.
How to Use: The Two Strategies
The indicator will plot text labels on your chart for four specific signals.
📈 Strategy 1: Mean Reversion (Green Regime 🟢)
This is the classic pairs trading strategy. You only take these signals when the background is GREEN.
• LONG Signal: "ACHAT MOYENNE" (Buy Mean)
• What it means: The Z-Score (blue line) has crossed below the lower band (e.g., -2.0) while the regime is stable.
• Your Bet: The spread is statistically "too cheap" and will rise back to the 0-line.
• Action: Buy the Spread (e.g., Buy MES, Sell MNQ).
• SHORT Signal: "VENTE MOYENNE" (Sell Mean)
• What it means: The Z-Score (blue line) has crossed above the upper band (e.g., +2.0) while the regime is stable.
• Your Bet: The spread is statistically "too expensive" and will fall back to the 0-line.
• Action: Sell the Spread (e.g., Sell MES, Buy MNQ).
• Exit Target: Close your position when the Z-Score (blue line) returns to 0.
🚀 Strategy 2: Divergence / Momentum (Red Regime 🔴)
This is a momentum strategy that bets on the continuation of a regime break. These signals appear on the exact bar the background turns RED.
• LONG Signal: "ACHAT ÉCART" (Buy Divergence)
• What it means: The regime just broke (turned RED) at the same time the Z-Score was already rising.
• Your Bet: The pair's relationship is broken, and the spread will continue to "rip" higher, diverging further from the mean.
• Action: Buy the Spread (e.g., Buy MES, Sell MNQ) and hold for momentum.
• SHORT Signal: "VENTE ÉCART" (Sell Divergence)
• What it means: The regime just broke (turned RED) at the same time the Z-Score was already falling.
• Your Bet: The pair's relationship is broken, and the spread will continue to "crash" lower, diverging further from the mean.
• Action: Sell the Spread (e.g., Sell MES, Buy MNQ) and hold for momentum.
• Exit Target: This is a momentum trade, so the exit is not the 0-line. Use a trailing stop or exit when the regime becomes stable again (turns GREEN).
The 3 Indicator Panes
1. Pane 1: Main Dashboard (Signal Pane)
• Z-Score PRIX (Blue Line): Your main signal. Shows the spread's deviation.
• Regime (Background Color): Your "traffic light" (Green for Mean Reversion, Red for Divergence).
• Trade Labels: The explicit entry signals.
2. Pane 2: Volatility Ratio (Diagnostic Pane)
• This pane shows the ratio of the two assets' volatility (Orange Line) vs. its long-term average (Gray Line).
• It is one of the two filters used to decide if the regime is "stable." If the orange line moves too far from the gray line, the regime turns RED.
3. Pane 3: Correlation Z-Score (Diagnostic Pane)
• This is the most critical filter. It measures the Z-Score of the rolling correlation itself.
• If this Purple Line drops below the Red Dashed Line (the "Danger Threshold"), it means the pair's correlation has statistically broken. This is the primary trigger for the RED "Divergence" regime.
Settings
• Symbol 1 & 2 Tickers: Set the two assets for the filters (e.g., "MES1!" and "MNQ1!"). Note: You must still load the spread chart itself (e.g., MES1!-MNQ1!) for the Price Z-Score to work.
• Z-Score Settings: Adjust the lookback period and bands for the Price Z-Score.
• Volatility Filter Settings: Adjust the ATR period, the MA period, and the deviation threshold.
• Correlation Filter Settings: Adjust the lookback periods and the "danger threshold" for the Correlation Z-Score.
Disclaimer: This indicator is for educational and informational purposes only. It does not constitute financial advice. All trading involves significant risk. Past performance is not indicative of future results.
ZScore correlation volatility spread pacThis is a complete multi-strategy dashboard for statistical arbitrage (pairs trading). It is designed to solve the biggest challenge in pairs trading: knowing when to trade mean-reversion and when to trade a regime break.
This indicator automatically analyzes the stability of the pair's relationship using two critical filters (a Volatility Ratio filter and a Correlation Z-Score filter). It then provides clear, actionable signals for two opposite strategies based on the current market "regime."
The Regime "Traffic Light" System
The indicator's background color tells you which strategy is currently active.
• 🟢 GREEN Background (Stable Regime): This is the "Mean Reversion" regime. It means both the volatility and correlation filters are stable. The pair is behaving predictably, and you can trust the Z-Score to revert to its mean.
• 🔴 RED Background (Unstable Regime): This is the "Divergence" or "Breakout" regime. It means the pair's relationship has failed (correlation has broken down OR volatility has exploded). In this regime, the Z-Score is not expected to revert and may continue to diverge.
How to Use: The Two Strategies
The indicator will plot text labels on your chart for four specific signals.
📈 Strategy 1: Mean Reversion (Green Regime 🟢)
This is the classic pairs trading strategy. You only take these signals when the background is GREEN.
• LONG Signal: "ACHAT MOYENNE" (Buy Mean)
• What it means: The Z-Score (blue line) has crossed below the lower band (e.g., -2.0) while the regime is stable.
• Your Bet: The spread is statistically "too cheap" and will rise back to the 0-line.
• Action: Buy the Spread (e.g., Buy MES, Sell MNQ).
• SHORT Signal: "VENTE MOYENNE" (Sell Mean)
• What it means: The Z-Score (blue line) has crossed above the upper band (e.g., +2.0) while the regime is stable.
• Your Bet: The spread is statistically "too expensive" and will fall back to the 0-line.
• Action: Sell the Spread (e.g., Sell MES, Buy MNQ).
• Exit Target: Close your position when the Z-Score (blue line) returns to 0.
🚀 Strategy 2: Divergence / Momentum (Red Regime 🔴)
This is a momentum strategy that bets on the continuation of a regime break. These signals appear on the exact bar the background turns RED.
• LONG Signal: "ACHAT ÉCART" (Buy Divergence)
• What it means: The regime just broke (turned RED) at the same time the Z-Score was already rising.
• Your Bet: The pair's relationship is broken, and the spread will continue to "rip" higher, diverging further from the mean.
• Action: Buy the Spread (e.g., Buy MES, Sell MNQ) and hold for momentum.
• SHORT Signal: "VENTE ÉCART" (Sell Divergence)
• What it means: The regime just broke (turned RED) at the same time the Z-Score was already falling.
• Your Bet: The pair's relationship is broken, and the spread will continue to "crash" lower, diverging further from the mean.
• Action: Sell the Spread (e.g., Sell MES, Buy MNQ) and hold for momentum.
• Exit Target: This is a momentum trade, so the exit is not the 0-line. Use a trailing stop or exit when the regime becomes stable again (turns GREEN).
The 3 Indicator Panes
1. Pane 1: Main Dashboard (Signal Pane)
• Z-Score PRIX (Blue Line): Your main signal. Shows the spread's deviation.
• Regime (Background Color): Your "traffic light" (Green for Mean Reversion, Red for Divergence).
• Trade Labels: The explicit entry signals.
2. Pane 2: Volatility Ratio (Diagnostic Pane)
• This pane shows the ratio of the two assets' volatility (Orange Line) vs. its long-term average (Gray Line).
• It is one of the two filters used to decide if the regime is "stable." If the orange line moves too far from the gray line, the regime turns RED.
3. Pane 3: Correlation Z-Score (Diagnostic Pane)
• This is the most critical filter. It measures the Z-Score of the rolling correlation itself.
• If this Purple Line drops below the Red Dashed Line (the "Danger Threshold"), it means the pair's correlation has statistically broken. This is the primary trigger for the RED "Divergence" regime.
Settings
• Symbol 1 & 2 Tickers: Set the two assets for the filters (e.g., "MES1!" and "MNQ1!"). Note: You must still load the spread chart itself (e.g., MES1!-MNQ1!) for the Price Z-Score to work.
• Z-Score Settings: Adjust the lookback period and bands for the Price Z-Score.
• Volatility Filter Settings: Adjust the ATR period, the MA period, and the deviation threshold.
• Correlation Filter Settings: Adjust the lookback periods and the "danger threshold" for the Correlation Z-Score.
Disclaimer: This indicator is for educational and informational purposes only. It does not constitute financial advice. All trading involves significant risk. Past performance is not indicative of future results.

Fakeout Kavach by Pooja v10📘 Description – Fakeout Kavach by Pooja
Fakeout Kavach by Pooja is a precision-built technical analysis tool designed for structured momentum and divergence evaluation within the RSI pane.
It helps visualize potential exhaustion zones using RSI divergence, ADX trend confirmation, and an integrated VAD (Volume + ATR + Delta) module — ensuring clarity and confirmation-based plotting.
⚙️ Core Functional Modules
1️⃣ RSI & Moving Average Module
Adaptive RSI with real-time color gradients
Optional RSI moving average (yellow) for momentum tracking
Dynamic fill zones showing overbought / oversold areas
Background fill for quick zone visualization
2️⃣ RSI Divergence Detection (Bull / Bear)
Auto-detects pivot-based bullish and bearish divergences
Non-repainting logic confirmed post-pivot formation
Smart line management with automatic cleanup
Visual divergence lines and clear on-chart markers
3️⃣ ADX Trend Confirmation
Adjustable comparison: “Higher than N bars ago” or “Higher than highest of last N”
Confirms directional strength before SB / SS signals are displayed
4️⃣ SB / SS Signal Module
“Signal Bull / Signal Sell” markers confirmed post candle closure
Integrated session-block feature to exclude specific intraday periods
Non-repainting, bar-confirmed signal plotting
5️⃣ VAD (Volume + ATR + Delta) Divergence Engine
Highlights hidden momentum shifts via volatility + volume flow logic
Bullish (B-DV) / Bearish (S-DV) divergence markers plotted at pivot bars
Customizable label or symbol-style visualization
🧩 Built-in Features
Non-repainting structure using barstate confirmation
Optimized for all timeframes and chart types
Lightweight execution with flexible styling options
Modular input control for easy customization
⚠️ Disclaimer
This indicator is for technical analysis and educational purposes only.
It does not provide financial advice, does not predict price direction, and does not guarantee profits or performance.
All trading decisions are the sole responsibility of the user. Always test thoroughly before applying to live markets.

Multi-Mode Seasonality Map [BackQuant]Multi-Mode Seasonality Map
A fast, visual way to expose repeatable calendar patterns in returns, volatility, volume, and range across multiple granularities (Day of Week, Day of Month, Hour of Day, Week of Month). Built for idea generation, regime context, and execution timing.
What is “seasonality” in markets?
Seasonality refers to statistically repeatable patterns tied to the calendar or clock, rather than to price levels. Examples include specific weekdays tending to be stronger, certain hours showing higher realized volatility, or month-end flow boosting volumes. This tool measures those effects directly on your charted symbol.
Why seasonality matters
It’s orthogonal alpha: timing edges independent of price structure that can complement trend, mean reversion, or flow-based setups.
It frames expectations: when a session typically runs hot or cold, you size and pace risk accordingly.
It improves execution: entering during historically favorable windows, avoiding historically noisy windows.
It clarifies context: separating normal “calendar noise” from true anomaly helps avoid overreacting to routine moves.
How traders use seasonality in practice
Timing entries/exits : If Tuesday morning is historically weak for this asset, a mean-reversion buyer may wait for that drift to complete before entering.
Sizing & stops : If 13:00–15:00 shows elevated volatility, widen stops or reduce size to maintain constant risk.
Session playbooks : Build repeatable routines around the hours/days that consistently drive PnL.
Portfolio rotation : Compare seasonal edges across assets to schedule focus and deploy attention where the calendar favors you.
Why Day-of-Week (DOW) can be especially helpful
Flows cluster by weekday (ETF creations/redemptions, options hedging cadence, futures roll patterns, macro data releases), so DOW often encodes a stable micro-structure signal.
Desk behavior and liquidity provision differ by weekday, impacting realized range and slippage.
DOW is simple to operationalize: easy rules like “fade Monday afternoon chop” or “press Thursday trend extension” can be tested and enforced.
What this indicator does
Multi-mode heatmaps : Switch between Day of Week, Day of Month, Hour of Day, Week of Month .
Metric selection : Analyze Returns , Volatility ((high-low)/open), Volume (vs 20-bar average), or Range (vs 20-bar average).
Confidence intervals : Per cell, compute mean, standard deviation, and a z-based CI at your chosen confidence level.
Sample guards : Enforce a minimum sample size so thin data doesn’t mislead.
Readable map : Color palettes, value labels, sample size, and an optional legend for fast interpretation.
Scoreboard : Optional table highlights best/worst DOW and today’s seasonality with CI and a simple “edge” tag.
How it’s calculated (under the hood)
Per bar, compute the chosen metric (return, vol, volume %, or range %) over your lookback window.
Bucket that metric into the active calendar bin (e.g., Tuesday, the 15th, 10:00 hour, or Week-2 of month).
For each bin, accumulate sum , sum of squares , and count , then at render compute mean , std dev , and confidence interval .
Color scale normalizes to the observed min/max of eligible bins (those meeting the minimum sample size).
How to read the heatmap
Color : Greener/warmer typically implies higher mean value for the chosen metric; cooler implies lower.
Value label : The center number is the bin’s mean (e.g., average % return for Tuesdays).
Confidence bracket : Optional “ ” shows the CI for the mean, helping you gauge stability.
n = sample size : More samples = more reliability. Treat small-n bins with skepticism.
Suggested workflows
Pick the lens : Start with Analysis Type = Returns , Heatmap View = Day of Week , lookback ≈ 252 trading days . Note the best/worst weekdays and their CI width.
Sanity-check volatility : Switch to Volatility to see which bins carry the most realized range. Use that to plan stop width and trade pacing.
Check liquidity proxy : Flip to Volume , identify thin vs thick windows. Execute risk in thicker windows to reduce slippage.
Drill to intraday : Use Hour of Day to reveal opening bursts, lunchtime lulls, and closing ramps. Combine with your main strategy to schedule entries.
Calendar nuance : Inspect Week of Month and Day of Month for end-of-month, options-cycle, or data-release effects.
Codify rules : Translate stable edges into rules like “no fresh risk during bottom-quartile hours” or “scale entries during top-quartile hours.”
Parameter guidance
Analysis Period (Days) : 252 for a one-year view. Shorten (100–150) to emphasize the current regime; lengthen (500+) for long-memory effects.
Heatmap View : Start with DOW for robustness, then refine with Hour-of-Day for your execution window.
Confidence Level : 95% is standard; use 90% if you want wider coverage with fewer false “insufficient data” bins.
Min Sample Size : 10–20 helps filter noise. For Hour-of-Day on higher timeframes, consider lowering if your dataset is small.
Color Scheme : Choose a palette with good mid-tone contrast (e.g., Red-Green or Viridis) for quick thresholding.
Interpreting common patterns
Return-positive but low-vol bins : Favorable drift windows for passive adds or tight-stop trend continuation.
Return-flat but high-vol bins : Opportunity for mean reversion or breakout scalping, but manage risk accordingly.
High-volume bins : Better expected execution quality; schedule size here if slippage matters.
Wide CI : Edge is unstable or sample is thin; treat as exploratory until more data accumulates.
Best practices
Revalidate after regime shifts (new macro cycle, liquidity regime change, major exchange microstructure updates).
Use multiple lenses: DOW to find the day, then Hour-of-Day to refine the entry window.
Combine with your core setup signals; treat seasonality as a filter or weight, not a standalone trigger.
Test across assets/timeframes—edges are instrument-specific and may not transfer 1:1.
Limitations & notes
History-dependent: short histories or sparse intraday data reduce reliability.
Not causal: a hot Tuesday doesn’t guarantee future Tuesday strength; treat as probabilistic bias.
Aggregation bias: changing session hours or symbol migrations can distort older samples.
CI is z-approximate: good for fast triage, not a substitute for full hypothesis testing.
Quick setup
Use Returns + Day of Week + 252d to get a clean yearly map of weekday edge.
Flip to Hour of Day on intraday charts to schedule precise entries/exits.
Keep Show Values and Confidence Intervals on while you calibrate; hide later for a clean visual.
The Multi-Mode Seasonality Map helps you convert the calendar from an afterthought into a quantitative edge, surfacing when an asset tends to move, expand, or stay quiet—so you can plan, size, and execute with intent.

XAUUSD Multi-Timeframe Supertrend Alert v2**Indicator Overview: XAUUSD Multi-Timeframe Supertrend Alert v2**
**Core Components:**
1. **Multi-Timeframe Supertrend System**
- Two Supertrend indicators (ST1 & ST2) with customizable timeframes
- ST1 typically set to Daily, ST2 to Weekly as main trend
- Visualized with distinct colors and background fills
2. **Customizable SMA**
- Adjustable period and timeframe
- Plotted as blue line for additional trend reference
3. **Neutral Zone System**
- Creates a neutral line offset from ST1 by customizable tick distance
- Yellow dashed line that adjusts based on ST1 trend direction
- **Alert Conditions:**
- **Test Buy Zone**: Both ST1 & ST2 in uptrend AND price enters neutral zone above ST1
- **Test Sell Zone**: Both ST1 & ST2 in downtrend AND price enters neutral zone below ST1
4. **Distance Lines from ST2**
- Upper/lower lines at customizable tick distance from ST2
- Purple dashed lines with touch alerts
**Trading Signals:**
- **Bullish Signal**: Price above ST2 but below ST1 (potential buy)
- **Bearish Signal**: Price below ST2 but above ST1 (potential sell)
- **Neutral Zone Alerts**: Price enters defined zone when both trends align
- **Line Touch Alerts**: Price touches distance lines from ST2
**Alert System:**
- Limited to 3 consecutive alerts per signal type
- Visual markers (triangles, diamonds, circles)
- Background coloring for signal zones
- Separate alert conditions for each signal type
**Visual Features:**
- Candles colored green/red based on signals
- Clear trend visualization with colored backgrounds
- Real-time alert markers without information table clutter
This indicator provides multi-timeframe trend analysis with precise entry zone detection and comprehensive alert system for XAUUSD trading. SAM89 M15, ST1 (5:10) M5, ST2 ( 1,5:20) H1, Test Buy Sell 7000, Line 15000

SuperTrend Cyan — Split ST & Triple Bands (A/B/C)SuperTrend Cyan — Split ST & Triple Bands (A/B/C)
✨ Concept:
The SuperTrend Cyan indicator expands the classical SuperTrend logic into a split-line + triple-band visualization for clearer structure and volatility mapping.
Instead of a single ATR-based line, this tool separates SuperTrend direction from volatility envelopes (A/B/C), providing a layered view of both regime and range compression.
✨ The design goal:
Preserve the simplicity of SuperTrend
Add volatility context via multi-band envelopes
Provide a compact MTF (Multi-Timeframe) summary for broader trend alignment
✨ How It Works
1. SuperTrend Core (Active & Opposite Lines)
Uses ATR-based bands (Factor × ATR-Length).
Active SuperTrend is plotted according to current regime.
Opposite SuperTrend (optional) shows potential reversal threshold.
2. Triple Band System (A/B/C)
Each band (A, B, C) scales from the median price (hl2) by different ATR multipliers.
A: Outer band (wider, long-range context)
B: Inner band (mid-range activity)
C: Core band (closest to price, short-term compression)
Smoothness can be controlled with EMA.
Uptrend fills are lime-toned, downtrend fills are red-toned, with adjustable opacity (gap intensity).
3. Automatic Directional Switch
When the regime flips from up → down (or vice versa), the overlay automatically switches between lower and upper bands for a clean transition.
4. Multi-Timeframe SuperTrend Table
Displays SuperTrend direction across 5m, 15m, 1h, 4h, and 1D frames.
Green ▲ = Uptrend, Red ▼ = Downtrend.
Useful for checking cross-timeframe trend alignment.
✨ How to Read It
Green SuperTrend + Lime Bands
- Uptrend regime; volatility expanding upward
Red SuperTrend + Red Bands
- Downtrend regime; volatility expanding downward
Narrow gaps (A–C)
- Low volatility / compression (potential squeeze)
Wide gaps
- High volatility / active trend phase
Opposite ST line close to price
- Early warning for regime transition
✨ Practical Use
Identify trend direction (SuperTrend color & line position).
Assess volatility conditions (band width and gap transparency).
Watch for MTF alignment: consistent up/down signals across 1h–4h–1D = strong structural trend.
Combine with momentum indicators (e.g., RSI, DFI, PCI) for confirmation of trend maturity or exhaustion.
✨ Customization Tips
ST Factor / ATR Length
- Adjust sensitivity of SuperTrend direction changes
Band ATR Length
- Controls overall smoothness of volatility envelopes
Band Multipliers (A/B/C)
- Define how wide each volatility band extends
Gap Opacity
- Affects visual contrast between layers
MTF Table
- Enable/disable multi-timeframe display
✨ Educational Value
This script visualizes the interaction between trend direction (SuperTrend) and volatility envelopes, helping traders understand how price reacts within layered ATR zones.
It also introduces a clean MTF (multi-timeframe) perspective — ideal for discretionary and system traders alike.
✨ Disclaimer
This indicator is provided for educational and research purposes only.
It does not constitute financial advice or a trading signal.
Use at your own discretion and always confirm with additional tools.
───────────────────────────────
📘 한국어 설명 (Korean translation below)
───────────────────────────────
✨개념
SuperTrend Cyan 지표는 기존의 SuperTrend를 확장하여,
추세선 분리(Split Line) + 3중 밴드 시스템(Triple Bands) 으로
시장의 구조적 흐름과 변동성 범위를 동시에 시각화합니다.
단순한 SuperTrend의 강점을 유지하면서도,
ATR 기반의 A/B/C 밴드를 통해 변동성 압축·확장 구간을 직관적으로 파악할 수 있습니다.
✨ 작동 방식
1. SuperTrend 코어 (활성/반대 라인)
ATR×Factor를 기반으로 추세선을 계산합니다.
현재 추세 방향에 따라 활성 라인이 표시되고, “Show Opposite” 옵션을 켜면 반대편 경계선도 함께 보입니다.
2. 트리플 밴드 시스템 (A/B/C)
hl2(중간값)를 기준으로 ATR 배수에 따라 세 개의 밴드를 계산합니다.
A: 외곽 밴드 (가장 넓고 장기 구조 반영)
B: 중간 밴드 (중기적 움직임)
C: 코어 밴드 (가격에 가장 근접, 단기 변동성 반영)
EMA 스무딩으로 부드럽게 조정 가능.
업트렌드 구간은 라임색, 다운트렌드는 빨간색 음영으로 표시됩니다.
3. 자동 전환 시스템
추세가 전환될 때(Up ↔ Down), 밴드 오버레이도 자동으로 교체되어 깔끔한 시각적 구조를 유지합니다.
4. MTF SuperTrend 테이블
5m / 15m / 1h / 4h / 1D 프레임별 SuperTrend 방향을 표시합니다.
초록 ▲ = 상승, 빨강 ▼ = 하락.
복수 타임프레임 정렬 확인용으로 유용합니다.
✨ 해석 방법
초록 SuperTrend + 라임 밴드
- 상승 추세 및 확장 구간
빨강 SuperTrend + 레드 밴드
- 하락 추세 및 확장 구간
밴드 폭이 좁음
- 변동성 축소 (스퀴즈)
밴드 폭이 넓음
- 변동성 확장, 추세 강화
반대선이 근접
- 추세 전환 가능성 높음
✨ 활용 방법
SuperTrend 색상으로 추세 방향을 확인
A/B/C 밴드 폭으로 변동성 수준을 판단
MTF 테이블을 통해 복수 타임프레임 정렬 여부 확인
RSI, DFI, PCI 등 다른 지표와 함께 활용 시, 추세 피로·모멘텀 변화를 조기에 파악 가능
✨ 교육적 가치
이 스크립트는 추세 구조(SuperTrend) 와 변동성 레이어(ATR Bands) 의 상호작용을
시각적으로 학습하기 위한 교육용 지표입니다.
또한, MTF 구조를 통해 시장의 “위계적 정렬(hierarchical alignment)”을 쉽게 인식할 수 있습니다.
✨ 면책
이 지표는 교육 및 연구 목적으로만 제공됩니다.
투자 판단의 책임은 사용자 본인에게 있으며, 본 지표는 매매 신호를 보장하지 않습니다.

Directional Flow Index (DFI) — v2.4Directional Flow Index (DFI) — v2.4
✨ 1) What DFI measures (conceptual)
DFI aims to quantify directional flow —i.e., whether trading activity is skewed toward buying (supportive pressure) or selling (resistive pressure) —and then present it as a normalized oscillator that is easy to compare across symbols and timeframes. It is designed to highlight high-confidence thrusts within a prevailing trend and to detect fatigue as momentum decays.
Positive DFI (> 0) : net buy-side pressure dominates.
Negative DFI (< 0) : net sell-side pressure dominates.
Magnitude reflects intensity after de-trending and Z-score normalization.
While multiple “flow” proxies exist, this version emphasizes a True Volume Delta (TVD) workflow (default) that tallies buy vs. sell volume from a lower timeframe (LTF) inside an anchor timeframe bar, producing a more realistic per-bar delta when supported by the symbol’s data.
✨ 2) Core pipeline (how it works)
Flow construction (TVD default).
Using ta.requestVolumeDelta(LTF, Anchor), the script approximates up-volume vs. down-volume inside each anchor bar.
A per-bar delta is derived (with a reset on anchor switches to avoid jumps).
If TVD is unsupported on the symbol, DFI can fall back to synthetic proxies (e.g., Synthetic Delta Volume: (close-low)/(high-low) × vol), but TVD is the intended default.
CVD-style accumulation.
Per-bar delta is cumulatively summed into a running flow line (CVD-like), providing temporal context to the net pressure.
High-pass de-trending + smoothing.
A high-pass step (EMA-based) removes slow drifts (trend bias) from the CVD line.
A short EMA smoothing reduces noise while preserving thrust.
Z-score normalization.
The de-trended series is standardized (rolling mean/std), so DFI readings are comparable across markets/timeframes.
The Signal line is an EMA of DFI and is used for momentum cross checks.
SuperTrend (regime filter).
A lightweight SuperTrend (ATR len=5, factor=6 by default) provides up/down regime.
DFI coloring and alerts can be conditioned on the regime (optional).
Fatigue % (0–100).
Tracks energy (EMA of |DFI|) vs. peak energy (with adaptive half-life decay).
When energy stays far below the decaying peak, Fatigue% rises, suggesting momentum exhaustion.
The decay rate adapts to DFI volatility and regime alignment, so decay is faster when thrusts are misaligned with trend, slower when aligned and orderly.
Gradient highlight (confidence shading).
Histogram color transparency blends three ingredients:
DFI strength (|DFI| vs user-set bands)
Low fatigue (fresher thrusts score higher)
Regime alignment (DFI sign vs SuperTrend direction)
Result: darker bars indicate higher confidence in thrust quality; faint bars warn of weaker, stale, or misaligned pushes.
✨ 3) Interpreting the plots
DFI histogram (columns):
Green above zero for buy-side thrust, Red below zero for sell-side thrust.
Opacity encodes confidence (darker = stronger alignment & lower fatigue).
Signal (line): EMA of DFI used for momentum regime checks.
Zero line: structural reference for thrust crossovers.
Fatigue Table (optional): shows Fatigue%, SuperTrend regime, and selected Flow Method.
✨ 4) Alerts (examples)
Long Thrust: DFI crosses above zero while in Up regime.
Short Thrust: DFI crosses below zero while in Down regime.
Loss of Momentum (Up): DFI crosses below Signal while DFI > 0 (warns of weakening long thrust).
Loss of Momentum (Down): DFI crosses above Signal while DFI < 0 (warns of weakening short thrust).
✨ 5) How to set the TVD Lower TF (important)
TVD needs a sensible LTF/Anchor ratio for balanced accuracy and performance. As a rule of thumb, aim for ~30–120 LTF bars inside one anchor bar:
1h chart → 1–2m LTF (if seconds not available).
4h → 3–5m.
1D → 15–30m.
1W → 1–2h.
1M → 4h–1D.
Notes: Some symbols/exchanges do not provide seconds. Too small an LTF can be heavy/noisy; too large becomes coarse/laggy.
✨ 6) Practical usage patterns
Trend-following entries:
Look for DFI > 0 in Up regime (green) with low Fatigue%, and DFI crossing above zero or above its Signal.
Prefer darker (higher-confidence) histogram bars.
Trend-following exits / de-risking:
Rising Fatigue% toward your high threshold (e.g., 80–90) suggests exhaustion.
DFI vs Signal crosses against your position can be used to scale down.
Avoid chop:
When DFI oscillates around zero with faint bars and Fatigue% rises quickly, quality is low—be selective.
✨ 7) Inputs (summary)
Flow Method: default True Volume Delta (LTF scan); synthetic fallbacks available.
Processing: Detrend length, smoothing EMA, Z-score window, Signal EMA.
Regime: SuperTrend ATR length & factor (default 5 & 6).
Fatigue%: EMA length, base half-life, adaptive volatility coupling (enable/disable, sensitivity).
UI Highlight: strength thresholds, fatigue cap, alignment weights, opacity range.
Table: toggle Fatigue table, decimals, position.
✨ 8) Compatibility & performance notes
TVD requires supported data for the symbol; if unavailable, DFI can switch to synthetic deltas.
Smaller LTFs increase request load and may introduce noise; prefer a balanced ratio.
The indicator is designed to be self-contained; no other overlays are needed to read the outputs.
✨ 9) Limitations and good practice
This is an oscillator, not a price predictor. Extreme values can persist in strong trends.
Normalization (Z-score) makes values comparable, but distributions differ across assets/timeframes.
Always combine with risk management and position sizing; avoid interpreting any single condition as a guarantee.
✨ 10) Disclaimer
This script is for educational purposes only and does not constitute financial advice. Trading involves risk, including possible loss of principal.
---------------------------------------------------------------------------------------------------------------------
한국어 번역 / Korean version below
✨DFI란 무엇인가?
DFI는 시장의 매수·매도 우위를 Flow(흐름) 형태로 분석하여
그 에너지를 정규화된 오실레이터로 표현하는 지표입니다.
가격의 단순 변동이 아니라, “얼마나 일관성 있는 압력(Flow)이 유지되는가”를 보여줍니다.
DFI > 0: 매수세 우위 (상방 압력)
DFI < 0: 매도세 우위 (하방 압력)
값의 크기: 모멘텀의 강도 (Z-score 기반 정규화)
기본 방식인 True Volume Delta (TVD) 는 상위 봉(Anchor) 내부의 하위 타임프레임(LTF) 데이터를 스캔해
실제 매수/매도 체결량 차이를 계산합니다.
이로써 단순 가격 변화가 아닌 실제 체결 흐름의 방향성을 반영합니다.
✨DFI의 계산 과정 (개념적 흐름)
1. Flow 계산 (TVD 또는 대체 방식)
ta.requestVolumeDelta()를 사용하여 상·하위 TF간 볼륨 델타를 계산합니다.
TVD 미지원 심볼은 자동으로 Synthetic Delta Volume 등 대체 방식으로 전환됩니다.
2. 누적(CVD) 구성
Flow를 CVD처럼 누적하여 순매수/순매도 압력을 누적 추적합니다.
3. 고역통과(High-pass) 필터
누적 흐름(CVD)에서 장기 추세 성분을 제거하여 순수한 변동 에너지만 남깁니다.
4. Z-score 정규화
평균과 표준편차로 표준화해 DFI의 크기를 **일정한 스케일(0 중심)**로 만듭니다.
다른 종목·시간대 간 비교가 용이합니다.
5. SuperTrend 레짐(추세 상태) 인식
ATR 기반 ST(기본: Length=5, Factor=6)를 통해 시장이 상승/하락/중립 중 어디에 있는지를 감지합니다.
DFI 컬럼 색상 및 알림은 이 ST 방향에 따라 동작합니다
6. Fatigue% (피로도 지수)
최근 에너지 평균과 역사적 피크(감쇠)를 비교해 0~100%로 “신선도”를 표현합니다.
높을수록 피로한 상태, 낮을수록 신선한 추세.
또한 변동성과 정렬 여부에 따라 Adaptive Half-Life로 감쇠 속도가 자동 조정됩니다.
7. 그라디언트 하이라이트 (Gradient Highlight)
DFI 강도(|DFI|), Fatigue%, 레짐 정렬 상태를 종합해 히스토그램의 투명도를 연속적으로 변화시킵니다.
강하고 신선하며 정렬된 추세일수록 더 진하게 표시, 반대로 약하거나 피로한 구간은 흐리게 표시됩니다.
✨DFI 차트 해석법
DFI 히스토그램 (컬럼):
위로 향한 초록색 = 매수 우위,
아래로 향한 빨강색 = 매도 우위.
진할수록 “신뢰도 높은 흐름(Aligned + Low Fatigue)”
흐릴수록 “노이즈성 움직임 / 피로 구간”
Signal 선:
DFI의 EMA.
DFI와의 교차는 모멘텀 전환 신호로 사용.
Zero 선:
추세 전환의 기준선.
Fatigue Table:
Fatigue%, Regime, Flow Method 정보를 실시간 표시.
✨알림 조건 (Alerts)
DFI Long Thrust: 상승 레짐에서 DFI가 0 위로 돌파.
DFI Short Thrust: 하락 레짐에서 DFI가 0 아래로 돌파.
Loss of Momentum (Up): DFI>0 상태에서 Signal 아래로 하락.
Loss of Momentum (Down): DFI<0 상태에서 Signal 위로 상승.
TVD (True Volume Delta) 설정 가이드
TVD는 Anchor:LowerTF = 약 30~120배 비율이 가장 효율적입니다.
1시간봉 -> 30초~2분
4시간봉 -> 2~8분
일봉(1D) -> 12~48분
주봉(1W) -> 1~4시간
월봉(1M) -> 4시간~ 1일
참고:
일부 거래소는 초 단위를 지원하지 않습니다 → 분 단위로 대체.
너무 짧은 LTF → 과부하/노이즈,
너무 긴 LTF → 신호 지연/정밀도 저하.
✨활용 전략 예시
추세 추종 (Trend-following):
Up Regime에서 DFI>0 & Fatigue% 낮을 때 롱 신호 우선.
DFI가 Signal 위로 돌파하는 시점이 thrust 시작점.
리스크 축소 (De-risking):
Fatigue%가 80~90 이상이면 추세 과열로 간주.
DFI가 Signal을 역방향으로 교차 시 포지션 축소 고려.
횡보 회피:
DFI가 0선 부근에서 얕게 진동하며 흐릿하게 표시될 때는
방향성이 약한 구간 → 진입 회피.
✨한계 및 권장 사용법
TVD는 심볼/거래소의 지원 여부에 따라 제한될 수 있습니다.
Z-score 정규화로 수치 간 비교는 용이하지만, 자산마다 분포 특성이 달라 절대값 해석은 주의 필요.
Fatigue%는 “모멘텀 신선도” 개념이지, 반전 타이밍이 아닙니다.
리스크 관리 및 전략적 컨텍스트 안에서 사용하세요.
✨면책 (Disclaimer)
이 스크립트는 교육용 도구(Educational purpose)이며,
투자 조언(Financial advice)이 아닙니다.
모든 트레이딩에는 손실의 위험이 있으며,
DFI의 신호나 수치가 수익을 보장하지 않습니다.
✨정리
DFI는 단순한 “추세 오실레이터”가 아니라,
에너지의 흐름 + 피로도 + 레짐 정렬이라는 3요소를 결합해
“지속 가능한 방향성”을 시각적으로 표현하는 지표입니다.
즉, 단순한 ‘방향’이 아니라 “추세의 질(Quality)”을 보여주는
새로운 형태의 Flow 분석 도구입니다.

[INVX] Trading Range
Trading Range
The “ Trading Range” indicator visualizes short-term price ranges (typically 1–2 days) based on statistical percentiles of high and low prices relative to the previous day’s close. It provides a clear view of potential support and resistance zones and includes optional EMA overlays for trend context.
Concept & Calculation
Uses the previous daily close as a reference point.
Calculates percentile-based levels for highs and lows over a configurable lookback period.
Plots two resistance zones and two support zones as shaded areas.
Includes up to 3 optional EMA lines for trend visualization.
Trading range zones are designed for daily-based calculations. If the indicator is applied to a chart timeframe larger than 1 day (e.g., weekly, monthly), the trading range zones will not be displayed.
Key Features
Short-Term Trading Range:
Displays zones that reflect short-term price behavior (1–2 days).
Percentile-Based Levels:
Levels are calculated using percentile interpolation for highs and lows.
Historical Lines Option:
Toggle to show past levels for context.
Realtime Calculation update:
Update calculations dynamically with the current bar.
EMA Overlay:
Up to three customizable EMA lines for trend analysis.
Display Line Values:
Option to show level values on the chart with adjustable label size.
Trading Range Settings
Historical Lines: Show or hide past support/resistance levels.
Realtime Calculation: Enable or disable real-time updates.
Display Line Values: Show numeric values for levels.
Size: Adjust label size when values are displayed.
EMA Line Settings
Enable/disable each EMA line.
Configure length and color for each EMA.
Usage Tips
Use the shaded zones as visual reference areas for short-term price interaction.
Combine with other tools such as trend indicators or volume analysis to strengthen the analysis.
Historical lines can help assess how price has reacted to these zones in the past.
Limitations & Disclaimer
This indicator is provided for informational purposes only. It does not constitute financial advice or a recommendation to buy or sell any asset.
Market conditions, asset volatility, and timeframe selection may significantly affect indicator performance.
Users should always validate signals with additional analysis and apply appropriate risk management strategies.
Past performance is not indicative of future results. Use indicator at your own discretion and risk.
Under no circumstances shall InnovestX be liable for any loss or damage you or anyone else incur as a result of any trading or investment activity that you or anyone else engages in based on any information or material you receive through InnovestX or TradingView.

pine script tradingbot - many ema oscillator## 🧭 **Many EMA Oscillator (TradingView Pine Script Indicator)**
*A multi-layer EMA differential oscillator for trend strength and momentum analysis*
---
### 🧩 **Overview**
The **Many EMA Oscillator** is a **TradingView Pine Script indicator** designed to help traders visualize **trend direction**, **momentum strength**, and **multi-timeframe EMA alignment** in one clean oscillator panel.
It’s a **custom EMA-based trend indicator** that shows how fast or slow different **Exponential Moving Averages (EMAs)** are expanding or contracting — helping you identify **bullish and bearish momentum shifts** early.
This **Pine Script EMA indicator** is especially useful for traders looking to combine multiple **EMA signals** into one **momentum oscillator** for better clarity and precision.
---
### ⚙️ **How It Works**
1. **Multiple EMA Layers:**
The indicator calculates seven **EMAs** (default: 20, 50, 100, 150, 200, 300) and applies a **smoothing filter** using another EMA (default smoothing = 20).
This removes short-term noise and gives a smoother, professional-grade momentum reading.
2. **EMA Gap Analysis:**
The oscillator measures the **difference between consecutive EMAs**, revealing how trend layers are separating or converging.
```
diff1 = EMA(20) - EMA(50)
diff2 = EMA(50) - EMA(100)
diff3 = EMA(100) - EMA(150)
diff4 = EMA(150) - EMA(200)
diff5 = EMA(200) - EMA(300)
```
These gaps (or “differentials”) show **trend acceleration or compression**, acting like a **multi-EMA MACD system**.
3. **Color-Coded Visualization:**
Each differential (`diff1`–`diff5`) is plotted as a **histogram**:
- 🟢 **Green bars** → EMAs expanding → bullish momentum growing
- 🔴 **Red bars** → EMAs contracting → bearish momentum or correction
This gives a clean, compact view of **trend strength** without cluttering your chart.
4. **Automatic Momentum Signals:**
- **🟡 Up Triangle** → All EMA gaps increasing → strong bullish trend alignment
- **⚪ Down Triangle** → All EMA gaps decreasing → trend weakening or bearish transition
---
### 📊 **Inputs**
| Input | Default | Description |
|-------|----------|-------------|
| `smmoth_emas` | 20 | Smoothing factor for all EMAs |
| `Length2`–`Length7` | 20–300 | Adjustable EMA periods |
| `Length21`, `Length31`, `Length41`, `Length51` | Optional | For secondary EMA analysis |
---
### 🧠 **Interpretation Guide**
| Observation | Meaning |
|--------------|----------|
| Increasing green bars | Trend acceleration and bullish continuation |
| Decreasing red bars | Trend exhaustion or sideways consolidation |
| Yellow triangles | All EMA layers aligned bullishly |
| White triangles | All EMA layers aligned bearishly |
This **EMA oscillator for TradingView** simplifies **multi-EMA trading strategies** by showing alignment strength in one place.
It works great for **swing traders**, **scalpers**, and **trend-following systems**.
---
### 🧪 **Best Practices for Use**
- Works on **all TradingView timeframes** (1m, 5m, 1h, 1D, etc.)
- Suitable for **stocks, forex, crypto, and indices**
- Combine with **RSI**, **MACD**, or **price action** confirmation
- Excellent for detecting **EMA compression zones**, **trend continuation**, or **momentum shifts**
- Can be used as part of a **multi-EMA trading strategy** or **trend strength indicator setup**
---
### 💡 **Why It Stands Out**
- 100% built in **Pine Script v6**
- Optimized for **smooth EMA transitions**
- Simple color-coded momentum visualization
- Professional-grade **multi-timeframe trend oscillator**
This is one of the most **lightweight and powerful EMA oscillators** available for TradingView users who prefer clarity over clutter.
---
### ⚠️ **Disclaimer**
This indicator is published for **educational and analytical purposes only**.
It does **not provide financial advice**, buy/sell signals, or investment recommendations.
Always backtest before live use and trade responsibly.
---
### 👨💻 **Author**
Developed by **@algo_coders**
Built in **Pine Script v6** on **TradingView**
Licensed under the (mozilla.org)

Wave Conflict DetectorWave Conflict Detector
Wave Conflict Detector: Identifying Pivot Conditions Through Wave Interference Analysis
Wave Conflict Detector applies wave interference principles from physics to dual-EMA analysis, identifying potential pivot conditions by measuring phase relationships and amplitude states between two moving average waves. Unlike traditional EMA crossover systems that signal on wave intersection, this indicator measures the directional alignment (phase) and interaction strength (interference amplitude) between wave states to identify conditions where wave mechanics suggest potential reversal zones.
The indicator combines two analytical components: velocity-based phase difference calculation that measures whether waves are moving in the same or opposite directions, and normalized interference amplitude that quantifies the degree of wave reinforcement or cancellation. This creates a regime-classification system with visual feedback showing when waves are aligned (constructive state) versus opposed (destructive state).
What Makes This Approach Different
Phase Relationship Measurement
The core analytical method is extracting phase alignment from wave velocities rather than simply measuring EMA separation. The system calculates the first derivative (bar-to-bar change) of each EMA, creating velocity measurements: v₁ = ψ₁ - ψ₁ and v₂ = ψ₂ - ψ₂ . These velocities are combined through normalized correlation: Φ = (v₁ × v₂) / |v|², producing an alignment value ranging from -1 (perfect opposition) to +1 (perfect alignment).
This alignment value is smoothed using EMA and converted to angular degrees: Δφ = (1 - Φ) × 90°, creating a phase difference measurement from 0° to 180°. This quantifies how much the waves are "fighting" each other directionally, independent of their separation distance. Two EMAs can be far apart yet moving in harmony (low phase difference), or close together yet moving in opposition (high phase difference).
This directional correlation approach differs from standard dual-EMA analysis by focusing on velocity alignment rather than positional crossovers.
Interference Amplitude Calculation
The interference formula implements wave superposition principles: I = (|ψ₁ + ψ₂|² - |ψ₁ - ψ₂|²) × Gain, which mathematically simplifies to I = 4 × ψ₁ × ψ₂ × Gain. This measures the product of both waves—when both are positive and large, interference is maximally constructive; when they have opposite signs or differing magnitudes, interference weakens.
The raw interference value is then normalized using adaptive statistical bounds calculated over a rolling window (default 100 bars). The system computes mean (μ) and standard deviation (σ) of raw interference, then applies bounds of μ ± 2σ, and normalizes to a 0-1 range. This creates a scale-invariant measurement that adapts automatically to different instruments and volatility regimes without requiring manual recalibration.
The combination of phase measurement and normalized amplitude creates a two-dimensional state space for classifying market conditions.
Dual-Mode Detection Architecture
The system offers two detection approaches that can be selected based on market conditions:
Interference Mode: Detects pivot conditions when normalized interference amplitude forms local peaks or troughs (current bar is higher/lower than both adjacent bars) AND exceeds the configured threshold. This identifies extremes in wave interaction strength.
Phase Mode: Detects pivot conditions when phase alignment reverses (crosses from positive to negative or vice versa) AND absolute phase difference exceeds the threshold. This identifies directional relationship changes between waves.
Both modes require price structure confirmation (traditional pivot high/low patterns) and minimum bar spacing to prevent over-signaling. This architecture allows traders to match detection sensitivity to market character—interference mode for amplitude-driven markets, phase mode for directional trend shifts.
Multi-Layer Visual System
The visualization approach uses hierarchical layers to display wave state information:
Foundation Layer: The two EMA waves (ψ₁ and ψ₂) plotted directly on the price chart, showing the underlying wave states being analyzed.
Background Layer: Color-coded zones showing regime state—green tint when phase alignment is positive (constructive interference), red tint when phase alignment is negative below -0.3 (destructive interference).
Dynamic Ribbon: A band centered on the wave average with width proportional to |ψ₁ - ψ₂| × (0.5 + interference_norm). This creates an adaptive channel that expands with interference strength and contracts during low-energy states.
Phase Field: Multi-frequency harmonic oscillations generated using three phase accumulators driven by interference amplitude, phase alignment, and accumulated phase rotation. Multiple sine-wave layers create visual texture that becomes erratic during wave conflict conditions and smooth during aligned states.
Particle System: Floating symbols whose density is proportional to interference amplitude, creating a visual intensity indicator.
Each visual component displays non-redundant information about the wave state system.
Core Calculation Methodology
Wave State Generation
Two exponential moving averages are calculated using configurable lengths (default 8 and 21 bars):
- ψ₁ = EMA(close, fastLen) — fast wave component
- ψ₂ = EMA(close, slowLen) — slow wave component
These serve as the base wave functions for all subsequent analysis.
Velocity Extraction
First derivatives are computed as simple bar-to-bar differences:
- psi1_velocity = ψ₁ - ψ₁
- psi2_velocity = ψ₂ - ψ₂
These represent the "motion" of each wave through price-time space.
Phase Alignment Calculation
The velocity product and magnitude are calculated:
- velocity_product = v₁ × v₂
- velocity_magnitude = √(v₁² + v₂²)
Phase alignment is computed as:
- phase_alignment = velocity_product / (velocity_magnitude²)
This is smoothed using EMA of configurable length (default 5) and converted to degrees:
- phase_degrees = (1 - phase_alignment_smooth) × 90
Interference Amplitude Processing
Raw interference is calculated:
- interference_raw = (constructive_amplitude - destructive_amplitude) × gain
- where constructive_amplitude = (ψ₁ + ψ₂)²
- and destructive_amplitude = (ψ₁ - ψ₂)²
Statistical normalization is applied:
- interference_mean = SMA(interference_raw, normalizationLen)
- interference_std = StdDev(interference_raw, normalizationLen)
- upper_bound = mean + 2 × std
- lower_bound = mean - 2 × std
- interference_norm = (interference_raw - lower_bound) / (upper_bound - lower_bound), clamped to
State Classification
Three regime states are identified:
- Constructive: phase_alignment_smooth > 0 (waves moving in same direction)
- Destructive: phase_alignment_smooth < -0.3 (waves moving in opposite directions)
- Neutral: phase_alignment between -0.3 and 0 (weak directional correlation)
Pivot Detection Logic
In Interference Mode:
- High pivots: interference_norm > interference_norm AND interference_norm > interference_norm AND interference_norm > threshold AND price forms pivot high AND spacing requirement met
- Low pivots: interference_norm shows local trough using opposite conditions
In Phase Mode:
- Pivots: phase alignment reverses sign AND absolute phase_degrees > threshold AND price forms pivot high/low AND spacing requirement met
All conditions must be true for a signal to generate.
Dashboard Metrics System
The dashboard displays real-time calculations:
- I (Interference): Normalized amplitude shown as bar gauge and percentage
- Δφ (Phase): Phase difference shown as bar gauge and degrees
- ψ₁ and ψ₂: Current wave values in price units
- Wave Separation: |ψ₁ - ψ₂| with directional indicator
- STATE: Current regime classification (CONSTRUCTIVE/DESTRUCTIVE/NEUTRAL)
- PIVOT Probability: Composite score calculated as interference_norm × (phase_degrees/180) × 100
The interference matrix shows historical heatmap data across four metrics (interference amplitude, phase difference, constructive flags, destructive flags) over the configurable number of bars.
How to Use This Indicator
Initial Configuration
Apply the indicator to your chart with default settings. The fast wave length (default 8) should be adjusted to match short-term price swings for your instrument and timeframe. The slow wave length (default 21) should be 2-4 times the fast length to create adequate wave separation. Enable the dashboard (recommended position: top right) to monitor regime state and metrics in real-time.
Signal Interpretation
High Pivot Marker (▼ Red Triangle): Appears above price bars when a bearish pivot condition is detected. This indicates that price formed a swing high, the selected detection criteria were met (interference peak or phase reversal depending on mode), threshold requirements were satisfied, and the minimum spacing filter passed. This represents a potential reversal zone where wave mechanics suggest downward directional change conditions.
Low Pivot Marker (▲ Green Triangle): Appears below price bars when a bullish pivot condition is detected. This indicates that price formed a swing low and all detection criteria aligned. This represents a potential reversal zone where wave mechanics suggest upward directional change conditions.
Dashboard STATE Reading
The STATE field shows current wave relationship:
- "🟢 CONSTRUCTIVE": Waves are moving in the same direction (phase alignment positive). This suggests trend continuation conditions where waves are reinforcing each other.
- "🔴 DESTRUCTIVE": Waves are moving in opposite directions (phase alignment below -0.3). This suggests reversal-prone conditions where waves are conflicting.
- "🟡 NEUTRAL": Weak directional correlation between waves. This suggests ranging or transitional conditions.
Use STATE for regime awareness rather than specific entry signals.
Interference and Phase Metrics
Monitor the I (Interference) percentage:
- Above 70%: High amplitude state, significant wave interaction
- 40-70%: Moderate amplitude state
- Below 40%: Low amplitude state, weak interaction
Monitor the Δφ (Phase) degrees:
- Above 120°: Significant wave opposition (destructive conditions)
- 60-120°: Transitional phase relationship
- Below 60°: Wave alignment (constructive conditions)
The PIVOT probability metric combines both: high values (>70%) indicate conditions where both amplitude and phase suggest elevated pivot formation potential.
Trading Workflow Example
Step 1 - Regime Check: Observe dashboard STATE to understand current wave relationship. CONSTRUCTIVE states favor trend-following approaches, DESTRUCTIVE states suggest reversal-prone conditions.
Step 2 - Metric Monitoring: Watch I% and Δφ values. Rising interference with high phase difference indicates building wave conflict.
Step 3 - Visual Confirmation: Observe amplitude ribbon width (expanding = active state) and phase field texture (chaotic = conflict conditions, smooth = aligned conditions).
Step 4 - Signal Wait: Wait for confirmed pivot marker (▼ or ▲) rather than anticipating based on metrics alone. The marker indicates all detection criteria have aligned.
Step 5 - Entry Decision: Use pivot markers as potential reversal zones. Combine with other analysis methods such as support/resistance levels, volume confirmation, and higher timeframe bias for entry decisions.
Step 6 - Risk Management: Place stops beyond recent swing structure or ribbon edges. Monitor dashboard STATE—if it flips to CONSTRUCTIVE in trade direction, the reversal may be confirmed; if PIVOT% drops significantly, conditions may be weakening.
Step 7 - Exit Criteria: Consider exits when opposite pivot marker appears, STATE changes unfavorably, or standard technical targets are reached.
Parameter Optimization Guidelines
Fast Wave Length: Adjust to match short-term swing frequency. Shorter values (5-8) for active trading on lower timeframes, longer values (13-20) for swing trading on higher timeframes.
Slow Wave Length: Should maintain 2-4x ratio with fast length. Shorter values create more interference cycles, longer values create more stable baseline.
Phase Detection Length: Smoothing for phase alignment. Lower values (3-5) for responsive detection, higher values (8-12) for stable readings with less sensitivity.
Interference Gain: Amplification multiplier. Lower values (0.5-1.0) for conservative detection, higher values (1.5-2.5) for more sensitive detection.
Normalization Period: Rolling window for statistical bounds. Shorter periods (50-100) adapt quickly to volatility changes, longer periods (150-300) provide more stable normalization.
Interference Threshold: Minimum amplitude to trigger signals. Lower values (0.50-0.60) generate more signals, higher values (0.70-0.85) are more selective.
Phase Threshold: Minimum phase difference in degrees. Lower values (90-110) are more permissive, higher values (140-170) require stronger opposition.
Min Pivot Spacing: Bars between signals. Match to average swing duration on your timeframe—tighter spacing (3-8 bars) for scalping, wider spacing (15-30 bars) for swing trading.
Best Performance Conditions
This approach works better in markets with:
- Clear swing structure where EMA-based wave analysis is meaningful
- Sufficient volatility for wave separation to develop
- Periodic oscillation between trending and ranging states
- Liquid instruments where EMAs reflect true price flow
This approach may be less effective in:
- Extremely choppy conditions with no directional persistence
- Very low volatility environments where wave separation is minimal
- Gap-heavy instruments where price discontinuities disrupt wave continuity
- Parabolic moves where waves cannot keep pace with price velocity
The system adapts by reducing signal frequency in poor conditions—when interference stays below threshold or phase alignment remains neutral, pivot markers will not appear.
Visual Performance Optimization
The phase field and particle systems are computationally intensive. If experiencing chart lag:
- Reduce Phase Field Layers from 5 to 2-3 (significant performance improvement)
- Lower Particle Density from 3 to 1 (reduces label creation overhead)
- Disable Phase Field entirely (removes most intensive calculations)
- Decrease Matrix History Bars to 15-20 (reduces table computation load)
The core wave analysis and pivot detection continue to function with all visual elements disabled.
Important Disclaimers
This indicator is an analytical tool that measures phase relationships and interference amplitude between two exponential moving averages. It identifies conditions where these wave mechanics suggest potential pivot zones based on historical price data analysis. It should not be used as a standalone trading system.
The phase and interference calculations are deterministic mathematical formulas applied to EMA values. These measurements describe current and historical wave relationships but do not predict future price movements. Past wave patterns and pivot markers do not guarantee future market behavior will follow similar patterns.
All trading involves risk. The pivot markers represent analytical conditions where wave mechanics align with specific thresholds, not certainty of directional change. Use appropriate risk management, position sizing, and combine with additional confirmation methods such as support/resistance analysis, volume patterns, and multi-timeframe alignment. No indicator can eliminate false signals or guarantee profitable trades.
The spacing filter and threshold requirements are designed to reduce noise and over-signaling, but market conditions can change rapidly and render any analytical signal invalid. Always use stop losses and never risk capital you cannot afford to lose.
Technical Implementation Notes
All calculations execute on closed bars only—there is no repainting of signals or values. The normalization system requires approximately 100 bars of historical data to establish stable statistical bounds; values in the first 50-100 bars may be unstable as the rolling statistics converge.
Phase field arrays are fixed-size based on the complexity setting. Particle labels are capped at 80 total to prevent excessive memory usage. Dashboard and matrix tables update only on the last bar to minimize computational overhead. Particle generation is throttled to every 2 bars for performance. Phase accumulators use modulo arithmetic (% 2π) to prevent numerical overflow during extended operation.
The indicator has been tested across multiple timeframes (5-minute through daily) and multiple asset classes (forex, stocks, crypto, indices). It functions identically across all instruments due to the adaptive normalization approach.

Quantum Rotational Field MappingQuantum Rotational Field Mapping (QRFM):
Phase Coherence Detection Through Complex-Plane Oscillator Analysis
Quantum Rotational Field Mapping applies complex-plane mathematics and phase-space analysis to oscillator ensembles, identifying high-probability trend ignition points by measuring when multiple independent oscillators achieve phase coherence. Unlike traditional multi-oscillator approaches that simply stack indicators or use boolean AND/OR logic, this system converts each oscillator into a rotating phasor (vector) in the complex plane and calculates the Coherence Index (CI) —a mathematical measure of how tightly aligned the ensemble has become—then generates signals only when alignment, phase direction, and pairwise entanglement all converge.
The indicator combines three mathematical frameworks: phasor representation using analytic signal theory to extract phase and amplitude from each oscillator, coherence measurement using vector summation in the complex plane to quantify group alignment, and entanglement analysis that calculates pairwise phase agreement across all oscillator combinations. This creates a multi-dimensional confirmation system that distinguishes between random oscillator noise and genuine regime transitions.
What Makes This Original
Complex-Plane Phasor Framework
This indicator implements classical signal processing mathematics adapted for market oscillators. Each oscillator—whether RSI, MACD, Stochastic, CCI, Williams %R, MFI, ROC, or TSI—is first normalized to a common scale, then converted into a complex-plane representation using an in-phase (I) and quadrature (Q) component. The in-phase component is the oscillator value itself, while the quadrature component is calculated as the first difference (derivative proxy), creating a velocity-aware representation.
From these components, the system extracts:
Phase (φ) : Calculated as φ = atan2(Q, I), representing the oscillator's position in its cycle (mapped to -180° to +180°)
Amplitude (A) : Calculated as A = √(I² + Q²), representing the oscillator's strength or conviction
This mathematical approach is fundamentally different from simply reading oscillator values. A phasor captures both where an oscillator is in its cycle (phase angle) and how strongly it's expressing that position (amplitude). Two oscillators can have the same value but be in opposite phases of their cycles—traditional analysis would see them as identical, while QRFM sees them as 180° out of phase (contradictory).
Coherence Index Calculation
The core innovation is the Coherence Index (CI) , borrowed from physics and signal processing. When you have N oscillators, each with phase φₙ, you can represent each as a unit vector in the complex plane: e^(iφₙ) = cos(φₙ) + i·sin(φₙ).
The CI measures what happens when you sum all these vectors:
Resultant Vector : R = Σ e^(iφₙ) = Σ cos(φₙ) + i·Σ sin(φₙ)
Coherence Index : CI = |R| / N
Where |R| is the magnitude of the resultant vector and N is the number of active oscillators.
The CI ranges from 0 to 1:
CI = 1.0 : Perfect coherence—all oscillators have identical phase angles, vectors point in the same direction, creating maximum constructive interference
CI = 0.0 : Complete decoherence—oscillators are randomly distributed around the circle, vectors cancel out through destructive interference
0 < CI < 1 : Partial alignment—some clustering with some scatter
This is not a simple average or correlation. The CI captures phase synchronization across the entire ensemble simultaneously. When oscillators phase-lock (align their cycles), the CI spikes regardless of their individual values. This makes it sensitive to regime transitions that traditional indicators miss.
Dominant Phase and Direction Detection
Beyond measuring alignment strength, the system calculates the dominant phase of the ensemble—the direction the resultant vector points:
Dominant Phase : φ_dom = atan2(Σ sin(φₙ), Σ cos(φₙ))
This gives the "average direction" of all oscillator phases, mapped to -180° to +180°:
+90° to -90° (right half-plane): Bullish phase dominance
+90° to +180° or -90° to -180° (left half-plane): Bearish phase dominance
The combination of CI magnitude (coherence strength) and dominant phase angle (directional bias) creates a two-dimensional signal space. High CI alone is insufficient—you need high CI plus dominant phase pointing in a tradeable direction. This dual requirement is what separates QRFM from simple oscillator averaging.
Entanglement Matrix and Pairwise Coherence
While the CI measures global alignment, the entanglement matrix measures local pairwise relationships. For every pair of oscillators (i, j), the system calculates:
E(i,j) = |cos(φᵢ - φⱼ)|
This represents the phase agreement between oscillators i and j:
E = 1.0 : Oscillators are in-phase (0° or 360° apart)
E = 0.0 : Oscillators are in quadrature (90° apart, orthogonal)
E between 0 and 1 : Varying degrees of alignment
The system counts how many oscillator pairs exceed a user-defined entanglement threshold (e.g., 0.7). This entangled pairs count serves as a confirmation filter: signals require not just high global CI, but also a minimum number of strong pairwise agreements. This prevents false ignitions where CI is high but driven by only two oscillators while the rest remain scattered.
The entanglement matrix creates an N×N symmetric matrix that can be visualized as a web—when many cells are bright (high E values), the ensemble is highly interconnected. When cells are dark, oscillators are moving independently.
Phase-Lock Tolerance Mechanism
A complementary confirmation layer is the phase-lock detector . This calculates the maximum phase spread across all oscillators:
For all pairs (i,j), compute angular distance: Δφ = |φᵢ - φⱼ|, wrapping at 180°
Max Spread = maximum Δφ across all pairs
If max spread < user threshold (e.g., 35°), the ensemble is considered phase-locked —all oscillators are within a narrow angular band.
This differs from entanglement: entanglement measures pairwise cosine similarity (magnitude of alignment), while phase-lock measures maximum angular deviation (tightness of clustering). Both must be satisfied for the highest-conviction signals.
Multi-Layer Visual Architecture
QRFM includes six visual components that represent the same underlying mathematics from different perspectives:
Circular Orbit Plot : A polar coordinate grid showing each oscillator as a vector from origin to perimeter. Angle = phase, radius = amplitude. This is a real-time snapshot of the complex plane. When vectors converge (point in similar directions), coherence is high. When scattered randomly, coherence is low. Users can see phase alignment forming before CI numerically confirms it.
Phase-Time Heat Map : A 2D matrix with rows = oscillators and columns = time bins. Each cell is colored by the oscillator's phase at that time (using a gradient where color hue maps to angle). Horizontal color bands indicate sustained phase alignment over time. Vertical color bands show moments when all oscillators shared the same phase (ignition points). This provides historical pattern recognition.
Entanglement Web Matrix : An N×N grid showing E(i,j) for all pairs. Cells are colored by entanglement strength—bright yellow/gold for high E, dark gray for low E. This reveals which oscillators are driving coherence and which are lagging. For example, if RSI and MACD show high E but Stochastic shows low E with everything, Stochastic is the outlier.
Quantum Field Cloud : A background color overlay on the price chart. Color (green = bullish, red = bearish) is determined by dominant phase. Opacity is determined by CI—high CI creates dense, opaque cloud; low CI creates faint, nearly invisible cloud. This gives an atmospheric "feel" for regime strength without looking at numbers.
Phase Spiral : A smoothed plot of dominant phase over recent history, displayed as a curve that wraps around price. When the spiral is tight and rotating steadily, the ensemble is in coherent rotation (trending). When the spiral is loose or erratic, coherence is breaking down.
Dashboard : A table showing real-time metrics: CI (as percentage), dominant phase (in degrees with directional arrow), field strength (CI × average amplitude), entangled pairs count, phase-lock status (locked/unlocked), quantum state classification ("Ignition", "Coherent", "Collapse", "Chaos"), and collapse risk (recent CI change normalized to 0-100%).
Each component is independently toggleable, allowing users to customize their workspace. The orbit plot is the most essential—it provides intuitive, visual feedback on phase alignment that no numerical dashboard can match.
Core Components and How They Work Together
1. Oscillator Normalization Engine
The foundation is creating a common measurement scale. QRFM supports eight oscillators:
RSI : Normalized from to using overbought/oversold levels (70, 30) as anchors
MACD Histogram : Normalized by dividing by rolling standard deviation, then clamped to
Stochastic %K : Normalized from using (80, 20) anchors
CCI : Divided by 200 (typical extreme level), clamped to
Williams %R : Normalized from using (-20, -80) anchors
MFI : Normalized from using (80, 20) anchors
ROC : Divided by 10, clamped to
TSI : Divided by 50, clamped to
Each oscillator can be individually enabled/disabled. Only active oscillators contribute to phase calculations. The normalization removes scale differences—a reading of +0.8 means "strongly bullish" regardless of whether it came from RSI or TSI.
2. Analytic Signal Construction
For each active oscillator at each bar, the system constructs the analytic signal:
In-Phase (I) : The normalized oscillator value itself
Quadrature (Q) : The bar-to-bar change in the normalized value (first derivative approximation)
This creates a 2D representation: (I, Q). The phase is extracted as:
φ = atan2(Q, I) × (180 / π)
This maps the oscillator to a point on the unit circle. An oscillator at the same value but rising (positive Q) will have a different phase than one that is falling (negative Q). This velocity-awareness is critical—it distinguishes between "at resistance and stalling" versus "at resistance and breaking through."
The amplitude is extracted as:
A = √(I² + Q²)
This represents the distance from origin in the (I, Q) plane. High amplitude means the oscillator is far from neutral (strong conviction). Low amplitude means it's near zero (weak/transitional state).
3. Coherence Calculation Pipeline
For each bar (or every Nth bar if phase sample rate > 1 for performance):
Step 1 : Extract phase φₙ for each of the N active oscillators
Step 2 : Compute complex exponentials: Zₙ = e^(i·φₙ·π/180) = cos(φₙ·π/180) + i·sin(φₙ·π/180)
Step 3 : Sum the complex exponentials: R = Σ Zₙ = (Σ cos φₙ) + i·(Σ sin φₙ)
Step 4 : Calculate magnitude: |R| = √
Step 5 : Normalize by count: CI_raw = |R| / N
Step 6 : Smooth the CI: CI = SMA(CI_raw, smoothing_window)
The smoothing step (default 2 bars) removes single-bar noise spikes while preserving structural coherence changes. Users can adjust this to control reactivity versus stability.
The dominant phase is calculated as:
φ_dom = atan2(Σ sin φₙ, Σ cos φₙ) × (180 / π)
This is the angle of the resultant vector R in the complex plane.
4. Entanglement Matrix Construction
For all unique pairs of oscillators (i, j) where i < j:
Step 1 : Get phases φᵢ and φⱼ
Step 2 : Compute phase difference: Δφ = φᵢ - φⱼ (in radians)
Step 3 : Calculate entanglement: E(i,j) = |cos(Δφ)|
Step 4 : Store in symmetric matrix: matrix = matrix = E(i,j)
The matrix is then scanned: count how many E(i,j) values exceed the user-defined threshold (default 0.7). This count is the entangled pairs metric.
For visualization, the matrix is rendered as an N×N table where cell brightness maps to E(i,j) intensity.
5. Phase-Lock Detection
Step 1 : For all unique pairs (i, j), compute angular distance: Δφ = |φᵢ - φⱼ|
Step 2 : Wrap angles: if Δφ > 180°, set Δφ = 360° - Δφ
Step 3 : Find maximum: max_spread = max(Δφ) across all pairs
Step 4 : Compare to tolerance: phase_locked = (max_spread < tolerance)
If phase_locked is true, all oscillators are within the specified angular cone (e.g., 35°). This is a boolean confirmation filter.
6. Signal Generation Logic
Signals are generated through multi-layer confirmation:
Long Ignition Signal :
CI crosses above ignition threshold (e.g., 0.80)
AND dominant phase is in bullish range (-90° < φ_dom < +90°)
AND phase_locked = true
AND entangled_pairs >= minimum threshold (e.g., 4)
Short Ignition Signal :
CI crosses above ignition threshold
AND dominant phase is in bearish range (φ_dom < -90° OR φ_dom > +90°)
AND phase_locked = true
AND entangled_pairs >= minimum threshold
Collapse Signal :
CI at bar minus CI at current bar > collapse threshold (e.g., 0.55)
AND CI at bar was above 0.6 (must collapse from coherent state, not from already-low state)
These are strict conditions. A high CI alone does not generate a signal—dominant phase must align with direction, oscillators must be phase-locked, and sufficient pairwise entanglement must exist. This multi-factor gating dramatically reduces false signals compared to single-condition triggers.
Calculation Methodology
Phase 1: Oscillator Computation and Normalization
On each bar, the system calculates the raw values for all enabled oscillators using standard Pine Script functions:
RSI: ta.rsi(close, length)
MACD: ta.macd() returning histogram component
Stochastic: ta.stoch() smoothed with ta.sma()
CCI: ta.cci(close, length)
Williams %R: ta.wpr(length)
MFI: ta.mfi(hlc3, length)
ROC: ta.roc(close, length)
TSI: ta.tsi(close, short, long)
Each raw value is then passed through a normalization function:
normalize(value, overbought_level, oversold_level) = 2 × (value - oversold) / (overbought - oversold) - 1
This maps the oscillator's typical range to , where -1 represents extreme bearish, 0 represents neutral, and +1 represents extreme bullish.
For oscillators without fixed ranges (MACD, ROC, TSI), statistical normalization is used: divide by a rolling standard deviation or fixed divisor, then clamp to .
Phase 2: Phasor Extraction
For each normalized oscillator value val:
I = val (in-phase component)
Q = val - val (quadrature component, first difference)
Phase calculation:
phi_rad = atan2(Q, I)
phi_deg = phi_rad × (180 / π)
Amplitude calculation:
A = √(I² + Q²)
These values are stored in arrays: osc_phases and osc_amps for each oscillator n.
Phase 3: Complex Summation and Coherence
Initialize accumulators:
sum_cos = 0
sum_sin = 0
For each oscillator n = 0 to N-1:
phi_rad = osc_phases × (π / 180)
sum_cos += cos(phi_rad)
sum_sin += sin(phi_rad)
Resultant magnitude:
resultant_mag = √(sum_cos² + sum_sin²)
Coherence Index (raw):
CI_raw = resultant_mag / N
Smoothed CI:
CI = SMA(CI_raw, smoothing_window)
Dominant phase:
phi_dom_rad = atan2(sum_sin, sum_cos)
phi_dom_deg = phi_dom_rad × (180 / π)
Phase 4: Entanglement Matrix Population
For i = 0 to N-2:
For j = i+1 to N-1:
phi_i = osc_phases × (π / 180)
phi_j = osc_phases × (π / 180)
delta_phi = phi_i - phi_j
E = |cos(delta_phi)|
matrix_index_ij = i × N + j
matrix_index_ji = j × N + i
entangle_matrix = E
entangle_matrix = E
if E >= threshold:
entangled_pairs += 1
The matrix uses flat array storage with index mapping: index(row, col) = row × N + col.
Phase 5: Phase-Lock Check
max_spread = 0
For i = 0 to N-2:
For j = i+1 to N-1:
delta = |osc_phases - osc_phases |
if delta > 180:
delta = 360 - delta
max_spread = max(max_spread, delta)
phase_locked = (max_spread < tolerance)
Phase 6: Signal Evaluation
Ignition Long :
ignition_long = (CI crosses above threshold) AND
(phi_dom > -90 AND phi_dom < 90) AND
phase_locked AND
(entangled_pairs >= minimum)
Ignition Short :
ignition_short = (CI crosses above threshold) AND
(phi_dom < -90 OR phi_dom > 90) AND
phase_locked AND
(entangled_pairs >= minimum)
Collapse :
CI_prev = CI
collapse = (CI_prev - CI > collapse_threshold) AND (CI_prev > 0.6)
All signals are evaluated on bar close. The crossover and crossunder functions ensure signals fire only once when conditions transition from false to true.
Phase 7: Field Strength and Visualization Metrics
Average Amplitude :
avg_amp = (Σ osc_amps ) / N
Field Strength :
field_strength = CI × avg_amp
Collapse Risk (for dashboard):
collapse_risk = (CI - CI) / max(CI , 0.1)
collapse_risk_pct = clamp(collapse_risk × 100, 0, 100)
Quantum State Classification :
if (CI > threshold AND phase_locked):
state = "Ignition"
else if (CI > 0.6):
state = "Coherent"
else if (collapse):
state = "Collapse"
else:
state = "Chaos"
Phase 8: Visual Rendering
Orbit Plot : For each oscillator, convert polar (phase, amplitude) to Cartesian (x, y) for grid placement:
radius = amplitude × grid_center × 0.8
x = radius × cos(phase × π/180)
y = radius × sin(phase × π/180)
col = center + x (mapped to grid coordinates)
row = center - y
Heat Map : For each oscillator row and time column, retrieve historical phase value at lookback = (columns - col) × sample_rate, then map phase to color using a hue gradient.
Entanglement Web : Render matrix as table cell with background color opacity = E(i,j).
Field Cloud : Background color = (phi_dom > -90 AND phi_dom < 90) ? green : red, with opacity = mix(min_opacity, max_opacity, CI).
All visual components render only on the last bar (barstate.islast) to minimize computational overhead.
How to Use This Indicator
Step 1 : Apply QRFM to your chart. It works on all timeframes and asset classes, though 15-minute to 4-hour timeframes provide the best balance of responsiveness and noise reduction.
Step 2 : Enable the dashboard (default: top right) and the circular orbit plot (default: middle left). These are your primary visual feedback tools.
Step 3 : Optionally enable the heat map, entanglement web, and field cloud based on your preference. New users may find all visuals overwhelming; start with dashboard + orbit plot.
Step 4 : Observe for 50-100 bars to let the indicator establish baseline coherence patterns. Markets have different "normal" CI ranges—some instruments naturally run higher or lower coherence.
Understanding the Circular Orbit Plot
The orbit plot is a polar grid showing oscillator vectors in real-time:
Center point : Neutral (zero phase and amplitude)
Each vector : A line from center to a point on the grid
Vector angle : The oscillator's phase (0° = right/east, 90° = up/north, 180° = left/west, -90° = down/south)
Vector length : The oscillator's amplitude (short = weak signal, long = strong signal)
Vector label : First letter of oscillator name (R = RSI, M = MACD, etc.)
What to watch :
Convergence : When all vectors cluster in one quadrant or sector, CI is rising and coherence is forming. This is your pre-signal warning.
Scatter : When vectors point in random directions (360° spread), CI is low and the market is in a non-trending or transitional regime.
Rotation : When the cluster rotates smoothly around the circle, the ensemble is in coherent oscillation—typically seen during steady trends.
Sudden flips : When the cluster rapidly jumps from one side to the opposite (e.g., +90° to -90°), a phase reversal has occurred—often coinciding with trend reversals.
Example: If you see RSI, MACD, and Stochastic all pointing toward 45° (northeast) with long vectors, while CCI, TSI, and ROC point toward 40-50° as well, coherence is high and dominant phase is bullish. Expect an ignition signal if CI crosses threshold.
Reading Dashboard Metrics
The dashboard provides numerical confirmation of what the orbit plot shows visually:
CI : Displays as 0-100%. Above 70% = high coherence (strong regime), 40-70% = moderate, below 40% = low (poor conditions for trend entries).
Dom Phase : Angle in degrees with directional arrow. ⬆ = bullish bias, ⬇ = bearish bias, ⬌ = neutral.
Field Strength : CI weighted by amplitude. High values (> 0.6) indicate not just alignment but strong alignment.
Entangled Pairs : Count of oscillator pairs with E > threshold. Higher = more confirmation. If minimum is set to 4, you need at least 4 pairs entangled for signals.
Phase Lock : 🔒 YES (all oscillators within tolerance) or 🔓 NO (spread too wide).
State : Real-time classification:
🚀 IGNITION: CI just crossed threshold with phase-lock
⚡ COHERENT: CI is high and stable
💥 COLLAPSE: CI has dropped sharply
🌀 CHAOS: Low CI, scattered phases
Collapse Risk : 0-100% scale based on recent CI change. Above 50% warns of imminent breakdown.
Interpreting Signals
Long Ignition (Blue Triangle Below Price) :
Occurs when CI crosses above threshold (e.g., 0.80)
Dominant phase is in bullish range (-90° to +90°)
All oscillators are phase-locked (within tolerance)
Minimum entangled pairs requirement met
Interpretation : The oscillator ensemble has transitioned from disorder to coherent bullish alignment. This is a high-probability long entry point. The multi-layer confirmation (CI + phase direction + lock + entanglement) ensures this is not a single-oscillator whipsaw.
Short Ignition (Red Triangle Above Price) :
Same conditions as long, but dominant phase is in bearish range (< -90° or > +90°)
Interpretation : Coherent bearish alignment has formed. High-probability short entry.
Collapse (Circles Above and Below Price) :
CI has dropped by more than the collapse threshold (e.g., 0.55) over a 5-bar window
CI was previously above 0.6 (collapsing from coherent state)
Interpretation : Phase coherence has broken down. If you are in a position, this is an exit warning. If looking to enter, stand aside—regime is transitioning.
Phase-Time Heat Map Patterns
Enable the heat map and position it at bottom right. The rows represent individual oscillators, columns represent time bins (most recent on left).
Pattern: Horizontal Color Bands
If a row (e.g., RSI) shows consistent color across columns (say, green for several bins), that oscillator has maintained stable phase over time. If all rows show horizontal bands of similar color, the entire ensemble has been phase-locked for an extended period—this is a strong trending regime.
Pattern: Vertical Color Bands
If a column (single time bin) shows all cells with the same or very similar color, that moment in time had high coherence. These vertical bands often align with ignition signals or major price pivots.
Pattern: Rainbow Chaos
If cells are random colors (red, green, yellow mixed with no pattern), coherence is low. The ensemble is scattered. Avoid trading during these periods unless you have external confirmation.
Pattern: Color Transition
If you see a row transition from red to green (or vice versa) sharply, that oscillator has phase-flipped. If multiple rows do this simultaneously, a regime change is underway.
Entanglement Web Analysis
Enable the web matrix (default: opposite corner from heat map). It shows an N×N grid where N = number of active oscillators.
Bright Yellow/Gold Cells : High pairwise entanglement. For example, if the RSI-MACD cell is bright gold, those two oscillators are moving in phase. If the RSI-Stochastic cell is bright, they are entangled as well.
Dark Gray Cells : Low entanglement. Oscillators are decorrelated or in quadrature.
Diagonal : Always marked with "—" because an oscillator is always perfectly entangled with itself.
How to use :
Scan for clustering: If most cells are bright, coherence is high across the board. If only a few cells are bright, coherence is driven by a subset (e.g., RSI and MACD are aligned, but nothing else is—weak signal).
Identify laggards: If one row/column is entirely dark, that oscillator is the outlier. You may choose to disable it or monitor for when it joins the group (late confirmation).
Watch for web formation: During low-coherence periods, the matrix is mostly dark. As coherence builds, cells begin lighting up. A sudden "web" of connections forming visually precedes ignition signals.
Trading Workflow
Step 1: Monitor Coherence Level
Check the dashboard CI metric or observe the orbit plot. If CI is below 40% and vectors are scattered, conditions are poor for trend entries. Wait.
Step 2: Detect Coherence Building
When CI begins rising (say, from 30% to 50-60%) and you notice vectors on the orbit plot starting to cluster, coherence is forming. This is your alert phase—do not enter yet, but prepare.
Step 3: Confirm Phase Direction
Check the dominant phase angle and the orbit plot quadrant where clustering is occurring:
Clustering in right half (0° to ±90°): Bullish bias forming
Clustering in left half (±90° to 180°): Bearish bias forming
Verify the dashboard shows the corresponding directional arrow (⬆ or ⬇).
Step 4: Wait for Signal Confirmation
Do not enter based on rising CI alone. Wait for the full ignition signal:
CI crosses above threshold
Phase-lock indicator shows 🔒 YES
Entangled pairs count >= minimum
Directional triangle appears on chart
This ensures all layers have aligned.
Step 5: Execute Entry
Long : Blue triangle below price appears → enter long
Short : Red triangle above price appears → enter short
Step 6: Position Management
Initial Stop : Place stop loss based on your risk management rules (e.g., recent swing low/high, ATR-based buffer).
Monitoring :
Watch the field cloud density. If it remains opaque and colored in your direction, the regime is intact.
Check dashboard collapse risk. If it rises above 50%, prepare for exit.
Monitor the orbit plot. If vectors begin scattering or the cluster flips to the opposite side, coherence is breaking.
Exit Triggers :
Collapse signal fires (circles appear)
Dominant phase flips to opposite half-plane
CI drops below 40% (coherence lost)
Price hits your profit target or trailing stop
Step 7: Post-Exit Analysis
After exiting, observe whether a new ignition forms in the opposite direction (reversal) or if CI remains low (transition to range). Use this to decide whether to re-enter, reverse, or stand aside.
Best Practices
Use Price Structure as Context
QRFM identifies when coherence forms but does not specify where price will go. Combine ignition signals with support/resistance levels, trendlines, or chart patterns. For example:
Long ignition near a major support level after a pullback: high-probability bounce
Long ignition in the middle of a range with no structure: lower probability
Multi-Timeframe Confirmation
Open QRFM on two timeframes simultaneously:
Higher timeframe (e.g., 4-hour): Use CI level to determine regime bias. If 4H CI is above 60% and dominant phase is bullish, the market is in a bullish regime.
Lower timeframe (e.g., 15-minute): Execute entries on ignition signals that align with the higher timeframe bias.
This prevents counter-trend trades and increases win rate.
Distinguish Between Regime Types
High CI, stable dominant phase (State: Coherent) : Trending market. Ignitions are continuation signals; collapses are profit-taking or reversal warnings.
Low CI, erratic dominant phase (State: Chaos) : Ranging or choppy market. Avoid ignition signals or reduce position size. Wait for coherence to establish.
Moderate CI with frequent collapses : Whipsaw environment. Use wider stops or stand aside.
Adjust Parameters to Instrument and Timeframe
Crypto/Forex (high volatility) : Lower ignition threshold (0.65-0.75), lower CI smoothing (2-3), shorter oscillator lengths (7-10).
Stocks/Indices (moderate volatility) : Standard settings (threshold 0.75-0.85, smoothing 5-7, oscillator lengths 14).
Lower timeframes (5-15 min) : Reduce phase sample rate to 1-2 for responsiveness.
Higher timeframes (daily+) : Increase CI smoothing and oscillator lengths for noise reduction.
Use Entanglement Count as Conviction Filter
The minimum entangled pairs setting controls signal strictness:
Low (1-2) : More signals, lower quality (acceptable if you have other confirmation)
Medium (3-5) : Balanced (recommended for most traders)
High (6+) : Very strict, fewer signals, highest quality
Adjust based on your trade frequency preference and risk tolerance.
Monitor Oscillator Contribution
Use the entanglement web to see which oscillators are driving coherence. If certain oscillators are consistently dark (low E with all others), they may be adding noise. Consider disabling them. For example:
On low-volume instruments, MFI may be unreliable → disable MFI
On strongly trending instruments, mean-reversion oscillators (Stochastic, RSI) may lag → reduce weight or disable
Respect the Collapse Signal
Collapse events are early warnings. Price may continue in the original direction for several bars after collapse fires, but the underlying regime has weakened. Best practice:
If in profit: Take partial or full profit on collapse
If at breakeven/small loss: Exit immediately
If collapse occurs shortly after entry: Likely a false ignition; exit to avoid drawdown
Collapses do not guarantee immediate reversals—they signal uncertainty .
Combine with Volume Analysis
If your instrument has reliable volume:
Ignitions with expanding volume: Higher conviction
Ignitions with declining volume: Weaker, possibly false
Collapses with volume spikes: Strong reversal signal
Collapses with low volume: May just be consolidation
Volume is not built into QRFM (except via MFI), so add it as external confirmation.
Observe the Phase Spiral
The spiral provides a quick visual cue for rotation consistency:
Tight, smooth spiral : Ensemble is rotating coherently (trending)
Loose, erratic spiral : Phase is jumping around (ranging or transitional)
If the spiral tightens, coherence is building. If it loosens, coherence is dissolving.
Do Not Overtrade Low-Coherence Periods
When CI is persistently below 40% and the state is "Chaos," the market is not in a regime where phase analysis is predictive. During these times:
Reduce position size
Widen stops
Wait for coherence to return
QRFM's strength is regime detection. If there is no regime, the tool correctly signals "stand aside."
Use Alerts Strategically
Set alerts for:
Long Ignition
Short Ignition
Collapse
Phase Lock (optional)
Configure alerts to "Once per bar close" to avoid intrabar repainting and noise. When an alert fires, manually verify:
Orbit plot shows clustering
Dashboard confirms all conditions
Price structure supports the trade
Do not blindly trade alerts—use them as prompts for analysis.
Ideal Market Conditions
Best Performance
Instruments :
Liquid, actively traded markets (major forex pairs, large-cap stocks, major indices, top-tier crypto)
Instruments with clear cyclical oscillator behavior (avoid extremely illiquid or manipulated markets)
Timeframes :
15-minute to 4-hour: Optimal balance of noise reduction and responsiveness
1-hour to daily: Slower, higher-conviction signals; good for swing trading
5-minute: Acceptable for scalping if parameters are tightened and you accept more noise
Market Regimes :
Trending markets with periodic retracements (where oscillators cycle through phases predictably)
Breakout environments (coherence forms before/during breakout; collapse occurs at exhaustion)
Rotational markets with clear swings (oscillators phase-lock at turning points)
Volatility :
Moderate to high volatility (oscillators have room to move through their ranges)
Stable volatility regimes (sudden VIX spikes or flash crashes may create false collapses)
Challenging Conditions
Instruments :
Very low liquidity markets (erratic price action creates unstable oscillator phases)
Heavily news-driven instruments (fundamentals may override technical coherence)
Highly correlated instruments (oscillators may all reflect the same underlying factor, reducing independence)
Market Regimes :
Deep, prolonged consolidation (oscillators remain near neutral, CI is chronically low, few signals fire)
Extreme chop with no directional bias (oscillators whipsaw, coherence never establishes)
Gap-driven markets (large overnight gaps create phase discontinuities)
Timeframes :
Sub-5-minute charts: Noise dominates; oscillators flip rapidly; coherence is fleeting and unreliable
Weekly/monthly: Oscillators move extremely slowly; signals are rare; better suited for long-term positioning than active trading
Special Cases :
During major economic releases or earnings: Oscillators may lag price or become decorrelated as fundamentals overwhelm technicals. Reduce position size or stand aside.
In extremely low-volatility environments (e.g., holiday periods): Oscillators compress to neutral, CI may be artificially high due to lack of movement, but signals lack follow-through.
Adaptive Behavior
QRFM is designed to self-adapt to poor conditions:
When coherence is genuinely absent, CI remains low and signals do not fire
When only a subset of oscillators aligns, entangled pairs count stays below threshold and signals are filtered out
When phase-lock cannot be achieved (oscillators too scattered), the lock filter prevents signals
This means the indicator will naturally produce fewer (or zero) signals during unfavorable conditions, rather than generating false signals. This is a feature —it keeps you out of low-probability trades.
Parameter Optimization by Trading Style
Scalping (5-15 Minute Charts)
Goal : Maximum responsiveness, accept higher noise
Oscillator Lengths :
RSI: 7-10
MACD: 8/17/6
Stochastic: 8-10, smooth 2-3
CCI: 14-16
Others: 8-12
Coherence Settings :
CI Smoothing Window: 2-3 bars (fast reaction)
Phase Sample Rate: 1 (every bar)
Ignition Threshold: 0.65-0.75 (lower for more signals)
Collapse Threshold: 0.40-0.50 (earlier exit warnings)
Confirmation :
Phase Lock Tolerance: 40-50° (looser, easier to achieve)
Min Entangled Pairs: 2-3 (fewer oscillators required)
Visuals :
Orbit Plot + Dashboard only (reduce screen clutter for fast decisions)
Disable heavy visuals (heat map, web) for performance
Alerts :
Enable all ignition and collapse alerts
Set to "Once per bar close"
Day Trading (15-Minute to 1-Hour Charts)
Goal : Balance between responsiveness and reliability
Oscillator Lengths :
RSI: 14 (standard)
MACD: 12/26/9 (standard)
Stochastic: 14, smooth 3
CCI: 20
Others: 10-14
Coherence Settings :
CI Smoothing Window: 3-5 bars (balanced)
Phase Sample Rate: 2-3
Ignition Threshold: 0.75-0.85 (moderate selectivity)
Collapse Threshold: 0.50-0.55 (balanced exit timing)
Confirmation :
Phase Lock Tolerance: 30-40° (moderate tightness)
Min Entangled Pairs: 4-5 (reasonable confirmation)
Visuals :
Orbit Plot + Dashboard + Heat Map or Web (choose one)
Field Cloud for regime backdrop
Alerts :
Ignition and collapse alerts
Optional phase-lock alert for advance warning
Swing Trading (4-Hour to Daily Charts)
Goal : High-conviction signals, minimal noise, fewer trades
Oscillator Lengths :
RSI: 14-21
MACD: 12/26/9 or 19/39/9 (longer variant)
Stochastic: 14-21, smooth 3-5
CCI: 20-30
Others: 14-20
Coherence Settings :
CI Smoothing Window: 5-10 bars (very smooth)
Phase Sample Rate: 3-5
Ignition Threshold: 0.80-0.90 (high bar for entry)
Collapse Threshold: 0.55-0.65 (only significant breakdowns)
Confirmation :
Phase Lock Tolerance: 20-30° (tight clustering required)
Min Entangled Pairs: 5-7 (strong confirmation)
Visuals :
All modules enabled (you have time to analyze)
Heat Map for multi-bar pattern recognition
Web for deep confirmation analysis
Alerts :
Ignition and collapse
Review manually before entering (no rush)
Position/Long-Term Trading (Daily to Weekly Charts)
Goal : Rare, very high-conviction regime shifts
Oscillator Lengths :
RSI: 21-30
MACD: 19/39/9 or 26/52/12
Stochastic: 21, smooth 5
CCI: 30-50
Others: 20-30
Coherence Settings :
CI Smoothing Window: 10-14 bars
Phase Sample Rate: 5 (every 5th bar to reduce computation)
Ignition Threshold: 0.85-0.95 (only extreme alignment)
Collapse Threshold: 0.60-0.70 (major regime breaks only)
Confirmation :
Phase Lock Tolerance: 15-25° (very tight)
Min Entangled Pairs: 6+ (broad consensus required)
Visuals :
Dashboard + Orbit Plot for quick checks
Heat Map to study historical coherence patterns
Web to verify deep entanglement
Alerts :
Ignition only (collapses are less critical on long timeframes)
Manual review with fundamental analysis overlay
Performance Optimization (Low-End Systems)
If you experience lag or slow rendering:
Reduce Visual Load :
Orbit Grid Size: 8-10 (instead of 12+)
Heat Map Time Bins: 5-8 (instead of 10+)
Disable Web Matrix entirely if not needed
Disable Field Cloud and Phase Spiral
Reduce Calculation Frequency :
Phase Sample Rate: 5-10 (calculate every 5-10 bars)
Max History Depth: 100-200 (instead of 500+)
Disable Unused Oscillators :
If you only want RSI, MACD, and Stochastic, disable the other five. Fewer oscillators = smaller matrices, faster loops.
Simplify Dashboard :
Choose "Small" dashboard size
Reduce number of metrics displayed
These settings will not significantly degrade signal quality (signals are based on bar-close calculations, which remain accurate), but will improve chart responsiveness.
Important Disclaimers
This indicator is a technical analysis tool designed to identify periods of phase coherence across an ensemble of oscillators. It is not a standalone trading system and does not guarantee profitable trades. The Coherence Index, dominant phase, and entanglement metrics are mathematical calculations applied to historical price data—they measure past oscillator behavior and do not predict future price movements with certainty.
No Predictive Guarantee : High coherence indicates that oscillators are currently aligned, which historically has coincided with trending or directional price movement. However, past alignment does not guarantee future trends. Markets can remain coherent while prices consolidate, or lose coherence suddenly due to news, liquidity changes, or other factors not captured by oscillator mathematics.
Signal Confirmation is Probabilistic : The multi-layer confirmation system (CI threshold + dominant phase + phase-lock + entanglement) is designed to filter out low-probability setups. This increases the proportion of valid signals relative to false signals, but does not eliminate false signals entirely. Users should combine QRFM with additional analysis—support and resistance levels, volume confirmation, multi-timeframe alignment, and fundamental context—before executing trades.
Collapse Signals are Warnings, Not Reversals : A coherence collapse indicates that the oscillator ensemble has lost alignment. This often precedes trend exhaustion or reversals, but can also occur during healthy pullbacks or consolidations. Price may continue in the original direction after a collapse. Use collapses as risk management cues (tighten stops, take partial profits) rather than automatic reversal entries.
Market Regime Dependency : QRFM performs best in markets where oscillators exhibit cyclical, mean-reverting behavior and where trends are punctuated by retracements. In markets dominated by fundamental shocks, gap openings, or extreme low-liquidity conditions, oscillator coherence may be less reliable. During such periods, reduce position size or stand aside.
Risk Management is Essential : All trading involves risk of loss. Use appropriate stop losses, position sizing, and risk-per-trade limits. The indicator does not specify stop loss or take profit levels—these must be determined by the user based on their risk tolerance and account size. Never risk more than you can afford to lose.
Parameter Sensitivity : The indicator's behavior changes with input parameters. Aggressive settings (low thresholds, loose tolerances) produce more signals with lower average quality. Conservative settings (high thresholds, tight tolerances) produce fewer signals with higher average quality. Users should backtest and forward-test parameter sets on their specific instruments and timeframes before committing real capital.
No Repainting by Design : All signal conditions are evaluated on bar close using bar-close values. However, the visual components (orbit plot, heat map, dashboard) update in real-time during bar formation for monitoring purposes. For trade execution, rely on the confirmed signals (triangles and circles) that appear only after the bar closes.
Computational Load : QRFM performs extensive calculations, including nested loops for entanglement matrices and real-time table rendering. On lower-powered devices or when running multiple indicators simultaneously, users may experience lag. Use the performance optimization settings (reduce visual complexity, increase phase sample rate, disable unused oscillators) to improve responsiveness.
This system is most effective when used as one component within a broader trading methodology that includes sound risk management, multi-timeframe analysis, market context awareness, and disciplined execution. It is a tool for regime detection and signal confirmation, not a substitute for comprehensive trade planning.
Technical Notes
Calculation Timing : All signal logic (ignition, collapse) is evaluated using bar-close values. The barstate.isconfirmed or implicit bar-close behavior ensures signals do not repaint. Visual components (tables, plots) render on every tick for real-time feedback but do not affect signal generation.
Phase Wrapping : Phase angles are calculated in the range -180° to +180° using atan2. Angular distance calculations account for wrapping (e.g., the distance between +170° and -170° is 20°, not 340°). This ensures phase-lock detection works correctly across the ±180° boundary.
Array Management : The indicator uses fixed-size arrays for oscillator phases, amplitudes, and the entanglement matrix. The maximum number of oscillators is 8. If fewer oscillators are enabled, array sizes shrink accordingly (only active oscillators are processed).
Matrix Indexing : The entanglement matrix is stored as a flat array with size N×N, where N is the number of active oscillators. Index mapping: index(row, col) = row × N + col. Symmetric pairs (i,j) and (j,i) are stored identically.
Normalization Stability : Oscillators are normalized to using fixed reference levels (e.g., RSI overbought/oversold at 70/30). For unbounded oscillators (MACD, ROC, TSI), statistical normalization (division by rolling standard deviation) is used, with clamping to prevent extreme outliers from distorting phase calculations.
Smoothing and Lag : The CI smoothing window (SMA) introduces lag proportional to the window size. This is intentional—it filters out single-bar noise spikes in coherence. Users requiring faster reaction can reduce the smoothing window to 1-2 bars, at the cost of increased sensitivity to noise.
Complex Number Representation : Pine Script does not have native complex number types. Complex arithmetic is implemented using separate real and imaginary accumulators (sum_cos, sum_sin) and manual calculation of magnitude (sqrt(real² + imag²)) and argument (atan2(imag, real)).
Lookback Limits : The indicator respects Pine Script's maximum lookback constraints. Historical phase and amplitude values are accessed using the operator, with lookback limited to the chart's available bar history (max_bars_back=5000 declared).
Visual Rendering Performance : Tables (orbit plot, heat map, web, dashboard) are conditionally deleted and recreated on each update using table.delete() and table.new(). This prevents memory leaks but incurs redraw overhead. Rendering is restricted to barstate.islast (last bar) to minimize computational load—historical bars do not render visuals.
Alert Condition Triggers : alertcondition() functions evaluate on bar close when their boolean conditions transition from false to true. Alerts do not fire repeatedly while a condition remains true (e.g., CI stays above threshold for 10 bars fires only once on the initial cross).
Color Gradient Functions : The phaseColor() function maps phase angles to RGB hues using sine waves offset by 120° (red, green, blue channels). This creates a continuous spectrum where -180° to +180° spans the full color wheel. The amplitudeColor() function maps amplitude to grayscale intensity. The coherenceColor() function uses cos(phase) to map contribution to CI (positive = green, negative = red).
No External Data Requests : QRFM operates entirely on the chart's symbol and timeframe. It does not use request.security() or access external data sources. All calculations are self-contained, avoiding lookahead bias from higher-timeframe requests.
Deterministic Behavior : Given identical input parameters and price data, QRFM produces identical outputs. There are no random elements, probabilistic sampling, or time-of-day dependencies.
— Dskyz, Engineering precision. Trading coherence.

Supply and Demand Scanner Toolkit [TradingFinder]🔵 Introduction
The analytical system presented here is built upon a deep quantitative foundation designed to capture the dynamic behavior of supply and demand in live markets. At its core, it calculates continuously adaptive zones where institutional liquidity, volatility shifts, and momentum transitions converge. These zones are derived from a combination of a regression-based moving average, a long-period ATR, and Fibonacci expansion ratios, all working together to model real-time volatility, price momentum, and the underlying market imbalance.
In practice, this means that at any given moment, five primary bands and seven variable analytical zones are generated around price, representing different market states ranging from extreme overbought to extreme oversold.
Each band reacts dynamically to price volatility, recalibrating with every new candle, which allows the system to mirror the true, constantly changing structure of supply and demand. Every movement between these zones reflects a transition in the strength and dominance of buyers and sellers, a process referred to as volatility-driven price state transitions.
Traditional analytical models often rely on fixed or static indicators that cannot keep up with the rapid microstructural changes in modern markets. This system instead uses regression and smoothing logic to adapt on the fly. By combining a regression moving average with a smoothed moving average, the model calculates real-time trend direction, momentum flow, and trend strength.
When the regression average rises above the smoothed one, the system classifies the trend as bullish; when it falls below, bearish. This dual-layer structure not only helps confirm direction but also enables the automatic detection of critical structural shifts such as Break of Structure (BoS), Change of Character (CHoCH), and directional reversals.
Both the current trend (Live Trend) and projected future trend (Vision Trend) are calculated simultaneously across all available timeframes. This dual analysis allows traders to identify structural changes earlier and to recognize whether a trend is gaining or losing momentum.
In most conventional moving-average-based frameworks, trading signals are delayed because these models react to price rather than anticipate it. As a result, many buy or sell signals appear after the real move has already begun, leading to entries that contradict the current trend. This system eliminates that lag by employing a mean reversion trading model. Instead of waiting for crossovers, it observes how far price deviates from its statistical mean and reacts when that deviation begins to shrink, the moment when equilibrium forces reemerge.
This approach produces non-lagging, data-driven signals that appear at the exact moment price begins to revert toward balance. At the same time, traders can visually assess the market’s condition by observing the spacing, compression, or expansion of the dynamic bands, which represent volatility shifts and trend energy. Through this interaction, the trader can quickly gauge whether a trend is strengthening, losing power, or preparing for a reversal. In other words, the model provides both quantitative precision and intuitive visualization.
A unique visual element in this system is how candles are displayed during transitional states. When Live Trend and Vision Trend contradict each other, for instance, when the current trend is bullish but the projected trend turns bearish, candle bodies automatically appear as hollow.
These hollow candles act as visual alerts for zones of uncertainty or equilibrium between buyers and sellers, often preceding trend reversals, liquidity sweeps, or volatility compression phases. Traders quickly learn to interpret hollow candles as signals to pause, observe, or prepare for potential shifts rather than to act impulsively.
Signal generation in this model occurs when price reverts from extreme zones back toward neutrality. When price exits the strong overbought or strong oversold zones and reenters a milder area, the system produces a reversal signal that aligns with real-time market dynamics. To refine accuracy, these signals are confirmed through several filters, including momentum verification, volatility behavior, and smart money validation. This multi-layered signal logic significantly reduces false entries, helping traders avoid overreactions to temporary liquidity spikes and enhancing performance in volatility-driven markets.
On a broader level, the model supports full multi-timeframe analysis. It can analyze up to twenty symbols simultaneously, across multiple timeframes, to detect directional bias, correlation, and confluence. The result is a holistic map of market structure in real time, showing how each asset aligns or diverges from others and how lower timeframes fit into the macro trend. Variables such as Live Trend, Vision Trend, Directional Strength, and Zone Positioning combine to give a complete structural snapshot at any given moment.
Risk management is handled by an adaptive Trailing Stop Engine that continuously aligns with current volatility and price flow. It integrates pivot mapping with ATR-based calculations to dynamically adjust stop-loss levels as price evolves. The engine offers four adaptive modes, Grip, Flow, Drift, and Glide, each tailored to different levels of market volatility and trader risk tolerance. In visualization, the profit area between entry and stop-loss is shaded light green for long positions and light red for short positions. This design allows immediate recognition of active risk exposure and profit lock-in zones, all in real time.
Altogether, the combination of ATR Volatility Mapping, Fibonacci Band Calibration, Regression-Based Trend Engine, Dynamic Supply and Demand Equilibrium, Conflict Detection through Hollow Candles, Mean Reversion Signal Model, and Adaptive Trailing Stop forms a unified analytical system. It maps the market’s structure, identifies current and future trends, measures the real-time balance of buyers and sellers, and highlights optimal entry and exit points. The final result is higher analytical precision, improved risk control, and a clearer view of the true, data-defined market structure.
🔵 How to Use
Analyzing supply and demand in live financial markets is one of the most complex challenges traders face. Price rarely moves in a straight line; instead, it evolves through phases of expansion, compression, and redistribution. Many traders misinterpret these movements because the zones that appear strong or reactive at first glance often represent nothing more than temporary liquidity redistributions.
These areas, while visually convincing, may lose relevance quickly when volatility increases or when viewed from another timeframe. In high-volatility environments, traditional zone analysis becomes even more unreliable. Price may seem to respect a support or resistance level only to break through it a few candles later. This behavior creates false zones and misleading reversal points.
The key to filtering such movements lies in understanding the context, how volatility, momentum, and structural flow interact across different timeframes. A single timeframe can only tell part of the story. The market’s true structure emerges only when data is synchronized from macro to micro levels.
This is where multi-timeframe correlation becomes essential. Every timeframe offers a different lens through which supply and demand balance can be observed. For example, a trader might see a bullish setup on a 15-minute chart while the 4-hour chart is still showing a strong distribution phase. Without alignment between these layers, trades are easily positioned against the dominant liquidity flow. The model presented here solves this by processing all relevant timeframes simultaneously, allowing traders to see how short-term movements fit within higher-level structures.
Each market phase, whether accumulation, expansion, or reversion, carries a unique volatility fingerprint. The system tracks transitions in volatility regimes, momentum divergence, and structural breakouts to anticipate when a phase change is approaching. For instance, when volatility compresses and ATR readings narrow, it often signals an upcoming breakout or reversal. By monitoring these shifts in real time, the model helps the trader differentiate between liquidity grabs (temporary volatility spikes) and genuine structural changes.
Every supply-demand interaction within this system is adaptive rather than static. The zones continuously recalibrate based on live parameters such as price velocity, momentum distribution, and liquidity displacement. This adaptive structure ensures that the balance between buyers and sellers is represented accurately as market conditions evolve.
In practice, this allows the user to identify early signs of trend exhaustion, potential reversals, and continuation patterns long before traditional indicators would react.
In essence, successful supply and demand analysis requires moving beyond subjective interpretation toward data-driven decision-making.
Manual drawing of zones or relying solely on visual intuition can lead to inconsistent results, especially in fast-changing markets. By combining ATR-driven volatility mapping, mean reversion dynamics, and multi-timeframe alignment, this framework offers a clear, objective, and responsive model of how market forces actually operate. Each decision becomes grounded in measurable context, not assumptions.
The analytical interface is divided into two main sections : the visual chart framework and the scanner data table.
On the chart, five dynamic bands and seven analytical zones appear around price. These are calculated from ATR, regression moving average, and Fibonacci expansion ratios to define whether the market is overbought, oversold, or neutral. Each zone has distinct color coding, allowing traders to recognize the market state instantly without switching tools or indicators.
Price movement within these bands reveals more than just direction, it tells a story of volatility, liquidity flow, and market equilibrium. The upper zones typically indicate exhaustion of buying pressure, while lower zones highlight areas of overselling or potential recovery. The way price reacts near these boundaries can help determine whether a continuation or reversal is likely.
At the heart of the visualization are two layered trend components : Live Trend and Vision Trend.
The Live Trend shows the present market direction based on regression and smoothing logic, while the Vision Trend projects the probable future trajectory by analyzing slope deviation and momentum displacement. When these two align, the trader sees confirmation of market strength. When they diverge, candle bodies turn hollow, a simple yet powerful visual alert signaling hesitation, consolidation, or a possible turning point.
At the bottom of the interface, the Scanner Table organizes all analytical data into a structured display. Each row corresponds to a symbol and timeframe, showing the current Live Trend, Vision Trend, Directional Strength, Zone Position, and Signal Age. This table provides a real-time overview of all assets being tracked, showing which ones are trending, which are in reversal, and which are entering transition zones. By analyzing this table, traders can instantly identify correlation clusters, where multiple assets share the same trend direction, often a sign of broader market sentiment shifts.
The Scanner can simultaneously process multiple timeframes and up to twenty different assets, producing a panoramic market overview. This makes it easy to apply a top-down analytical workflow, starting with higher timeframe alignment, then drilling down into lower levels for execution. Instead of reacting to isolated signals, traders can see where confluence exists across structures and focus only on setups that align with overall market context.
The bands and their color coding make interpretation intuitive even for less experienced users. Darker shades correspond to extreme zones, typically where institutional orders are being absorbed or distributed, while lighter zones mark mild overbought or oversold conditions. When price transitions from an outer extreme zone into a milder region, a signal condition becomes active. At this point, traders can cross-check the event using momentum and volatility filters before acting.
The trailing stop section of the display adds another critical dimension to decision-making. It visualizes stop levels as continuously updating colored lines that follow price movement. These levels are calculated dynamically through pivot mapping and ATR-based sensitivity. The shaded area between the entry point and active stop loss (light green for buys, light red for sells) gives traders immediate insight into how much of the move is currently secured as profit and how much remains exposed. This simple visual cue transforms risk management from a static calculation into a living, responsive process.
All components of this analytical system are fully customizable. Users can adjust signal type, calculation periods, smoothing intensity, and band sensitivity to match their trading style. For example, a scalper might shorten ATR and MA periods to capture rapid fluctuations, while a swing trader might increase them for smoother and more stable readings. Because every element responds to live data, even small adjustments lead to meaningful changes in how the system behaves.
When combined with the scanner’s data table, these features enable a top-down analytical workflow, one where decisions are not made from isolated indicators but from a complete, multi-dimensional understanding of market structure. The result is a system that supports both reactive precision and proactive market awareness.
🟣 Long Signal
A long signal is generated when price begins to rebound from deeply oversold conditions. More precisely, when price enters the strong or extreme oversold zones and then returns into the mild oversold region, the system identifies the start of a mean reversion phase. This transition is not based on subjective interpretation but on mathematical deviation from equilibrium, meaning that selling pressure has been exhausted and liquidity begins to shift toward buyers.
Unlike delayed signals that depend on moving average crossovers or oscillators, this signal appears the moment price starts moving back toward balance. The model’s mean reversion logic detects when volatility contraction and momentum realignment coincide, producing a non-lagging entry condition.
In this situation, traders can visually confirm the setup by observing the spacing and curvature of the lower bands. When the lower volatility bands begin to flatten or curve upward while ATR readings stabilize, it indicates that the market is transitioning from distribution to accumulation.
The strength and quality of each long signal depend on the configuration of trend variables. When both Live Trend and Vision Trend are bullish, the probability of continuation is significantly higher. This alignment suggests that the market’s short-term momentum is supported by long-term structure. On the other hand, when the two trends contradict each other, which the chart highlights with hollow candles, it represents a temporary phase of indecision or conflicting forces.
In these moments, traders are encouraged to monitor volatility compression and observe whether the next few candles confirm a real breakout or revert back to range conditions.
Additional confirmation can be derived from observing the slope of the regression moving average and the magnitude of ATR fluctuations. A steeper upward slope combined with decreasing volatility indicates stronger bullish intent. In contrast, if ATR expands while price remains flat, it signals potential traps or fakeouts driven by short-term liquidity grabs.
Valid long signals often emerge near the end of volatility compression periods or immediately after liquidity sweeps around major lows. These are points where large players typically absorb remaining sell orders before initiating upward movement. Once the long condition triggers, the system automatically calculates the initial stop loss using a combination of recent pivots and ATR range. From that point, the Trailing Stop Engine dynamically adjusts as price rises, maintaining optimal distance from the entry point and locking in profits without restricting trade potential.
For educational context, consider a situation where the market has been trending downward for several sessions, and the ATR value begins to decline, showing that volatility is compressing. As price touches the lower extreme zone and reverses into the mild oversold region while Live Trend starts turning positive, this creates an ideal long condition. A new cycle of expansion often begins right after such compression, and the system captures that early shift automatically.
🟣 Short Signal
A short signal represents the opposite scenario, a point where buying momentum weakens after a strong rally, and price begins to revert downward toward equilibrium. When price exits the strong or extreme overbought zones and moves into the mild overbought region, the model detects the start of a bearish mean reversion phase.
Here too, the signal appears without delay, as it is based on the real-time relationship between price and its volatility boundaries rather than on indicator crossovers.
The system identifies these short conditions when upward momentum shows visible fatigue in the volatility bands. The upper bands start to flatten or turn downward while the regression slope begins to lose angle. This is often accompanied by rising ATR readings, showing an expansion in volatility that reflects distribution rather than continuation.
The quality of the short signal is strongly influenced by the interaction between the two trend layers. When both Live Trend and Vision Trend point downward, the likelihood of sustained bearish continuation increases dramatically. However, if they diverge, candle bodies turn hollow, clearly marking zones of conflict or hesitation. These phases often coincide with the end of a bullish impulse wave and the start of an early correction.
A practical example can illustrate this clearly. Imagine a market that has been trending upward for several days with expanding volatility. When price pushes into the extreme overbought zone and starts pulling back into the mild region, the system interprets it as the first sign of distribution. If at the same time the regression moving average flattens and ATR begins to rise, it strongly suggests that institutional participants are taking profit. The generated short signal allows the trader to position early in anticipation of the downward reversion that follows.
The initial stop loss for short trades is calculated above the most recent pivot high, ensuring logical protection based on the structural context. From there, the Trailing Stop Engine automatically tracks the price movement downward, tightening stops as volatility decreases or expanding them during sharp swings to avoid premature exits.
The engine’s dynamic nature makes it suitable for both aggressive scalpers and patient swing traders. Scalpers can set the trailing sensitivity to “Grip” mode for tighter control, while swing traders can use “Glide” mode to capture larger portions of the trend.
Most short signals form right after volatility expansion or liquidity grabs around major highs, classic exhaustion areas where momentum divergence becomes evident. The combination of visual cues (upper band curvature, hollow candles, ATR spikes) provides traders with multiple layers of confirmation before taking action.
In both long and short scenarios, this analytical system replaces emotional decision-making with structured interpretation. By translating volatility, momentum, and price positioning into clear contextual patterns, it empowers the trader to see where reversals are forming in real time rather than guessing after the move has started.
🔵 Setting
🟣 Logical Setting
Channel Period : The main channel period that defines the base moving average used to calculate the central line of the bands. Higher values create a smoother and longer-term structure, while lower values increase short-term sensitivity and faster reactions.
Channel Coefficient Period : The ATR period used to measure volatility for determining the channel width. Higher values provide greater channel stability and reduce reactions to short-term market noise.
Channel Coefficient : The ATR sensitivity factor that defines the distance of the bands from the central average. A higher coefficient widens the bands and increases the probability of detecting overbought or oversold conditions earlier.
Band Smooth Period : The smoothing period applied to the bands to filter minor price noise. Lower values produce quicker reactions to price changes, while higher values create smoother and more stable lines.
Trend Period : The period used in the regression moving average calculation to identify overall trend direction. Shorter values highlight faster trend shifts, while longer values emphasize broader market trends.
Trend Smooth Period : The smoothing period for the regression trend to reduce volatility and confirm the dominant market direction. This setting helps to better distinguish between corrective and continuation phases.
Signals Gap : The time interval between generated signals to prevent consecutive signal clustering. A higher value strengthens the temporal filter and produces more selective and refined signals.
Bars to Calculate : Defines the number of historical candles used in calculations. Limiting this value optimizes script performance and reduces processing load, especially when multiple symbols or timeframes are analyzed simultaneously. Higher values increase analytical depth by including more historical data, while lower values improve responsiveness and reduce potential lag during live chart updates.
Trailing Stop : Enables or disables the dynamic trailing stop engine. When active, the system automatically adjusts stop loss levels based on live volatility and price structure, maintaining alignment with market flow and trend direction.
Trailing Stop Level : Defines the operational mode of the trailing stop engine with four adaptive styles: Grip, Flow, Drift, and Glide. Grip offers tight stop management for scalping and high precision setups, while Glide allows wider flexibility for swing or long-term trades.
Trailing Stop Noise Filter : Applies an additional filtering layer that smooths minor fluctuations and prevents unnecessary stop adjustments caused by short-term market noise or micro volatility.
🟣 Display Settings
Show Trend on Candles : Displays the current trend direction directly on price candles by applying dynamic color coding. When Live Trend and Vision Trend align bullish, candles appear in green tones, while bearish alignment displays in red. If the two trends conflict, candle bodies turn hollow, marking a Trend Conflict Zone that signals potential indecision or upcoming reversal. This feature provides instant visual confirmation of market direction without the need for external indicators
Table on Chart : Allows users to choose whether the analytical table appears directly over the chart or positioned below it. This gives full control over screen layout based on personal workspace preference and chart design.
Number of Symbols : Controls how many symbols are displayed in the screener table, adjustable from 10 up to 20 in steps of 2. This flexibility helps balance between detailed screening and visual clarity on different screen sizes.
Table Mode : Defines how the screener table is visually arranged.
Basic Mode : Displays all symbols in a single column for vertical readability.
Extended Mode : Arranges symbols side by side in pairs to create a more compact and space-efficient layout.
Table Size : Adjusts the visual scaling of the table. Available options include auto, tiny, small, normal, large, and huge, allowing traders to optimize table visibility based on their screen resolution and preferred chart density.
Table Position : Determines the exact placement of the screener table within the chart interface. Users can select from nine available alignments combining top, middle, and bottom vertically with left, center, and right horizontally.
🟣 Symbol Settings
Each of the 10 available symbol slots includes a full range of adjustable parameters for personalized analysis.
Symbol : Defines or selects the asset to be tracked in the screener, such as XAUUSD, BTCUSD, or EURUSD. This enables multi-asset scanning across different markets including forex, commodities, indices, and crypto.
Timeframe : Sets the specific timeframe for analysis for each selected symbol. Examples include 15 minutes, 1 hour (60), 4 hours (240), or 1 day (1D). This flexibility ensures precise control over how each asset is monitored within the multi-timeframe structure.
🟣 Alert Settings
Alert : Enables alerts for AAS.
Message Frequency : Determines the frequency of alerts. Options include 'All' (every function call), 'Once Per Bar' (first call within the bar), and 'Once Per Bar Close' (final script execution of the real-time bar). Default is 'Once per Bar'.
Show Alert Time by Time Zone : Configures the time zone for alert messages. Default is 'UTC'.
🔵 Conclusion
Understanding financial markets requires more than indicators, it demands a framework that captures the interaction of price, volatility, and structure in real time. This analytical system achieves that by combining mean reversion logic, volatility mapping, and dynamic supply and demand modeling into an adaptive, data-driven environment. Its computational bands and trend layers visualize market intent, showing when momentum is strengthening, fading, or preparing to shift.
Each signal, derived from statistical equilibrium rather than delayed indicators, reflects the exact moment when the balance between buyers and sellers changes. Variables like Live Trend, Vision Trend, Directional Strength, and ATR-based Volatility Context help traders assess signal quality and alignment across multiple timeframes. The system blends automation with human interpretation, preserving macro-to-micro consistency and enabling confident entries, exits, and stop management through its adaptive Trailing Stop Engine.
Every component, from color-coded zones to hollow candles, forms part of a broader narrative that teaches traders to read the market’s language instead of reacting to it. Built on self-correcting analysis, the framework continuously recalibrates with live data. By transforming volatility, liquidity, and price behavior into structured insight, it empowers traders to move from reaction to prediction, a living ecosystem that evolves with both the market and the trader.
有料スクリプト

