Scalper's Volatility Filter [QuantraSystems]Scalpers Volatility Filter
Introduction
The 𝒮𝒸𝒶𝓁𝓅𝑒𝓇'𝓈 𝒱𝑜𝓁𝒶𝓉𝒾𝓁𝒾𝓉𝓎 𝐹𝒾𝓁𝓉𝑒𝓇 (𝒮𝒱𝐹) is a sophisticated technical indicator, designed to increase the profitability of lower timeframe trading.
Due to the inherent decrease in the signal-to-noise ratio when trading on lower timeframes, it is critical to develop analysis methods to inform traders of the optimal market periods to trade - and more importantly, when you shouldn’t trade.
The 𝒮𝒱𝐹 uses a blend of volatility and momentum measurements, to signal the dominant market condition - trending or ranging.
Legend
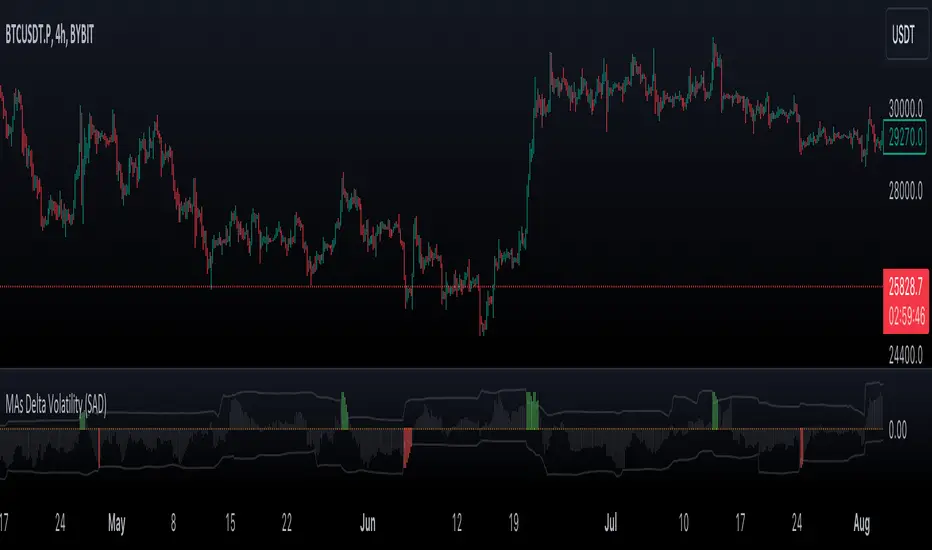
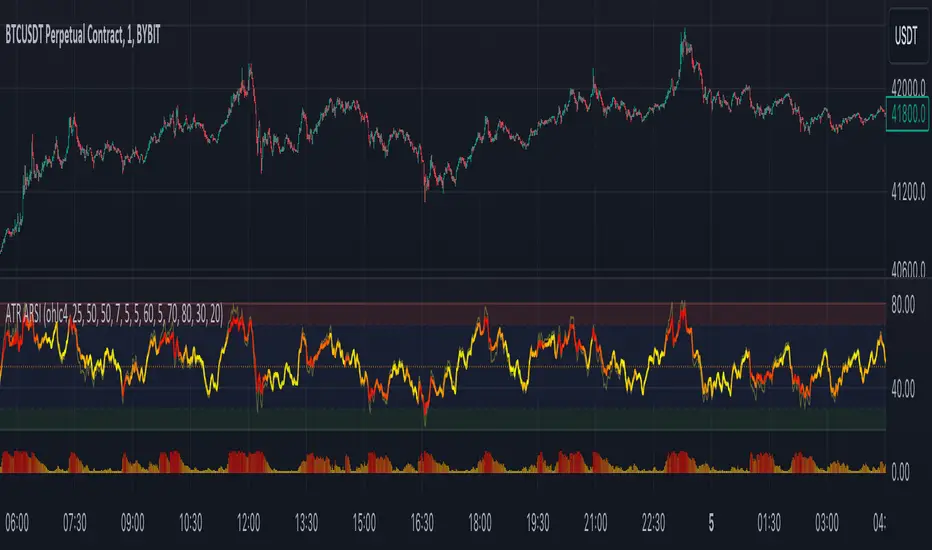
The 𝒮𝒱𝐹 consists of a signal line that moves above and below a central zero line, serving as the indication of market regime.
When the signal line is positioned above zero, it indicates a period of elevated volatility. These periods are more profitable for trading, as an asset will experience larger price swings, and by design, trend-following indicators will give less false signals.
Conversely, when the signal line moves below zero, a low volatility or mean-reverting market regime dominates.
This distinction is critical for traders in order to align strategies with the prevailing market behaviors - leveraging trends in volatile markets and exercising caution or implementing mean-reversion systems in periods of lower volatility.
Case Study
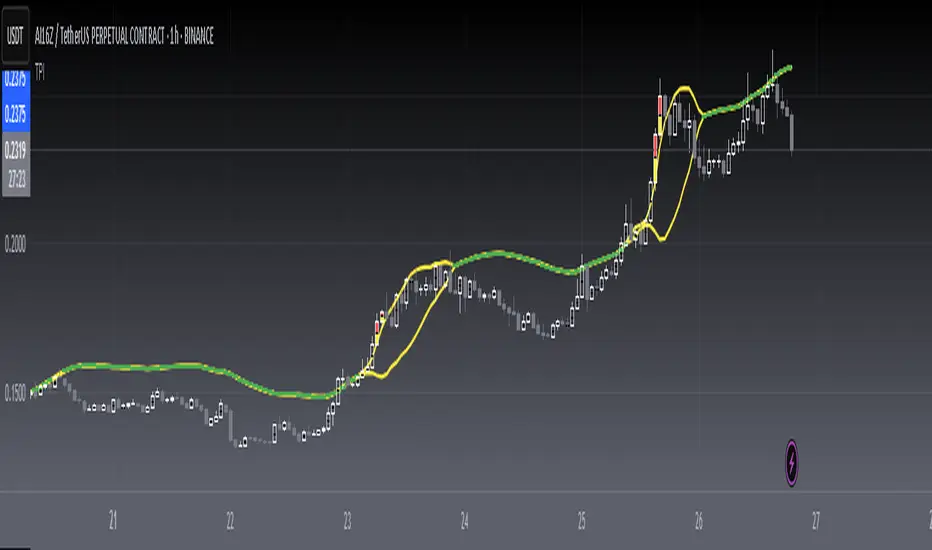
Here we can see the indicator's unique edge in action.
Out of the four potential long entries seen on the chart - displayed via bar coloring, two would result in losses.
However, with the power of the 𝒮𝒱𝐹 a trader can effectively filter false signals by only entering momentum-trades when the signal line is above zero.
In this small sample of four trades, the 𝒮𝒱𝐹 increased the win rate from 50% to 100%
Methodology
The methodology behind the 𝒮𝒱𝐹 is based upon three components:
By calculating and contrasting two ATR’s, the immediate market momentum relative to the broader, established trend is calculated. The original method for this can be credited to the user @xinolia
A modified and smoothed ADX indicator is calculated to further assess the strength and sustainability of trends.
The ‘Linear Regression Dispersion’ measures price deviations from a fitted regression line, adding further confluence to the signals representation of market conditions.
Together, these components synthesize a robust, balanced view of market conditions, enabling traders to help align strategies with the prevailing market environment, in order to potentially increase expected value and win rates.
Pine Script® インジケーター