FT-Algos Master SuiteFT-Algos: Unified Alpha Suite
FT-Algos is an all-in-one Pine Script indicator designed to support traders across scalping and swing trading styles with unique multi-strategy logic and clear signals.
Key Features:
Three Trading Modes:
Quick Scalps — Fast momentum-based entries optimized for ultra-short timeframes.
Precision Scalps — Combines MACD flips, Kalman smoothing, Gaussian filters, ZLEMA, and Heikin Ashi SuperTrend to generate high-confidence scalping signals.
Swing Trades — Uses trend stacking with Kalman, ZLEMA, and MACD crossovers confirmed by higher timeframe SuperTrend direction.
Non-Repainting Signals: All entries rely on confirmed candle closes to avoid repainting and false signals.
Visual Entry Markers: Compact BUY and SELL triangle labels placed directly above/below candles for clear signal visualization.
Dynamic Take Profit and Stop Loss Levels: Calculated using Average True Range (ATR) to adjust for current market volatility.
User Configurable Settings: Easily toggle signal visibility, TP/SL display, and short entry signals.
Alert Conditions: Built-in alerts for buy and sell signals enable integration with TradingView’s alert system.
How FT-Algos works:
FT-Algos uniquely blends several filtering methods including Kalman and Gaussian smoothing, momentum evaluation, and multi-timeframe trend validation to minimize noise and improve entry precision. Each mode serves different trading styles—from rapid scalping to higher timeframe swing trading—allowing traders to adapt to their preferred strategy seamlessly.
Disclaimer:
This script is provided as-is for educational and informational purposes only. It does not constitute financial advice. Please test thoroughly and trade responsibly.
波動分析
Market Energy – Trend vs RetestShows who is in control of the market. The red lines are sellers in control and the green are the buyers in control
Auto Channel [SciQua]Auto Channel
Purpose
Auto Channel finds the single best parallel price channel from recent price action and keeps it updated in real time. It uses ZigZag pivots to build candidate channels, scores each candidate for quality, then plots the winner. When price closes outside the channel, the script flags a breakout and can fire alerts.
How it works
1. ZigZag pivots
The script uses TradingView’s TradingView/ZigZag/7 library to generate a stream of swing highs and lows based on a percentage reversal threshold and a leg depth. These pivots are the only points the channel logic evaluates, which keeps the search fast and focused on structure rather than noise.
2. Channel candidates
From the most recent pivots, the script forms all combinations of two swing highs and two swing lows.
It computes a slope for the high line and a slope for the low line and requires that they be nearly parallel within a user-defined tolerance.
3. Quality scoring and selection
For every valid candidate, the script checks the recent pivot segments against the trial channel and computes:
Inside ratio: fraction of tested pivots that sit fully inside the channel after applying the tolerance buffer.
Violation sum: total magnitude of the breaches for any pivots outside the channel.
Current width: distance between upper and lower lines at the current bar.
The “best” channel is chosen by:
1. highest inside ratio
2. then widest current width
3. then smallest violation sum
4. Plot and projection
The upper and lower lines are anchored to the chosen pivot pairs and extend to the left. The script also projects each line to the current bar to compute the live upper and lower channel prices. Those levels drive the breakout checks and alerts.
5. Breakouts and alerts
A breakout is detected when the bar closes above the projected upper line or closes below the projected lower line, after applying the tolerance buffer. Triangle markers highlight fresh breakouts, and you can enable alert conditions to automate notification or strategy handoff.
Inputs:
ZigZag
Price deviation for reversals (%)
Default 0.2. Larger values produce fewer, larger swings. Smaller values produce more, smaller swings.
Pivot legs
Default 2. Controls the lookback depth ZigZag uses to confirm pivots.
ZigZag Color
Visual only.
Tip: If you are not seeing a stable channel, increase the ZigZag percentage to reduce minor swings.
Channel search
Number of recent pivots to consider
Default 12. Higher values search more history and try more channel combinations. Lower values make the search faster and more reactive.
Max slope difference for parallel
Default 0.0005. Maximum allowed difference between the upper and lower line slopes. Smaller values enforce stricter parallelism.
Max price tolerance outside channel
Default 0.0. A buffer added to the channel boundaries during validation and breakout checks. Use this to ignore tiny wicks that poke the lines.
Minimum inside to outside pivots ratio for valid channel (0.00–1.00)
Default 1.00. Require that at least this fraction of checked pivots lie inside the channel. For a more permissive fit, try 0.60 to 0.85.
Styling
Upper Line Color
Lower Line Color
Breakout Above Color
Breakout Below Color
Plots and visuals
Upper channel line
Lower channel line
Triangle markers on the bar that first confirms a close outside the channel, above or below.
Lines extend left from their pivot anchors. Projection to the current bar is used internally to test for breakouts and to set alerts.
Alerts
The script defines two alert conditions:
Close Above Channel
Triggers when the bar closes above the projected upper line plus tolerance.
Close Below Channel
Triggers when the bar closes below the projected lower line minus tolerance.
Practical usage
Trend channels
In a steady trend, a high inside ratio with a moderate width often highlights the dominant channel. Consider trend entries near the lower line in an uptrend or near the upper line in a downtrend, with exits or stops beyond the opposite boundary.
Breakout trades
Combine the channel breakout alert with volume or a separate momentum filter. The tolerance input helps avoid false triggers from small wicks.
Tuning for timeframe and symbol
• Faster markets or lower timeframes usually benefit from a larger ZigZag percentage and a smaller pivot count.
• Slower markets or higher timeframes can use more pivots and a tighter slope difference to enforce cleaner geometry.
Notes and limitations
Channels are derived from ZigZag pivots. If your ZigZag settings change, the detected channel will also change.
The script plots only the single best channel at any time to keep the chart clean.
Breakout markers appear on confirmed bars. For historical bars, markers appear only where a breakout would have been confirmed at that time.
Lines extend left from their anchors. The script projects the lines internally to the current bar for checks and alerts.
License and attribution
License
Creative Commons Attribution-NonCommercial 4.0 International (CC BY-NC 4.0).
Open source for educational and personal use only. Commercial use requires written permission.
Attribution
© 2025 SciQua — Joshua Danford
Libraries
Uses TradingView/ZigZag/7.
Changelog
v1.0
Initial release. Automatic parallel channel detection from ZigZag pivots, quality scoring, live plotting, and close-based breakout alerts.
FAQ
Why do I not see any channel sometimes?
There may not be a valid pair of highs and lows that pass the slope, inside ratio, and tolerance checks. Loosen the constraints by increasing Max slope difference, lowering Minimum inside ratio, or increasing the ZigZag percentage.
The channel looks too narrow or too wide?
Adjust Number of recent pivots and Minimum inside ratio. A higher inside ratio tends to favor cleaner, sometimes wider channels. A lower ratio may admit narrower, more reactive channels.
How can I reduce false breakout alerts?
Increase Max price tolerance outside channel to ignore small wicks. Add a volume or momentum confirmation in your personal alert workflow.
Thank you for using Auto Channel . Feedback and improvements are welcome.

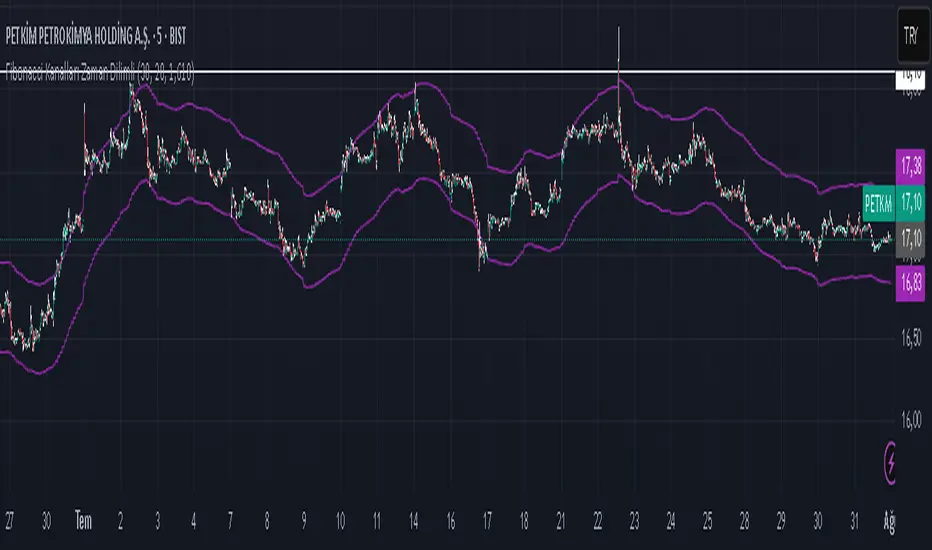
Fibonacci Kanalları Zaman DilimliI understand that you want to fetch moving Fibonacci levels from a different timeframe (fibTimeframe) in Pine Script and plot them on the chart.
Here is a simple example code that:
Takes the timeframe input from settings (fibTimeframe),
Uses request.security() to get data from the selected timeframe,
Calculates Fibonacci levels,
Uses plot() to display the levels on the chart.
Pre-Market & Previous Day Levels 300here is the indicator pre market high low and prev day hihg low levels

HGDA – Wave Target 🔹 HGDA – Wave Target
Precision Wave Projections + Liquidity-Confirmed Alerts
📌 Overview:
This indicator automatically detects confirmed price waves and projects smart Fibonacci-based targets for both reversals and breakouts.
It’s powered by a multi-layered logic that combines:
Pivot-based wave detection
MA30 trend confirmation
Live buy/sell pressure analysis
Ratio-based price projection
And visual + table alerts only when all conditions are aligned.
The result is a clean, noise-free system that highlights only high-probability price targets — after real confirmation.
⚙️ Core Logic:
Wave Detection
The indicator waits for a valid swing high or low to form (using pivots).
Once confirmed, it tracks the most recent directional wave.
Trend Filter (MA30)
Only waves in the direction of the 30-period Moving Average are considered valid.
E.g. Bullish wave must be above MA30, bearish wave below.
Liquidity Confirmation
An internal smart flow engine measures real-time buy/sell pressure.
The wave direction must match liquidity dominance to be valid.
Target Calculation
For reversal scenarios: the wave is projected in the opposite direction.
For breakout scenarios: the wave is extended in the same direction.
Target levels include: 1.236 – 1.5 – 1.618
Smart Alerts
Visual alerts are displayed only when trend + liquidity + ratios align.
No signals are shown during weak, unclear, or conflicting phases.
💡 How to Use:
✅ Step 1: Switch to the 1H chart for optimal balance between structure and signal reliability (works also on 30m–4H).
✅ Step 2: Wait for a new wave to appear with valid trend direction (check the trend row in the table).
✅ Step 3: Confirm that buy/sell pressure supports the wave.
✅ Step 4: Observe the projected targets on the chart (1.236 / 1.5 / 1.618).
✅ Step 5: Plan entry around the first ratio zone with stop loss behind the wave base.
✅ Step 6: Use alerts to act on opportunities when all layers align.
🧠 Built for Traders Who...
Want a clean structure-based system
Avoid false signals caused by random pivots or overused indicators
Rely on trend + liquidity + wave structure for their setups
Prefer price action + dynamic ratios over fixed patterns
📋 Built-in Table Shows:
📈 Wave target price
🧭 Trend direction
💧 Liquidity pressure
🎯 Closest ratio zone
📊 Signal status
🚫 No Repainting – 100% Confirmed Signals Only.

Square Root Candles Its just a squareroot candles of Main chart the major support and resistance levels at 0.1, 0.45 and 0.75 levels

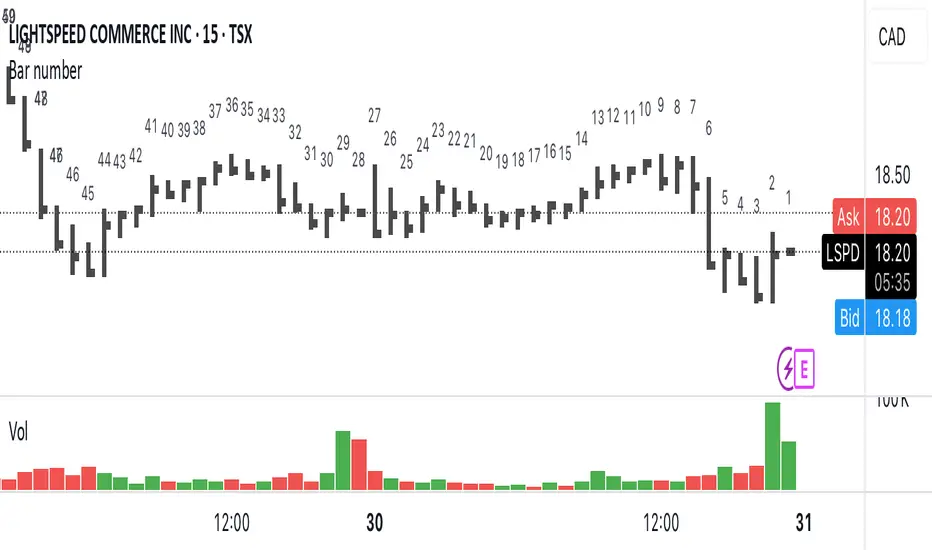
Bar numberAdds a number above the last 50 candles. Candle 1 is always the most recent.
Can be useful when teaching people onlinet. Now they can just ask « what’s candle number 20 » instead of « what’s with that narrow range candle next to the big one to the left… no not that one, the other one »
Internal Pivot Pattern [LuxAlgo]The Internal Pivot Pattern indicator is a novel method allowing traders to detect pivots without excessive delay on the chart timeframe, by using the lower timeframe data from a candle.
It features custom colors for candles and zigzag lines to help identify trends. A dashboard showing the accuracy of the pattern is also included.
🔶 USAGE
We define a pivot as the occurrence where the middle candle over a specific interval (for example, the most recent 21 bars) is the highest (pivot high) or the lowest (pivot low). This method commonly allows for identifying swing highs/lows on a trader's chart; however, this pattern can only be identified after a specific number of bars has been formed, rendering this pattern useless for real-time detection of swing highs/lows.
This indicator uses a different approach, removing the need to wait for candles to form on the user chart; instead, we check the lower timeframe data of the current candle and evaluate for the presence of a pivot given the internal data, effectively providing pivot confirmation at the candle close.
An internal pivot low pattern is indicative of a potential uptrend, while an internal pivot high is indicative of a potential downtrend.
Candles are colored based on the last internal pivot detected, with blue candle colors indicating that the most recent internal pivot is a pivot low, indicating an uptrend, while an orange candle color indicates that the most recent internal pivot is a pivot high, indicating a downtrend.
🔹 Timeframes
The timeframe setting allows controlling the amount of lower timeframe data to consider for the internal pivot detection. This setting must be lower than the user's chart timeframe.
Using a timeframe significantly lower than the user chart timeframe will evaluate a larger amount of data for the pivot detection, making it less frequent, while using a timeframe closer to the chart timeframe can make the internal pivot detection more frequent, and more prone to false positives.
🔹 Accuracy Dashboard
The Accuracy Dashboard allows evaluating how accurate the detected patterns are as a percentage, with a pattern being judged accurate if subsequent patterns are detected higher or lower than a previous one.
For example, an internal pivot low is judged accurate if the following internal pivot is higher than it, indicating that higher highs have been made.
This dashboard can be useful to determine the timeframe setting to maximize the respective internal pivot accuracy.
🔶 SETTINGS
Timeframe: Timeframe for detecting internal swings
Accuracy Dashboard: Enable or disable the Accuracy Dashboard.
🔹 Style
Internal Pivot High: Color of the dot displayed upon the detection of an internal pivot high
Internal Pivot Low: Color of the dot displayed upon the detection of an internal pivot low
Zig-Zag: Color of the zig-zag segments connecting each internal pivot
Candles: Enable candle coloring, with control over the color of the candles highlighting the detected trend

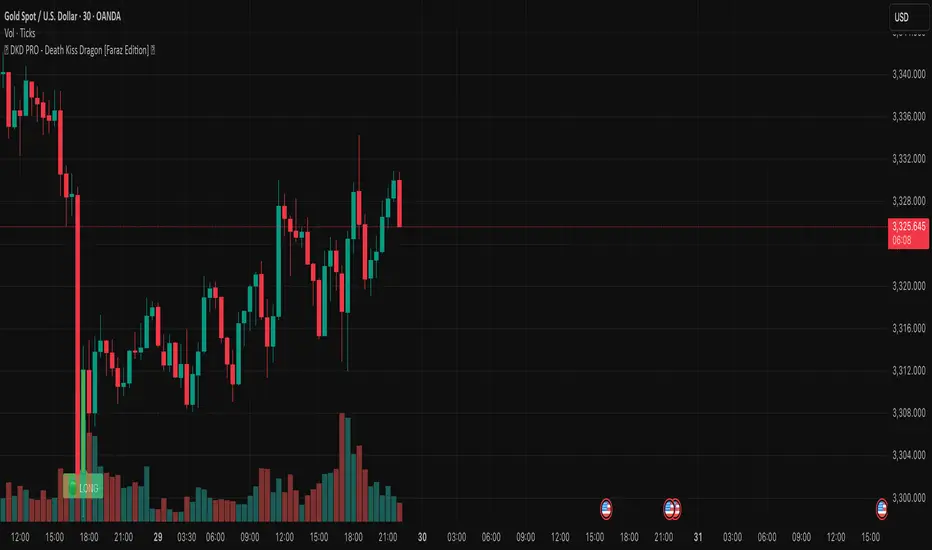
🐉 DKD PRO - Death Kiss Dragon [Faraz Edition] 💋may helps u . based on volume and sell/buy powers. share it for more
Elliott Wave Probability System Pro v2🎯 Major Improvements Made to Elliott Wave Script
Key Changes:
1. Advanced Trend Detection (Lines 55-82)
Uses 5 different methods to determine trend over last 75 bars:
Price position in range
Linear regression slope
Moving average alignment
Higher highs/lows pattern
Up vs down bar count
Combines all methods into a trendScore for accurate direction
2. Adaptive Target Direction
New input: adaptiveTargets (line 28) - can toggle on/off
When ON: Targets follow the 75-bar trend regardless of short-term indicators
When OFF: Works like original (based on current momentum)
3. Improved Target Calculation
Bullish targets use extensions from current price to recent high
Bearish targets use retracements from current price to recent low
More realistic price levels based on actual market structure
4. Enhanced Status Display
Added "Trend (75 bars)" row showing BULLISH/BEARISH/NEUTRAL
Helps you see why targets are pointing a certain direction
5. Better Probability Calculation
Base probability adjusts with trend strength (70% if strong trend, 50% if not)
Gradual probability decay with distance
Minimum 15% probability (more realistic than 10%)
New Features:
Trend-Based Alerts
Alerts when 75-bar trend changes from bullish to bearish (or vice versa)
Trend Weight in Scoring
Added trendWeight to the total score calculation
Makes signals more aligned with larger trend
Visual Improvements
Projection lines now show at 40% probability (was 50%)
Better visibility of likely targets
How It Works Now:
If last 75 bars show a downtrend , targets will be bearish (even if RSI is oversold)
If last 75 bars show an uptrend , targets will be bullish (even if RSI is overbought)
The probability adjusts based on trend strength
This solves the issue where the script was showing bullish targets in a clear downtrend. Now it properly reflects the dominant trend direction while still considering short-term indicators for probability calculations.

Smart Money Trap Scanner [TradingFinder]🔵 Introduction
In many market conditions, what initially seems to be a decisive breakout often turns out to be nothing more than a false breakout or fake move. Price breaks through a significant structural level, such as a swing high or low or a key support and resistance zone, only to quickly return to its previous range. These moves, often driven by liquidity traps or market manipulation, typically signal structural weakness rather than the start of a new trend.
This screener is specifically designed to detect such situations. It focuses on identifying false breakouts and price returns to broken levels within a defined time window, and then looks for retracements into the Fibonacci zone. If price reenters the 0.618 to 1.0 retracement area and aligns with the time-based filters, the system flags a low-risk, high-probability entry opportunity.
To enhance the precision of signal detection, the screener categorizes setups into two distinct types based on the speed of the price reaction after a breakout. Type A signals occur when the price breaks a level and immediately returns to break-even within the very next candle indicating a sharp rejection and rapid invalidation of the breakout. In contrast, Type B signals involve a more gradual return to the broken level, typically taking between two to five candles. This differentiation allows traders to better assess the context and urgency of each trap, providing a clearer understanding of momentum and liquidity behavior behind the move.
Additionally, the screener includes a Signal Age feature, which displays how much time has passed since the last valid signal was generated. This allows traders to quickly assess signal freshness and avoid acting on outdated setups, especially in fast-moving market environments.
One of the key advantages of this tool is its ability to simultaneously scan multiple symbols and timeframes. It only triggers an alert when all conditions false breakout, structural return, and Fibonacci alignment are met. This allows traders to bypass the need for manually reviewing dozens of charts and instead concentrate on clean, valid, and structure-based setups with greater precision.
🔵 How to Use
This tool operates as a structure-based screener that continuously scans various symbols and timeframes. By combining price behavior analysis, structural breakout detection, and Fibonacci retracement zones, it only signals entries when the probability of reversal is significantly supported by liquidity logic and price correction depth.
The system doesn’t just monitor price movements beyond key levels like swing highs or lows. It also evaluates whether the move quickly reverses and absorbs liquidity. If so, Fibonacci is applied to measure the depth of the pullback and identify the most favorable entry zones.
🟣 Long Signal
A long setup is triggered when price temporarily breaks below a valid structural support or swing low. This initial move is typically designed to trigger stop losses and collect sell-side liquidity. If price returns to the broken level within five candles, it is considered a false breakout.
At this point, Fibonacci is drawn from the recent swing high to the new low. If price enters the 0.618 to 1.0 retracement zone within the next ten candles, a potential long entry aligned with Smart Money logic is activated. This deep retracement zone often offers the best low-risk entry, as it typically marks the area where liquidity has been absorbed and the breakout structure has failed.
The stop loss is placed slightly below the 1.0 level to account for minor fluctuations, while the target is set based on trend structure or risk-reward preferences.
🟣 Short Signal
A short setup begins with price temporarily breaking above a valid resistance or swing high. This breakout is often driven by buy-side liquidity collection or stop hunting. If price returns to the broken level within five candles, the move is marked as a breakout failure.
Fibonacci is then drawn from the recent swing low to the new high. If price enters the 0.618 to 1.0 zone within ten candles after the return, a short opportunity is confirmed. This area usually represents the maximum acceptable retracement before a continuation move to the downside and often triggers strong reactions.
The stop loss is placed just above the 1.0 level, and the target is defined based on the expected structure of the move or a predetermined reward ratio.
🟡 Advantages of the Screener
Unlike manual approaches that require constant monitoring of multiple charts, this tool functions as a fully automated screener across multiple symbols and timeframes. It continuously evaluates key levels, liquidity reactions, structural returns, and Fibonacci zones. An alert is only generated when all necessary conditions are met with high accuracy.
This ensures that traders avoid risky or misleading entries and stay focused on precise, verified, and logic-based setups — saving time, reducing noise, and improving consistency in decision-making.
🔵 Settings
🟣 Logical settings
Swing period : You can set the swing detection period.
Valid After Trigger Bars : Limits how many candles after a fake breakout the entry zone remains valid.
Max Swing Back Method : It is in two modes "All" and "Custom". If it is in "All" mode, it will check all swings, and if it is in "Custom" mode, it will check the swings to the extent you determine.
Max Swing Back : You can set the number of swings that will go back for checking.
🟣 Display Settings
Table on Chart : Allows users to choose the position of the signal dashboard either directly on the chart or below it, depending on their layout preference.
Number of Symbols : Enables users to control how many symbols are displayed in the screener table, from 10 to 20, adjustable in increments of 2 symbols for flexible screening depth.
Table Mode : This setting offers two layout styles for the signal table :
Basic : Mode displays symbols in a single column, using more vertical space.
Extended : Mode arranges symbols in pairs side-by-side, optimizing screen space with a more compact view.
Table Size : Lets you adjust the table’s visual size with options such as: auto, tiny, small, normal, large, huge.
Table Position : Sets the screen location of the table. Choose from 9 possible positions, combining vertical (top, middle, bottom) and horizontal (left, center, right) alignments.
🟣 Symbol Settings
Each of the 10 symbol slots comes with a full set of customizable parameters :
Symbol : Define or select the asset (e.g., XAUUSD, BTCUSD, EURUSD, etc.).
Timeframe : Set your desired timeframe for each symbol (e.g., 15, 60, 240, 1D).
🟣 Alert Settings
Alert : Enables alerts for SMT Screener.
Message Frequency : Determines the frequency of alerts. Options include 'All' (every function call), 'Once Per Bar' (first call within the bar), and 'Once Per Bar Close' (final script execution of the real-time bar). Default is 'Once per Bar'.
Show Alert Time by Time Zone : Configures the time zone for alert messages. Default is 'UTC'.
🔵 Conclusion
Many trading mistakes stem from misinterpreting price breaks and entering too early into deceptive moves. In a market environment where false breakouts, liquidity traps, and engineered movements are increasingly common, having a tool that accurately filters these events and frames them within a Fibonacci-based and time-filtered structure provides a real strategic edge.
This indicator merges market structure logic, false breakout detection, and precise retracement analysis to ensure trades are only taken when multiple technical factors are aligned. It not only enhances trade success rates but also helps avoid emotional or impulsive entries.
Moreover, with the ability to scan across several symbols and timeframes simultaneously, the tool goes beyond being just an indicator it becomes a semi-automated structural analysis system. For traders who base their decisions on price behavior, Smart Money logic, and structural retracements, this screener can become a key component of a disciplined and effective trading approach.
有料スクリプト

BT Bar - 1.0 BTBar Description
BTBar is a visual script designed to identify and highlight candles with abnormally high volume, making it easier for traders to spot pressure imbalances and key price areas during live market action.
🔍 The script compares the current candle’s volume to the previous one, and highlights candles that exceed specific percentage thresholds (customizable by the user) using distinct colors.
Rather than relying on generic trend or scalping strategies, BTBar is based on relative volume intensity detection — a concept rooted in order flow analysis — to help traders identify:
Candles with unusual volume spikes (possible absorption or exhaustion),
Medium/high volume continuation signals,
Areas where price might reverse or accelerate.
🛠️ It also offers the option to automatically draw horizontal lines from the open of the highest-volume candles, helping traders track potential institutional decision levels throughout the day.
⚙️ How to use:
Apply BTBar to a clean chart.
Customize the volume threshold levels (e.g., 300%, 400%, etc.).
Watch for highlighted candles — these indicate moments when volume significantly broke previous levels, marking potential points of interest or behavior shifts.
Use the optional horizontal lines as visual support/resistance levels derived from volume extremes.
🧠 Underlying concept:
BTBar uses a percentage-based volume comparison approach, inspired by techniques in footprint charts and volume spike detection.
This allows traders to visually spot key market reactions without relying on numeric overload or complex setups.
Smart Elliott Wave [The_lurker]🔷 Smart Elliott Wave – موجات إليوت الذكية
A professional indicator for automatically detecting and analyzing Elliott Wave patterns on the chart. Built on classical Elliott Wave theory, it enhances accuracy with dynamic Fibonacci validation and geometric logic—solving the most common issues traders face when applying Elliott Wave manually: complexity, subjectivity, and misinterpretation of corrections.
🎯 Key Features
Smart Elliott Wave offers a layered intelligent system that:
- Automatically detects impulsive and corrective wave structures
- Validates wave formations using Fibonacci rules
- Highlights potential reversal zones (PRZ)
- Sends instant alerts for newly detected patterns
- Supports both bullish and bearish trends
- Includes fully customizable user settings
🧠 Core Concept
The indicator analyzes price movement over time using pivot points (discovered via `ta.pivothigh` and `ta.pivotlow`) to detect wave structures that conform to Elliott Wave sequencing:
- Impulse Wave: 0-1-2-3-4-5
- Simple Correction: ABC
- Complex Correction: WXY
Each structure is validated through a strict set of logical rules combined with Fibonacci ratio checks to ensure pattern integrity and reduce false signals.
🧩 Wave Structure Components
1️⃣ Impulse Waves
- Wave 3 is not the shortest
- Wave 4 does not overlap Wave 1
- Waves 1, 3, and 5 are impulsive; Waves 2 and 4 are corrective
- Fibonacci validation can be applied to Waves 2 and 4 if enabled
2️⃣ Simple Corrections (ABC)
- Wave B partially retraces Wave A
- Wave C completes the structure without invalid overlap
- Fibonacci ratios validate the symmetry of A, B, and C (if enabled)
3️⃣ Complex Corrections (WXY)
- Only used if ABC structure is insufficient
- Requires 6 sequential pivot points: W, X, Y
- W and Y are corrective; X is a linking wave
- Follows both structural and ratio-based validations
📏 Dynamic Fibonacci Validation
When Enable Fibonacci Rules is active:
- Validates against common ratios:
`38.2%`, `50%`, `61.8%`, `78.6%`, `127.2%`, `161.8%`
- Adjustable **Fibonacci Tolerance** allows for controlled deviation
- Patterns are ignored if ratios fall outside the accepted range
🔮 Potential Reversal Zones (PRZ)
- Calculated from the most recent completed impulse wave
- Uses Fibonacci extensions to project PRZ ahead of price
- Customizable visibility and color for each ratio
- Used as dynamic take-profit or stop-loss zones
🖍️ Dual Trend Detection & Wave Coloring
- Supports both bullish and bearish patterns
- Automatic wave coloring for quick visual recognition:
- 🟦 Blue: Bullish waves
- 🟥 Red: Bearish waves
- Optional fill color for correction zones
🔔 Smart Alert System
Instant alerts are triggered when a valid wave pattern is confirmed:
- New impulse wave detected
- ABC correction appears
- Complex WXY correction formed
> Alerts are triggered only after the bar closes to prevent repainting.
⚙️ Indicator Settings
📌 Wave Detection Settings
- Pivot Left Strength: Bars to the left used for pivot detection
- Pivot Right Strength: Bars to the right for confirmation (0 = real-time)
- Enable Fibonacci Rules: Toggle Fibonacci ratio validation
- Fibonacci Tolerance: Allowed deviation in percentage
🎨 Display Settings
- Show Previous Patterns: Toggle between all patterns or only the latest
- Fill correction zones with color
- Customize wave and PRZ color schemes
📉 PRZ Settings
- Show/hide specific Fibonacci ratios
- Customize each PRZ color
- Set maximum bar extension for PRZ display
🔕 Alert Settings
- Enable or disable alerts for each type of pattern
📚 Practical Use Cases
- Daily or intraday price structure analysis
- Combine with RSI, MACD, or momentum indicators
- Filter weak signals using Fibonacci-based pattern validation
- Use PRZ zones as dynamic entry/exit targets
- Learn and reinforce Elliott Wave theory through real-time examples
📝 Important Notes
- Setting `Pivot Right = 0` allows for real-time pattern previews (may repaint)
- Disabling Fibonacci validation increases pattern count but reduces accuracy
- TradingView limits to 500 visual objects (labels, boxes, lines); older patterns may be removed
- PRZ extends up to 100 bars or 0.618 of the previous impulse duration by default
⚠️ Disclaimer:
This indicator is for educational and analytical purposes only. It does not constitute financial, investment, or trading advice. Use it in conjunction with your own strategy and risk management. Neither TradingView nor the developer is liable for any financial decisions or losses.
🔷 Smart Elliott Wave – موجات إليوت الذكية
مؤشر احترافي لرصد وتحليل أنماط موجات إليوت تلقائيًا على الرسم البياني، يعتمد على المبادئ الكلاسيكية للنظرية مع تعزيزها بالتحقق الرياضي والهندسي، ويهدف إلى تجاوز العقبات التي يواجهها معظم المتداولين عند تطبيق موجات إليوت يدويًا، مثل صعوبة التحديد، التقديرات الذاتية، وتشويش التصحيحات.
🎯 ما الذي يميز هذا المؤشر؟
يُقدّم Smart Elliott Wave نظامًا تراكبيًا ذكيًا يقوم بـ:
رصد تلقائي للموجات (الدافعة والتصحيحية)
التحقق من صحة النموذج باستخدام قواعد فيبوناتشي
عرض مناطق الانعكاس المحتملة (PRZ)
توليد تنبيهات لحظية عند تشكّل أنماط جديدة
دعم الاتجاهين (الصاعد والهابط)
واجهة إعدادات مرنة قابلة للتخصيص الكامل
🧠 الفكرة الأساسية
يعتمد المؤشر على تحليل حركة السعر عبر تسلسل زمني من النقاط المحورية (Pivots)، والتي تُكتشف باستخدام دوال مدمجة مثل ta.pivothigh وta.pivotlow. ثم يُبني فوق هذه النقاط نماذج هندسية متوافقة مع تسلسل موجات إليوت:
الموجة الدافعة (Impulse): تسلسل 0-1-2-3-4-5
التصحيح البسيط (ABC)
التصحيح المعقد (WXY)
ويتم التحقق من كل نموذج اعتمادًا على قواعد إليوت + نسب فيبوناتشي، ما يضمن موضوعية التصنيف، ودقة التحديد.
🧩 مكوّنات التحليل:
1️⃣ الموجات الدافعة (Impulse Waves):
يُشترط أن تكون الموجة الثالثة غير الأقصر.
لا تتداخل الموجة الرابعة مع نطاق الموجة الأولى.
تأكيد أن الموجات 1 و3 و5 دافعة، و2 و4 تصحيحية.
يتم التحقق من نسب تصحيح الموجتين 2 و4 حسب قواعد فيبوناتشي عند تفعيلها.
2️⃣ التصحيح البسيط (ABC):
B تصحيح جزئي للموجة A.
C تُكمل الهيكل بدون تداخل مع A.
يتم التحقق من أطوال الموجات وفق نسب فيبوناتشي لضمان التناسق.
3️⃣ التصحيح المعقد (WXY):
لا يتم تفعيله إلا عند فشل ABC في تفسير النمط.
يتطلب 6 نقاط محورية متسلسلة: W, X, Y.
W وY تصحيحيتان، وX رابط مركزي.
يخضع أيضًا لقواعد النسب والتماثل البنائي.
📏 التحقق باستخدام نسب فيبوناتشي:
عند تفعيل خاصية Enable Fibonacci Rules، يتم التحقق الصارم من نسب تصحيح الموجات:
النسب المعتمدة:
38.2%, 50%, 61.8%, 78.6%, 127.2%, 161.8%
إذا لم تكن الموجة ضمن نطاق النسبة + نسبة التسامح (Tolerance)، يتم تجاهل النموذج.
يُستخدم هذا التحقق أيضًا لرسم مناطق الانعكاس المحتملة (PRZ).
🔮 مناطق الانعكاس المحتملة (PRZ)
تُحسب PRZ باستخدام نسب فيبوناتشي انطلاقًا من نهاية آخر موجة دافعة.
تُعرض بشكل مستطيلات شفافة أو ملونة.
يمكن تخصيص كل نسبة لونًا وشكلًا خاصًا.
تُستخدم PRZ كأداة توقع للموجة التالية أو لتحديد أهداف وقف الخسارة وجني الأرباح ديناميكيًا.
🖍️ دعم الاتجاهين وتلوين الموجات:
يدعم المؤشر النماذج الصاعدة والهابطة بشكل تلقائي.
يتم استخدام تلوين بصري لتسهيل التمييز:
الأزرق: للموجات الصاعدة
الأحمر: للموجات الهابطة
لون تعبئة مخصص لمناطق التصحيح
🔔 نظام التنبيهات الذكية
يحتوي المؤشر على تنبيهات تلقائية يتم تفعيلها عند اكتمال أي نمط جديد.
يدعم التنبيهات التالية:
موجة دافعة جديدة
تصحيح بسيط ABC
تصحيح معقد WXY
التنبيهات تُطلق بعد إغلاق الشمعة التي تحقق فيها النموذج (غير فوري Repainting-safe)
⚙️ إعدادات المؤشر
📌 إعدادات تحليل الموجة:
Pivot Left Strength: عدد الأعمدة (bars) إلى اليسار لتحديد الانعكاس
Pivot Right Strength: الأعمدة إلى اليمين لتأكيد الانعكاس (0 يعني تنبؤ لحظي)
Enable Fibonacci Rules: تفعيل/تعطيل التحقق من فيبوناتشي
Fibonacci Tolerance: نسبة التفاوت المقبولة بالنسب المئوية
🎨 إعدادات العرض:
Show Previous Patterns: إظهار كل الأنماط المكتشفة أو آخر نمط فقط
PRZ Settings:
إظهار أو إخفاء نسب معينة
تخصيص الألوان
تحديد امتداد مربع PRZ زمنيًا (Max Bars)
🔕 إعدادات التنبيهات:
تفعيل/تعطيل تنبيه عند كل نمط جديد
📚 حالات الاستخدام العملية:
تحليل الحركة السعرية في بداية كل جلسة
دمج المؤشر مع أدوات مثل RSI أو MACD للحصول على إشارات مركّبة
مراقبة الموجات التوسعية والتصحيحية على فواصل 4H / Daily
استخدام PRZ كأداة لتحديد الأهداف أو وقف الخسارة
التعلم العملي لنظرية إليوت من خلال أمثلة حية
📝 ملاحظات مهمة:
تعيين Pivot Right = 0 يعني نقاط فورية (قد يعاد رسمها لاحقًا)
تعطيل فيبوناتشي يزيد عدد النماذج، لكن قد يُضعف دقتها
TradingView يحد عدد الكائنات المرسومة (Labels, Boxes, Lines) إلى 500، مما قد يؤدي إلى حذف الأنماط الأقدم تلقائيًا
PRZ يمتد افتراضيًا حتى 100 شمعة، أو 0.618 من مدة الموجة الدافعة السابقة
⚠️ إخلاء مسؤولية:
هذا المؤشر لأغراض تعليمية وتحليلية فقط. لا يُمثل نصيحة مالية أو استثمارية أو تداولية. استخدمه بالتزامن مع استراتيجيتك الخاصة وإدارة المخاطر. لا يتحمل TradingView ولا المطور مسؤولية أي قرارات مالية أو خسائر.

WT + Stoch RSI Reversal ComboOverview – WT + Stoch RSI Reversal Combo
This custom TradingView indicator combines WaveTrend (WT) and Stochastic RSI (Stoch RSI) to detect high-probability market reversal zones and generate Buy/Sell signals.
It enhances accuracy by requiring confirmation from both oscillators, helping traders avoid false signals during noisy or weak trends.
🔧 Key Features:
WaveTrend Oscillator with optional Laguerre smoothing.
Stochastic RSI with adjustable smoothing and thresholds.
Buy/Sell combo signals when both indicators agree.
Histogram for WT momentum visualization.
Configurable overbought/oversold levels.
Custom dotted white lines at +100 / -100 levels for reference.
Alerts for buy/sell combo signals.
Toggle visibility for each element (lines, signals, histogram, etc.).
✅ How to Use the Indicator
1. Add to Chart
Paste the full Pine Script code into TradingView's Pine Editor and click "Add to Chart".
2. Understand the Signals
Green Triangle (BUY) – Appears when:
WT1 crosses above WT2 in oversold zone.
Stoch RSI %K crosses above %D in oversold region.
Red Triangle (SELL) – Appears when:
WT1 crosses below WT2 in overbought zone.
Stoch RSI %K crosses below %D in overbought region.
⚠️ A signal only appears when both WT and Stoch RSI agree, increasing reliability.
3. Tune Settings
Open the settings ⚙️ and adjust:
Channel Lengths, smoothing, and thresholds for both indicators.
Enable/disable visibility of:
WT lines
Histogram
Stoch RSI
Horizontal level lines
Combo signals
4. Use with Price Action
Use this indicator in conjunction with support/resistance zones, chart patterns, or trendlines.
Works best on lower timeframes (5m–1h) for scalping or 1h–4h for swing trading.
5. Set Alerts
Set alerts using:
"WT + Stoch RSI Combo BUY Signal"
"WT + Stoch RSI Combo SELL Signal"
This helps you catch setups in real time without watching the chart constantly.
📊 Ideal Use Cases
Reversal trading from extremes
Mean reversion strategies
Timing entries/exits during consolidations
Momentum confirmation for breakouts

Squeeze Pro Momentum BAR color - KLTDescription:
The Squeeze Pro Momentum indicator is a powerful tool designed to detect volatility compression ("squeeze" zones) and visualize momentum shifts using a refined color-based system. This script blends the well-known concepts of Bollinger Bands and Keltner Channels with an optimized momentum engine that uses dynamic color gradients to reflect trend strength, direction, and volatility.
It’s built for traders who want early warning of potential breakouts and clearer insight into underlying market momentum.
🔍 How It Works:
📉 Squeeze Detection:
This indicator identifies "squeeze" conditions by comparing Bollinger Bands and Keltner Channels:
When Bollinger Bands are inside Keltner Channels → Squeeze is ON
When Bollinger Bands expand outside Keltner Channels → Squeeze is OFF
You’ll see squeeze zones classified as:
Wide
Normal
Narrow
Each represents varying levels of compression and breakout potential.
⚡ Momentum Engine:
Momentum is calculated using linear regression of the price's deviation from a dynamic average of highs, lows, and closes. This gives a more accurate representation of directional pressure in the market.
🧠 Smart Candle Coloring (Optimized):
The momentum color logic is inspired by machine learning principles (no hardcoded thresholds):
EMA smoothing and rate of change (ROC) are used to detect momentum acceleration.
ATR-based filters help remove noise and false signals.
Colors are dynamically assigned based on both direction and trend strength.
🧪 How to Use It:
Look for Squeeze Conditions — especially narrow squeezes, which tend to precede high-momentum breakouts.
Confirm with Momentum Color — strong colors often indicate trend continuation; fading colors may signal exhaustion.
Combine with Price Action — use this tool with support/resistance or patterns for higher probability setups.
Recommended For:
Trend Traders
Breakout Traders
Volatility Strategy Users
Anyone who wants visual clarity on trend strength
📌 Tip: This indicator works great when layered with volume and price action patterns. It is fully non-repainting and supports overlay on price charts.

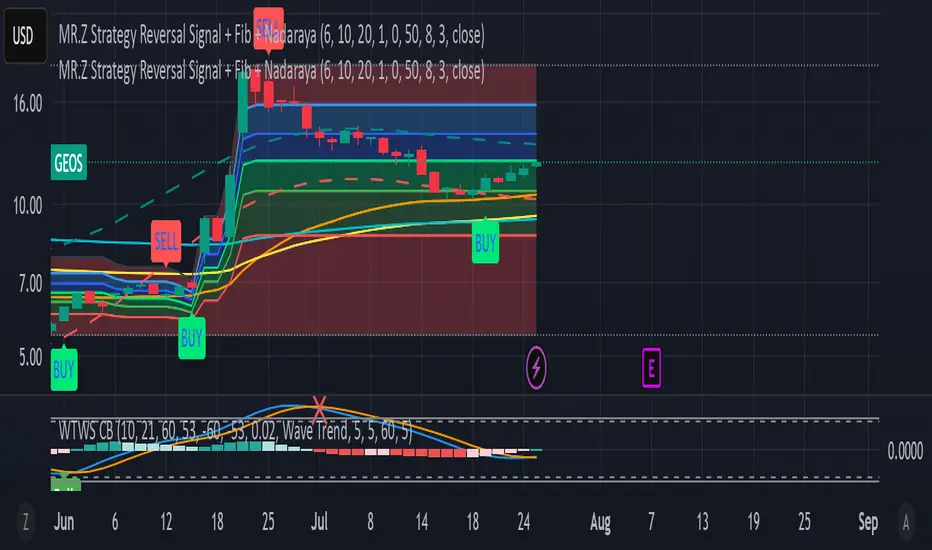
MR.Z Strategy Reversal Signal Nadaraya SMA)Nadaraya-Watson Envelope (NW Envelope):
A smoothed, non-linear dynamic envelope that adapts to price structure. It visually identifies price extremes using kernel regression. The upper and lower bands move with the chart and provide reliable dynamic support and resistance.
EMA Levels:
Includes three key exponential moving averages:
EMA 50 (short-term trend)
EMA 100 (medium-term)
EMA 200 (long-term, institutional level)
Fully Scrollable and Responsive:
All lines and envelopes are plotted using plot() so they move with the chart and respond to zoom and pan actions naturally.
🧠 Ideal Use:
Identify reversal zones, dynamic support/resistance, and trend momentum exhaustion.
Combine WTB and NW Envelope for confluence-based entries.
Use EMA structure for trend confirmation or breakout anticipation.
Let me know if you'd like to add:
Divergence detection
Buy/Sell signals
Alerts or signal filtering options
I’ll be happy to extend the description or the script accordingly!
Momentum Candle ProjectionThis indicator projects future price momentum by calculating a directional vector from recent price movements. It uses a custom implementation of the atan2 function to create a vector average of the last N candles and visualizes this projection as a synthetic future candle.
🔍 What It Does:
✅ Tracks recent momentum using geometric vectors from price change.
✅ Projects a synthetic "momentum candle" one bar ahead, showing anticipated direction and magnitude.
✅ Optionally plots a secondary "future candle" based on a smoothed estimate of projected price vs. real current close.
⚙️ Settings:
Vector Lookback (bars): Controls how many bars are used to calculate the momentum vector.
Projection Length Multiplier: Adjusts how far forward the vector is projected based on its strength.
🟢 How To Use:
Use the lime/red projection candle to anticipate short-term directional bias.
Use the orange/maroon future candle to compare projected continuation vs. current closing price.
Spot early reversals, continuation zones, and momentum decay in real-time.

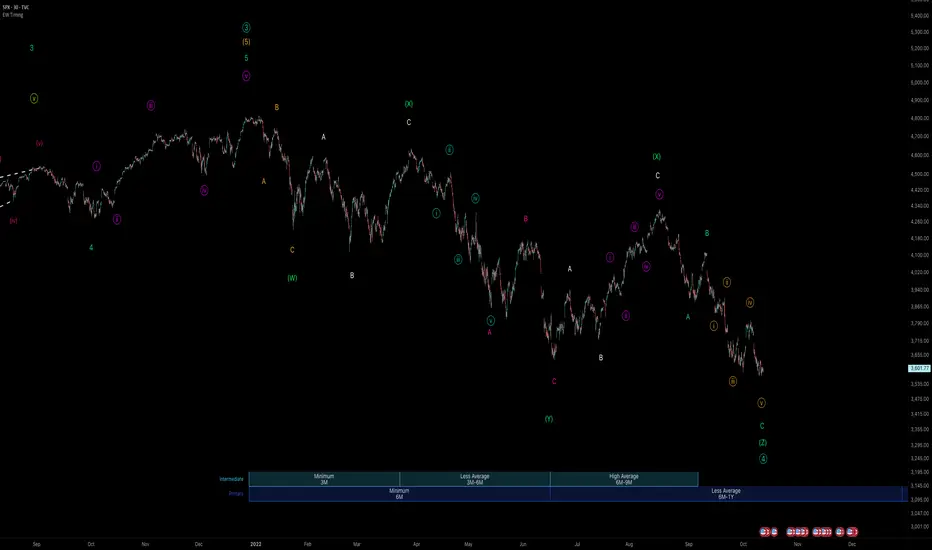
zSph x Larry Waves Wave Degree TimingElliott Waves are fractal structures governed by time. The categorization of time in relation to Elliott Wave is named ‘Wave Degree’.
All waves are characterized by relative size called degree. The degree of a wave is determined by its size and position relative to lesser waves (smaller time and size), corresponding waves (similar time and size) and encompassing waves (greater time and size).
Elliott named 9 degrees (Supercycle – Subminuette).
Elliott also stated the Subminuette degree is discernable on the HOURLY chart.
# Concept
BINANCE:BTCUSDT
Degree is governed by Time yet it is not based upon time lengths (or price lengths), rather it is based on form and structure – a function of both price and time.
The precise degree may not be identified in real time, yet the objective is to be within +/- 1 standard deviation of the expected degree to be aware of the overall market progression.
Understanding degree helps in the identification of when an impulse or a correction is nearing completion and to be aware of the major pivot in price action to occur as a result of the completion of a major expansion or major retracement and be aware of when major pivots in price relating to major expansions and major retracements by managing expectations from a time perspective.
*Important to understand* : If price is currently in a Wave Degree Extension or a Very Complex Correction, the wave degree timings will be distorted (extended in time).
Example: A Cycle typically lasts a few years - yet can last a decade(s) in an Extension.
It’s best to keep the analysis on the Minute/Minuette timeframe to manage timing expectations yet always refer back to the Higher Time Frame Structure.***
# Correct Usage
BEFORE PLACING THE ANCHOR TO DISPLAY ZONES:
Completion of prior wave structure should be completed and there needs to be confirmation the next wave structure is in progression, such as a change in market structure.
Anchor :
Best to anchor on the higher time frame to ensure you always have the anchor point defined when you scale down/move down in the timeframes.
Ensure the anchor point is placed at the termination of a structure/beginning of a new structure (Generally they will be price extremes – extreme highs and lows)
Zones :
Minimum Zones : The minimum amount of time of completion for a single wave structure to complete for a degree.
Average Zones : The average amount of time of completion for a single wave structure to complete for a degree.
Maximum Zones : The general maximum amount of time of completion for a single wave structure to complete for a degree.
Wave Degree Timeframe Analysis :
Higher-Level Degrees (Primary, Intermediate, Minor) - Utilize on H4+ timeframe
Lower-Level Degrees (Minute, Minuette, Subminuette) – Utilize on 15M to H4 timeframe
Micro-Level Degrees (Micro and Submicro) – Utilize on timeframes less than 15M
(There is a chart in the settings you can toggle on/off that reiterates this as well.)
# Settings
Y-Axis Offset :
It is a scale relative to the asset being viewed. Example:
- If using on Bitcoin, Bitcoin moves on average $1,000 of dollars up or down (on the Y-Axis), therefore it would be relevant to use values with 4 nominal values to offset it correctly to view easier on the chart as needed.
- If using on SP500, SP500 moves on average $50-100 of dollars up or down (on the Y-Axis), therefore it would be relevant to use values with 2 or 3 nominal values to offset it correctly to view easier on the chart as needed.
Extend :
This option allows to extend lines for the borders of the zones towards price action.
Fibonacci Sequence Moving Average [BackQuant]Fibonacci Sequence Moving Average with Adaptive Oscillator
1. Overview
The Fibonacci Sequence Moving Average indicator is a two‑part trading framework that combines a custom moving average built from the famous Fibonacci number set with a fully featured oscillator, normalisation engine and divergence suite. The moving average half delivers an adaptive trend line that respects natural market rhythms, while the oscillator half translates that trend information into a bounded momentum stream that is easy to read, easy to compare across assets and rich in confluence signals. Everything from weighting logic to colour palettes can be customised, so the tool comfortably fits scalpers zooming into one‑minute candles as well as position traders running multi‑month trend following campaigns.
2. Core Calculation
Fibonacci periods – The default length array is 5, 8, 13, 21, 34. A single multiplier input lets you scale the whole family up or down without breaking the golden‑ratio spacing. For example a multiplier of 3 yields 15, 24, 39, 63, 102.
Component averages – Each period is passed through Simple Moving Average logic to produce five baseline curves (ma1 through ma5).
Weighting methods – You decide how those five values are blended:
• Equal weighting treats every curve the same.
• Linear weighting applies factors 1‑to‑5 so the slowest curve counts five times as much as the fastest.
• Exponential weighting doubles each step for a fast‑reacting yet still smooth line.
• Fibonacci weighting multiplies each curve by its own period value, honouring the spirit of ratio mathematics.
Smoothing engine – The blended average is then smoothed a second time with your choice of SMA, EMA, DEMA, TEMA, RMA, WMA or HMA. A short smoothing length keeps the result lively, while longer lengths create institution‑grade glide paths that act like dynamic support and resistance.
3. Oscillator Construction
Once the smoothed Fib MA is in place, the script generates a raw oscillator value in one of three flavours:
• Distance – Percentage distance between price and the average. Great for mean‑reversion.
• Momentum – Percentage change of the average itself. Ideal for trend acceleration studies.
• Relative – Distance divided by Average True Range for volatility‑aware scaling.
That raw series is pushed through a look‑back normaliser that rescales every reading into a fixed −100 to +100 window. The normalisation window defaults to 100 bars but can be tightened for fast markets or expanded to capture long regimes.
4. Visual Layer
The oscillator line is gradient‑coloured from deep red through sky blue into bright green, so you can spot subtle momentum shifts with peripheral vision alone. There are four horizontal guide lines: Extreme Bear at −50, Bear Threshold at −20, Bull Threshold at +20 and Extreme Bull at +50. Soft fills above and below the thresholds reinforce the zones without cluttering the chart.
The smoothed Fib MA can be plotted directly on price for immediate trend context, and each of the five component averages can be revealed for educational or research purposes. Optional bar‑painting mirrors oscillator polarity, tinting candles green when momentum is bullish and red when momentum is bearish.
5. Divergence Detection
The script automatically looks for four classes of divergences between price pivots and oscillator pivots:
Regular Bullish, signalling a possible bottom when price prints a lower low but the oscillator prints a higher low.
Hidden Bullish, often a trend‑continuation cue when price makes a higher low while the oscillator slips to a lower low.
Regular Bearish, marking potential tops when price carves a higher high yet the oscillator steps down.
Hidden Bearish, hinting at ongoing downside when price posts a lower high while the oscillator pushes to a higher high.
Each event is tagged with an ℝ or ℍ label at the oscillator pivot, colour‑coded for clarity. Look‑back distances for left and right pivots are fully adjustable so you can fine‑tune sensitivity.
6. Alerts
Five ready‑to‑use alert conditions are included:
• Bullish when the oscillator crosses above +20.
• Bearish when it crosses below −20.
• Extreme Bullish when it pops above +50.
• Extreme Bearish when it dives below −50.
• Zero Cross for momentum inflection.
Attach any of these to TradingView notifications and stay updated without staring at charts.
7. Practical Applications
Swing trading trend filter – Plot the smoothed Fib MA on daily candles and only trade in its direction. Enter on oscillator retracements to the 0 line.
Intraday reversal scouting – On short‑term charts let Distance mode highlight overshoots beyond ±40, then fade those moves back to mean.
Volatility breakout timing – Use Relative mode during earnings season or crypto news cycles to spot momentum surges that adjust for changing ATR.
Divergence confirmation – Layer the oscillator beneath price structure to validate double bottoms, double tops and head‑and‑shoulders patterns.
8. Input Summary
• Source, Fibonacci multiplier, weighting method, smoothing length and type
• Oscillator calculation mode and normalisation look‑back
• Divergence look‑back settings and signal length
• Show or hide options for every visual element
• Full colour and line width customisation
9. Best Practices
Avoid using tiny multipliers on illiquid assets where the shortest Fibonacci window may drop under three bars. In strong trends reduce divergence sensitivity or you may see false counter‑trend flags. For portfolio scanning set oscillator to Momentum mode, hide thresholds and colour bars only, which turns the indicator into a heat‑map that quickly highlights leaders and laggards.
10. Final Notes
The Fibonacci Sequence Moving Average indicator seeks to fuse the mathematical elegance of the golden ratio with modern signal‑processing techniques. It is not a standalone trading system, rather a multi‑purpose information layer that shines when combined with market structure, volume analysis and disciplined risk management. Always test parameters on historical data, be mindful of slippage and remember that past performance is never a guarantee of future results. Trade wisely and enjoy the harmony of Fibonacci mathematics in your technical toolkit.

Advanced Hurst Cycle + VTL + Turning Points| Timeframe | Cycle Base | Use Case | Notes |
| ------------ | ---------- | ------------------ | ------------------------- |
| 5-min | 16–20 bars | Intraday scalping | Tight SL, fast moves |
| 15-min / 1hr | 20–40 bars | Intraday to swing | Good for options intraday |
| Daily | 20–40 bars | Multi-day swings | Ideal for Futures/ST BTST |
| Weekly | 13–26 bars | Position/Investing | For macro turns |
Guide to Trading with JM Hurst Cycles in TradingView
1. What is JM Hurst Cycle Theory?
JM Hurst proposed that financial markets move in harmonically related cycles. These cycles can help traders
forecast turning points in markets using time-based analysis rather than just price.
Key Concepts:
- Cycle Nesting: Smaller cycles exist within larger ones.
- Harmonic Ratios: Each cycle is typically double the length of the smaller one (e.g., 20, 40, 80).
- Turning Points: When multiple cycles bottom together, strong reversals occur.
- Tools: FLD (Future Line of Demarcation), VTL (Valid Trend Lines).
2. TradingView Script Features
The provided Pine Script v5 implements:
- FLDs (shifted SMAs) for base and harmonic cycles.
- VTLs: Drawn between major pivot highs/lows to confirm trend reversals.
- Cycle Turning Points: Detected using pivot logic and cycle phase.
- Optional: Sine wave to visualize cycle rhythm.
Inputs:
- Base Cycle Length: Set the expected cycle duration (e.g., 20 bars).
- FLD/VTL/Turn toggles to customize chart view.
3. How to Trade with This Script
1. Set 'Base Cycle Length' to 20, 40, or 80 depending on your market and timeframe.
2. Watch for price crossing the FLD:
- Bullish Signal: Price crosses above FLD near cycle bottom.
- Bearish Signal: Price breaks below FLD near cycle top.
3. Use VTL for confirmation:
Guide to Trading with JM Hurst Cycles in TradingView
- Break of upward VTL from cycle lows = bearish shift.
- Break of downward VTL from cycle highs = bullish shift.
4. Use turning point markers:
- Triangle up (green): Probable cycle bottom - watch for long.
- Triangle down (red): Probable cycle top - prepare for exit or short.
Tips:
- Align multiple cycle lengths for stronger confirmation.
- Use with other technical indicators like RSI/MACD for confluence.
- Avoid trading just before major news events - cycles can distort.
4. Example Strategy
If base cycle is 20 bars:
- Wait for triangle up (cycle low) near FLD.
- Confirm price crosses above FLD.
- Ensure VTL from prior lows is intact or just broken upward.
- Enter long; set stop below recent low.
Opposite for shorts at triangle down + FLD break down + VTL break.
5. Final Notes
This script offers a time-based visual trading method inspired by JM Hurst. It's most powerful when used with
patience, confirmation, and alignment across cycles.
You can adjust cycle lengths or refine pivots based on your trading timeframe and asset class.
For best results, backtest cycle behavior on your instrument before live trading.

Expansion Triangle [TradingFinder] MegaPhone Broadening🔵 Introduction
The Expanding Triangle, also known as the Broadening Formation, is one of the key technical analysis patterns that clearly reflects growing market volatility, increasing indecision among participants, and the potential for sharp price explosions.
This pattern is typically defined by a sequence of higher highs and lower lows, forming within two diverging trendlines. Unlike traditional triangles that converge to a breakout point, the expanding triangle pattern becomes wider over time, leaving no precise apex for a breakout to occur.
From a price action perspective, the pattern represents a prolonged tug-of-war between buyers and sellers, where neither side has taken control yet. Each aggressive swing opens the door to new opportunities whether it's a trend reversal, range trading, or a momentum breakout. This dual nature makes the pattern highly versatile across market conditions, from exhausted trend ends to volatile consolidation zones.
The custom-built indicator for this pattern uses a combination of smart algorithms and detailed analysis of swing dynamics to automatically detect expanding triangles and highlight low-risk entry points.
Traders can use this tool to capitalize on high-probability setups from shorting near the upper edge of the structure with confirmation, to trading bearish breakouts during trend continuations, or entering long positions near the lower boundary during bullish reversals. The chart examples included in this article demonstrate these three highly practical trading scenarios in live market conditions.
A major advantage of this indicator lies in its structural filtering engine, which analyzes the behavior of each price leg in the triangle. With four adjustable filter levels from Very Aggressive, which highlights all potential patterns, to Very Defensive, which only triggers when price actually touches the triangle's trendlines the indicator ensures that only structurally sound and verified setups appear on the chart, reducing noise and false signals significantly.
Long Setup :
Short Setup :
🔵 How to Use
The pattern typically forms in conditions of heightened uncertainty and volatility, where price swings generate a series of higher highs and lower lows. The expanding triangle consists of three key legs bounded by diverging trendlines. The indicator intelligently analyzes each leg's direction and angle to determine whether a valid pattern is forming.
At the core of the indicator’s logic is its leg filtering system, which controls the quality of the pattern and filters out weak or noisy setups. Four structural filter modes are available to suit different trading styles and risk preferences. In Very Aggressive mode, filters are disabled, and the indicator detects any pattern purely based on the sequence of swing points.
This mode is ideal for traders who want to see everything and apply their own discretion.
In Aggressive mode, the indicator checks whether each new leg extends no more than twice the length of the previous one. If a leg overshoots excessively, the structure is invalidated.
In Defensive mode, the filter enforces a minimum movement requirement each leg must move at least 2% of the previous one. This prevents the formation of shallow, weak patterns that visually resemble triangles but lack substance.
The strictest setting, Very Defensive, combines all previous filters and additionally requires the price to physically touch the triangle’s trendlines before issuing a signal. This ensures that setups only appear when real market interaction with key structural levels has occurred, not based on assumptions or geometry alone. This mode is ideal for traders seeking maximum precision and minimal risk.
🟣 Bullish Setup
A bullish setup within the Expanding Triangle pattern occurs when price revisits the lower support boundary after a series of broad swings typically near the third leg of the formation. This area often represents a shift in momentum, where sellers begin to lose strength and buyers prepare to take control.
Ideally, the setup is accompanied by a bullish reversal candle (e.g. doji, pin bar, or engulfing) near the lower trendline. If the Very Defensive filter is active, the indicator will only issue a signal if price makes a confirmed touch on the trendline and reacts from that level. This significantly improves signal accuracy and filters out premature entries.
After confirmation, traders may choose to enter a long position on the bullish candle or shortly afterward. A logical stop-loss is placed just below the recent swing low within the pattern. The target can be set at or near the upper trendline, or projected using the full height of the triangle added to the breakout point. On higher timeframes, this reversal often marks the beginning of a strong uptrend.
🟣 Bearish Setup
A bearish setup forms when price climbs toward the upper resistance trendline, usually as the third leg completes. This is where buyers often begin to show exhaustion, and sellers step in with strength providing an ideal low-risk entry point for short positions.
As with the bullish setup, if the Candle Confirmation filter is enabled, the indicator will only show a signal when a bearish reversal candle forms at the point of contact. If Defensive or Very Defensive filters are also active, the setup must meet strict criteria of proportionate leg movement and an actual trendline touch to qualify.
Once confirmed, traders can enter on the reversal candle, placing a stop-loss slightly above the recent high. The target can be set at the lower trendline or calculated based on the triangle's full height, projected downward. This setup is particularly useful at the end of weak bullish trends or in volatile market tops.
🔵 Settings
🟣 Logic Settings
Pivot Period : Defines how many bars are analyzed to identify swing highs and lows. Higher values detect larger, slower structures, while lower values respond to faster patterns. The default value of 13 offers a balanced sensitivity.
Pattern Filter :
Very Aggressive : Detects all patterns based on point sequence with no structural checks.
Aggressive : Ensures each leg is no more than 2x the size of the previous one.
Defensive : Requires each leg to be at least 2% the size of the previous leg.
Very Defensive : The strictest level; only confirms patterns when price touches trendlines.
Candle Confirmation : When enabled, the indicator requires a valid confirmation candle (doji, pin bar, engulfing) at the interaction point with the trendline before issuing a signal. This reduces false entries and improves entry precision.
🟣 Alert Settings
Alert : Enables alerts for SSS.
Message Frequency : Determines the frequency of alerts. Options include 'All' (every function call), 'Once Per Bar' (first call within the bar), and 'Once Per Bar Close' (final script execution of the real-time bar). Default is 'Once per Bar'.
Show Alert Time by Time Zone : Configures the time zone for alert messages. Default is 'UTC'.
🔵 Conclusion
The Expanding Triangle pattern, with its wide structure and volatility-driven nature, represents chaos but also opportunity. For traders who can read its behavior, it provides some of the most powerful setups for reversals, breakouts, and range-based trades. While the pattern may seem messy at first glance, it is built on clear logic and when properly detected, it offers high-probability opportunities.
This indicator doesn’t just draw expanding triangles it intelligently evaluates their structural quality, validates price interaction through candle confirmation, and allows the trader to fine-tune the detection logic through adjustable filter levels. Whether you’re a reversal trader looking for a turning point, or a breakout trader hunting momentum, this tool adapts to your strategy.
In volatile or uncertain markets, where fakeouts and sudden shifts are common, this indicator can become a cornerstone of your trading system helping you turn volatility into structured, high-quality opportunities.

Polaris Trend All-in-One📘 Polaris Trend Indicator: Trading Rules & Strategy
Guide
The Polaris Trend Indicator is designed to simplify trading decisions by identifying key entry
and exit signals without the need for excessive technical analysis. This system combines the
Polaris Trend with the Polaris Golden Wave and Market Bias tools to give you confidence
across multiple timeframes.
This guide outlines clear trading rules for two use cases:
● Swing Trading
● Long-Term Investing and Holding
⚡ Swing Trading Strategy
Swing trading can be challenging when the market direction is unclear. The Polaris Trend helps
traders stay on the right side of momentum with straightforward visual signals. This approach is
best used on the Daily or Weekly chart.
✅ Entry Criteria (Bullish Trades)
● A solid green column appears above the zero line.
● A green upward arrow confirms bullish momentum.
● Enter your trade immediately when the green column first appears.
● Hold the trade until a red column appears, signaling a shift in momentum.
🚫 Exit Criteria (Bullish Trades)
● The first appearance of a red column after a green run.
● Multiple green columns followed by a red column.
● Do not enter trades mid-trend; always enter on the first green flip.
***Recommended Swing Strategy
● When a new daily green column appears but the weekly columns are still red, stay
nimble. Enter your position when the Polaris Trend Indicator turns green and displays an
upward-pointing arrow.
● If the price pulls back to a higher low but a red daily column forms, sell 50% of your
position and move your stop loss to your original entry. Then, wait for the next daily
green column and arrow to reappear, this is your signal to reenter the 50% you exited.
● If the price continues to rise and the weekly columns also turn green, shift your focus
to the weekly chart. Ignore daily signals and hold the trade until the weekly column
turns red, which will be your cue to exit. The weekly green column is your confirmation of
a stronger uptrend and a potential longer hold.
🔻 Entry Criteria (Bearish Trades)
● A solid red column appears below the zero line.
● A red downward arrow confirms bearish momentum.
● Enter your short trade immediately when the red column first appears.
● Hold until a green column appears, indicating momentum has shifted.
🔁 Exit Criteria (Bearish Trades)
● The first green column that follows a red sequence.
● Same rule applies: enter only on the initial flip, not mid-trend.
Note: The first color flip is the most reliable entry point. Avoid entering positions
deep into a trend, wait for the clear signal from Polaris.
🧭 Long-Term Investing Strategy
This approach combines the Polaris Golden Wave, Polaris Trend, and Market Bias to help
long-term investors buy at deep value levels and scale into positions over time.
📉 Ideal Entry: Golden Zone + Polaris Trend Signal
● Use the Golden Wave to identify the monthly 0.618–0.826 retracement zone
(significant discount levels).
● When price enters the Golden Zone and the Polaris Trend shows a green column on
the Daily or Weekly, this is your optimal entry point.
● If the trend turns red inside the zone, consider trimming positions and re-entering on the
next bullish signal.
If price drops below the Golden Zone, the stock becomes even more undervalued,
wait for the next green Polaris Trend signal to enter.
💰 Secondary Entry: Market Bias Rebounds
● If you miss the Golden Zone entry or are dollar-cost averaging:
○ Use the Market Bias on a Weekly timeframe.
○ Wait for price to retrace into the Market Bias band after moving higher.
○ Look for a red Polaris Trend column, then wait for price to enter the Market
Bias band and once it enters, wait for Polaris Trend signal to flip back to green
for your entry. If the trend turns red inside the zone, consider trimming positions
and re-entering on the next bullish signal.
Think of the Market Bias like a lake and price like a skipping stone—you want to
buy when the stone comes down and touches the surface.
📊 Indicator Explanations
🔶 Golden Wave (Monthly Fibonacci Retracement Zones)
● Highlights key monthly retracement zones (0.618 to 0.826).
● Helps identify deep-value entries on longer timeframes.
● Visible across all chart timeframes for consistent macro reference.
🔴 Market Bias (Smoothed Heikin-Ashi Trend Filter)
● Measures trend direction and strength using smoothed Heikin-Ashi candles and
oscillation logic.
● Customizable smoothing, oscillator period, and timeframe inputs.
● Option to display trend signals in a separate pane with dynamic coloring.
This combined approach empowers traders to make high-quality decisions with clarity and
discipline. Whether you're entering short-term swings or building long-term positions, the
Polaris Trend system guides you with timely, data-driven signals.
