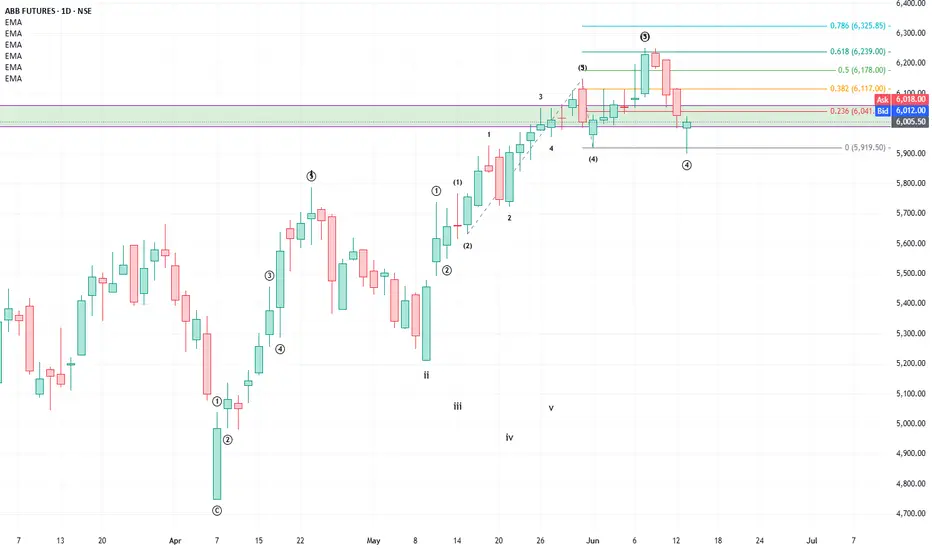
After long correction in the form of Wave WXYXZ, ABB has been forming a new impulse wave.
It had completed wave (i) and (ii) of the impulse wave and has been forming wave (iii) which normally is an extended wave, i.e. it forms its own 5-wave pattern with sub-wave 3 having another extension. The wave markings are given in the chart which is self-explanatory.
Stock has taken support of sub-impulse wave (4) and has formed a bullish hammer. Buy with a target of 6239 with a timeframe of 3-5 days and maintain strict stoploss below the hammer candle.
The stock can also be traded in the cash market for a higher target (% terms) with a 1-month timeframe.
トレード終了: ストップロスに到達
View negated, stop loss hit.ChartTheWave |
Join my telegram channel t.me/chartthewave for live updates
Join my telegram channel t.me/chartthewave for live updates
免責事項
これらの情報および投稿は、TradingViewが提供または保証する金融、投資、取引、またはその他の種類のアドバイスや推奨を意図したものではなく、またそのようなものでもありません。詳しくは利用規約をご覧ください。
ChartTheWave |
Join my telegram channel t.me/chartthewave for live updates
Join my telegram channel t.me/chartthewave for live updates
免責事項
これらの情報および投稿は、TradingViewが提供または保証する金融、投資、取引、またはその他の種類のアドバイスや推奨を意図したものではなく、またそのようなものでもありません。詳しくは利用規約をご覧ください。