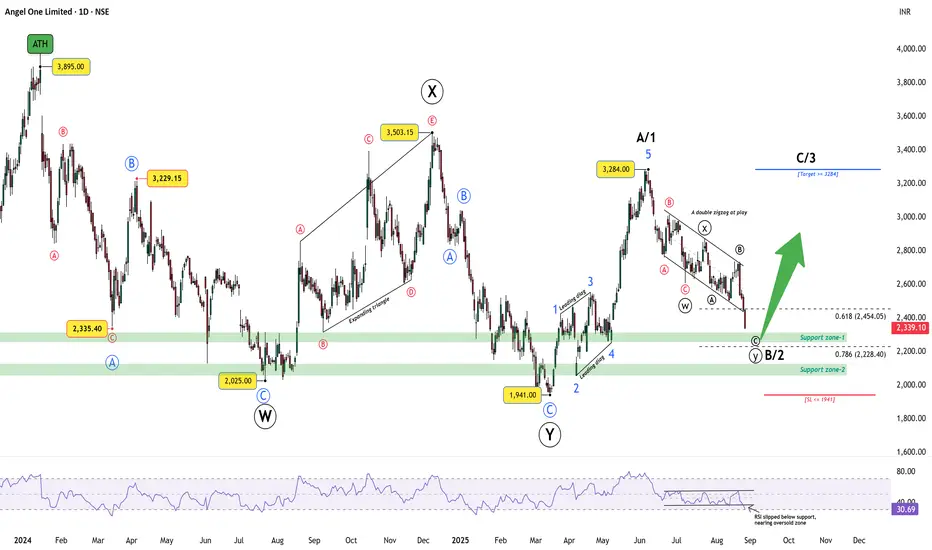
Angel One topped at an all-time high of 3895 before entering a corrective phase. The decline into 2025 marked Wave W, followed by a rally into 3503 as Wave X, and then a fall to 1941 completing Wave Y. From there, the stock advanced to 3284, counted as Wave A/1 with a leading diagonal.
The decline since 3284 has unfolded as a double zigzag (W–X–Y) within a parallel bearish channel. Wave Y is testing key supports at 2454 (0.618 Fib) and 2228 (0.786 Fib). RSI is near the oversold band around 30, setting up the possibility of bullish divergence if price makes a marginal new low. The bullish view remains valid above 1941; a close below this level invalidates the count.
Trade Plan:
Disclaimer: This analysis is for educational purposes only and does not constitute investment advice. Please do your own research (DYOR) before making any trading decisions.
The decline since 3284 has unfolded as a double zigzag (W–X–Y) within a parallel bearish channel. Wave Y is testing key supports at 2454 (0.618 Fib) and 2228 (0.786 Fib). RSI is near the oversold band around 30, setting up the possibility of bullish divergence if price makes a marginal new low. The bullish view remains valid above 1941; a close below this level invalidates the count.
Trade Plan:
- Bias: Expecting Wave B/2 to complete around 2228
- Trigger: Watch for bullish divergence or reversal candles near support
- Target: A break above 3284 would confirm Wave C/3
- Risk: Stop loss at 1941
Disclaimer: This analysis is for educational purposes only and does not constitute investment advice. Please do your own research (DYOR) before making any trading decisions.
WaveXplorer | Elliott Wave insights
📊 X profile: @veerappa89
📊 X profile: @veerappa89
免責事項
これらの情報および投稿は、TradingViewが提供または保証する金融、投資、取引、またはその他の種類のアドバイスや推奨を意図したものではなく、またそのようなものでもありません。詳しくは利用規約をご覧ください。
WaveXplorer | Elliott Wave insights
📊 X profile: @veerappa89
📊 X profile: @veerappa89
免責事項
これらの情報および投稿は、TradingViewが提供または保証する金融、投資、取引、またはその他の種類のアドバイスや推奨を意図したものではなく、またそのようなものでもありません。詳しくは利用規約をご覧ください。