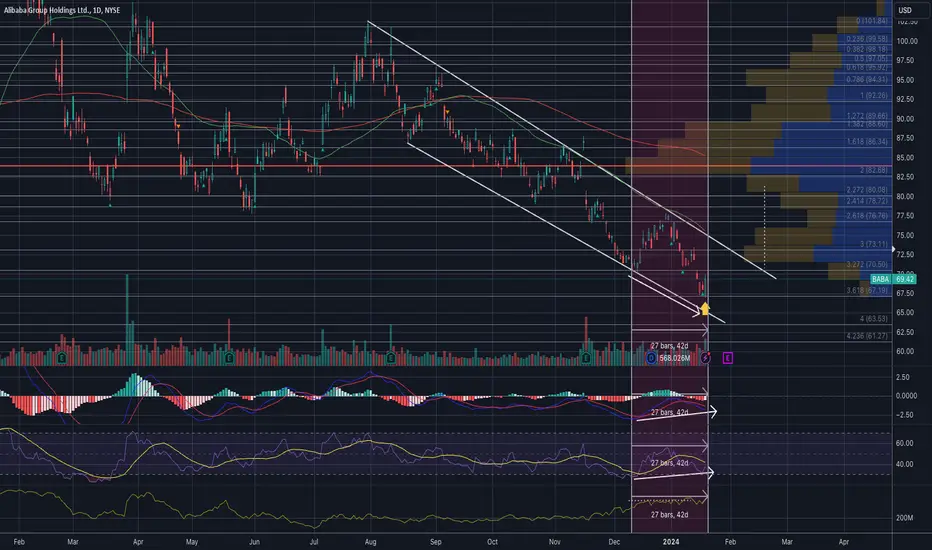
The Accumulation Distribution, MACD, and RSI all show bullish divergence, meaning accumulation is happening underneath while the price declined.
The weekly candle also printed a hammer candle, which means if the price can close above $70.50, it can see further gains.
Here are my upside targets:
$73
$76
$80
$85
Downside Risk:
$63
I post detailed technical analysis of stocks with targets. If you find my analysis helpful, please don't forget to give me a follow.
I am not a licensed professional. None of the posts that I published are investment advice. Do your own research.
免責事項
この情報および投稿は、TradingViewが提供または推奨する金融、投資、トレード、その他のアドバイスや推奨を意図するものではなく、それらを構成するものでもありません。詳細は利用規約をご覧ください。
I am not a licensed professional. None of the posts that I published are investment advice. Do your own research.
免責事項
この情報および投稿は、TradingViewが提供または推奨する金融、投資、トレード、その他のアドバイスや推奨を意図するものではなく、それらを構成するものでもありません。詳細は利用規約をご覧ください。