everyone can be intrested in this chart pattern, it DEPAND on indian economy, how does india grow this chart will tell ,
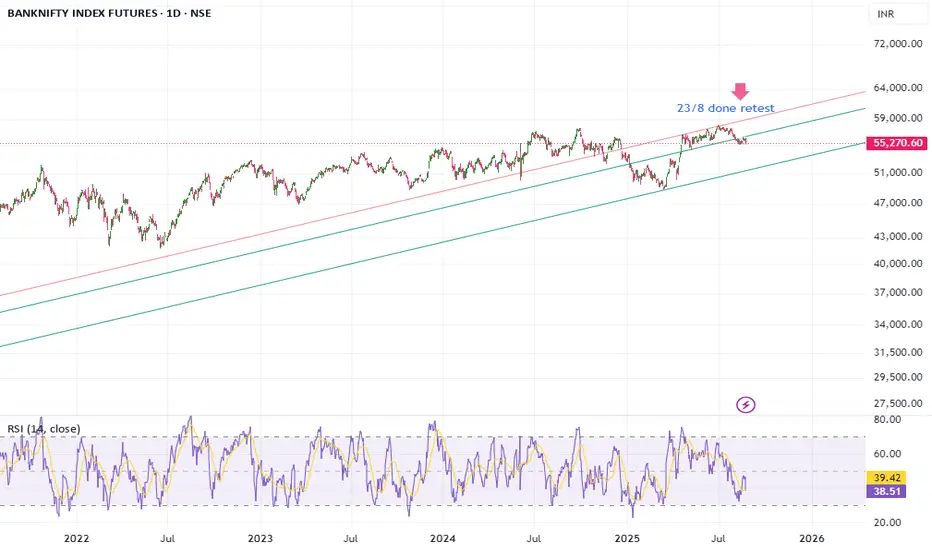
if looking at daily and long time channel , it is worry sign for indian economy, this chart have major spot that is very deep down, and it have alredy done retest of its above channel line, 52000- 52500 can work as spot , looking at chart pattern , and it can have very smll stop loss in it.
That is what this chart is saying right now , i wish if i m wrong
免責事項
これらの情報および投稿は、TradingViewが提供または保証する金融、投資、取引、またはその他の種類のアドバイスや推奨を意図したものではなく、またそのようなものでもありません。詳しくは利用規約をご覧ください。
免責事項
これらの情報および投稿は、TradingViewが提供または保証する金融、投資、取引、またはその他の種類のアドバイスや推奨を意図したものではなく、またそのようなものでもありません。詳しくは利用規約をご覧ください。