🟢
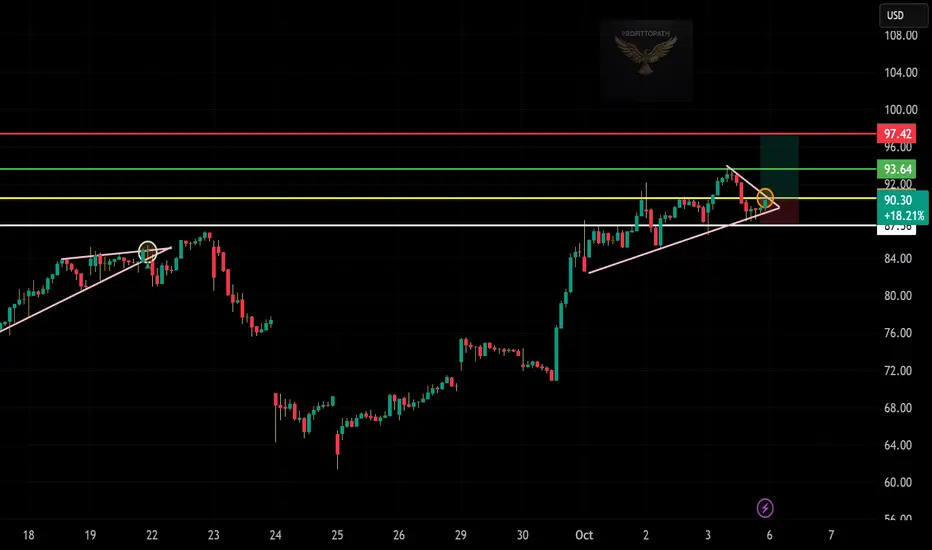
Price respecting ascending trendline support.
Forming a bullish wedge pattern — possible breakout setup.
Entry zone: around 90.0–90.3 (near wedge support).
Breakout confirmation: above 92.0–93.6 zone.
Target: 97.42
Stop-loss: below 87.56
Risk-Reward Ratio: around 1:2
Bias: Bullish while above the trendline — watch for breakout candle.
免責事項
これらの情報および投稿は、TradingViewが提供または保証する金融、投資、取引、またはその他の種類のアドバイスや推奨を意図したものではなく、またそのようなものでもありません。詳しくは利用規約をご覧ください。
免責事項
これらの情報および投稿は、TradingViewが提供または保証する金融、投資、取引、またはその他の種類のアドバイスや推奨を意図したものではなく、またそのようなものでもありません。詳しくは利用規約をご覧ください。