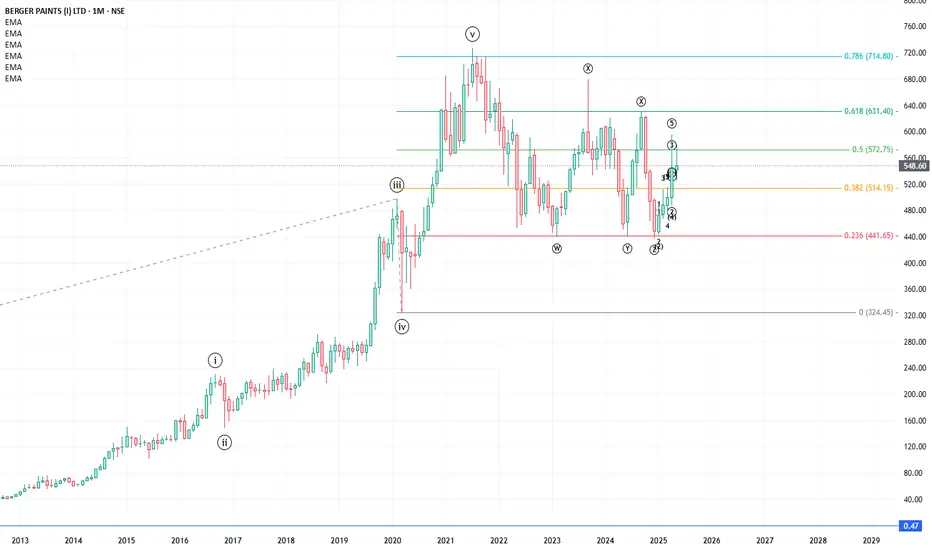
A stock after it reaches it 5th wave of larger degree undergoes either a price-wise correction or a time-wise correction or both. Here is a beautiful chart which depicts how Berger paint underwent a time-wise correction over 3 years as a WXYXZ pattern, concluding each wave at the same point.
ノート
Each of wave w,y,z concluded at the fibo extension of wave (0-iii to iv) of 0.236. Actual correction started in July 21 and ended in Dec 24. ChartTheWave |
t.me/chartthewave
This channel is a common forum for "Elliott Wave Principle" enthusiasts, learners and practitioners. We aim to build a team of traders who practice EWP for common benefit; co-learn, teach, share, validate and benefit.
t.me/chartthewave
This channel is a common forum for "Elliott Wave Principle" enthusiasts, learners and practitioners. We aim to build a team of traders who practice EWP for common benefit; co-learn, teach, share, validate and benefit.
免責事項
この情報および投稿は、TradingViewが提供または推奨する金融、投資、トレード、その他のアドバイスや推奨を意図するものではなく、それらを構成するものでもありません。詳細は利用規約をご覧ください。
ChartTheWave |
t.me/chartthewave
This channel is a common forum for "Elliott Wave Principle" enthusiasts, learners and practitioners. We aim to build a team of traders who practice EWP for common benefit; co-learn, teach, share, validate and benefit.
t.me/chartthewave
This channel is a common forum for "Elliott Wave Principle" enthusiasts, learners and practitioners. We aim to build a team of traders who practice EWP for common benefit; co-learn, teach, share, validate and benefit.
免責事項
この情報および投稿は、TradingViewが提供または推奨する金融、投資、トレード、その他のアドバイスや推奨を意図するものではなく、それらを構成するものでもありません。詳細は利用規約をご覧ください。