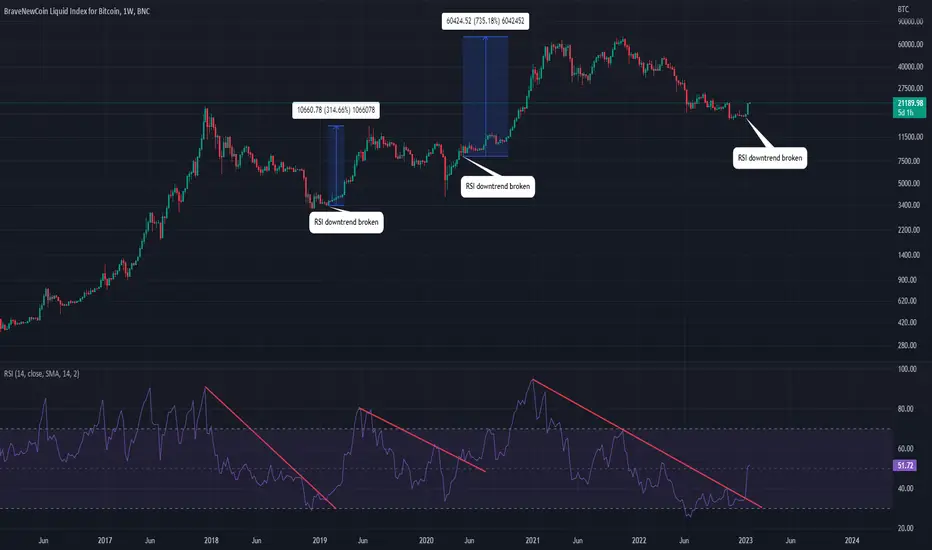
BTC has just recently breached its 2 year downtrend on the RSI. This is a very bullish indicator for the longer term. If we look back at 2018 we can see the RSI had a similar downwards sloping trendline that when broken led to a 300%+ pump. The second time this happened was during 2020. We had our downwards sloping trendline, broke above it and flipped it into new support before going on a 750%+ rally. Current day, we have just broken our downwards sloping trendline and have already almost pumped 40%. This does not mean we cannot have a retracement in the short term, but from a weekly perspective the bottom looks like it is in!
免責事項
これらの情報および投稿は、TradingViewが提供または保証する金融、投資、取引、またはその他の種類のアドバイスや推奨を意図したものではなく、またそのようなものでもありません。詳しくは利用規約をご覧ください。
免責事項
これらの情報および投稿は、TradingViewが提供または保証する金融、投資、取引、またはその他の種類のアドバイスや推奨を意図したものではなく、またそのようなものでもありません。詳しくは利用規約をご覧ください。