Markets love to repeat themselves.
But just because something repeats, doesn’t mean it’s predictable — or useful.
Let’s break down the main types of market cycles that traders talk about, and more importantly, let’s call out their flaws. No sugarcoating.
🔹 1. Time Cycles
These are based on the idea that price behaves in a similar way over specific time intervals — whether it’s 90 days, 4 years, or a custom Fibonacci count.
They show up in seasonal patterns, halving cycles (like Bitcoin), or through tools like Gann, Hurst, or even basic cycle lines.
The problem?
– The exact timing is rarely clean. A 120-day cycle might play out in 87 days next time.
– Flat, choppy markets will destroy any cycle-based setup.
– Different timeframes show different "cycles," so good luck aligning them.
– Most cycle tools are complicated and impractical for real-time decision making.
🔹 2. Psychological Cycles
The famous emotional rollercoaster: Hope → Euphoria → Fear → Panic → Capitulation → Depression → Optimism.
Every bull and bear market goes through these in some form — in theory.
The problem?
– It’s almost entirely subjective. Everyone sees a different phase.
– You usually recognize the cycle only after it’s over.
– Emotions aren’t equal across all assets — BTC retail emotions ≠ S&P500 institutional sentiment.
– There’s no precise tool to measure this. You’re mixing vibes with candles.
🔹 3. Structural Cycles (e.g. Wyckoff)
This one’s more about price behavior itself — accumulation, markup, distribution, markdown. The idea is that markets rotate through these four structural phases again and again.
The problem?
– Identifying where you are in the structure is hard in real time.
– Markets don’t always follow the Wyckoff textbook. Sometimes they just... go.
– It relies heavily on volume — and that doesn’t always align.
– Traders love to force a structure where there isn’t one. Confirmation bias, anyone?
🔹 4. Macro Cycles
Classic economic boom and bust: Expansion → Peak → Recession → Trough.
These cycles move slow but shape everything — interest rates, employment, growth, and eventually, risk assets.
The problem?
– They’re way too slow to help short-term traders.
– Good luck timing the top or bottom of the economy.
– Governments and central banks constantly interfere with natural cycles.
– Most macro data is lagging, so you’re reacting to history, not forecasting the future.
🔹 5. Liquidity / Volume Cycles
This idea tracks capital flow: when liquidity comes in, prices rise. When it dries up, risk assets fall. Simple, right?
The problem?
– Volume isn’t universal. Crypto volume =/= stock volume =/= forex volume.
– You can’t always track capital flow accurately, especially in OTC markets.
– Low volume doesn’t always mean weakness — sometimes it’s just summer.
– Volume data can be misleading, especially on shady exchanges.
🔹 6. Fractal Cycles
Markets repeat — at every level. 5-minute looks like the 4-hour, which looks like the daily. Elliott wave, harmonic patterns, whatever — the idea is that patterns echo across timeframes.
The problem?
– Pattern recognition can be wildly subjective.
– The market doesn’t always care about geometry. Sometimes it’s just noise.
– By the time a pattern is “confirmed,” you missed the move.
– Focusing too much on pattern symmetry makes you blind to macro/fundamentals.
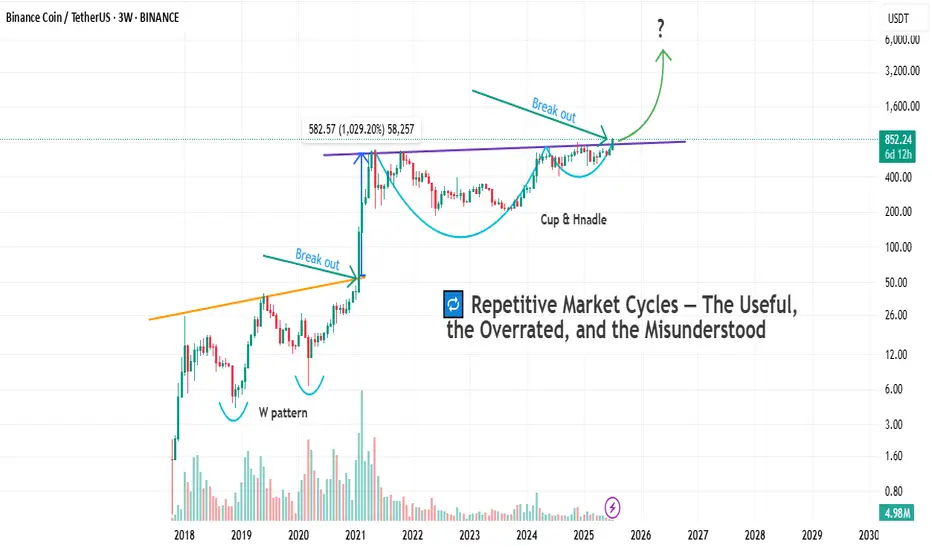
So after breaking all that down, let’s finally get to the chart in front of us.
Let’s take a closer look and see which cycle has actually played out here — and more importantly, which one actually helped :
As you can see on the chart, before every breakout above the previous all-time high, the market tends to form some sort of bottoming structure or reversal pattern.
And once that structure completes, the actual breakout usually leads to a solid price pump.
But here’s the key question:
Which one of the cycles we talked about earlier does this actually follow?
If you ask me, a professional trader will always try to use every tool available — not because any single one gives you the answer, but because combining them gets you closer to what's likely to happen.
And that’s what separates a well-rounded trader from a one-dimensional one.
Why do I say “one-dimensional”?
Because if you insist on looking at the market through a single lens, you’re bound to make bad decisions. We’re not here to prove our personal theories — we’re here to profit from what actually happens in the market, not what we think should happen.
In the chart above, we actually see a mix of all the cycles we talked about.
But I’d love to hear from you as well — let’s brainstorm together.
What do you see here as a trader?
And what’s your take on this setup?
Bottom Line
Yes, markets repeat.
But repetition doesn’t equal reliability.
Every cycle has its use — and its blind spot.
Know the difference. Use what fits your style.
And don’t romanticize a model just because it looks clean on a chart from six months ago.
But just because something repeats, doesn’t mean it’s predictable — or useful.
Let’s break down the main types of market cycles that traders talk about, and more importantly, let’s call out their flaws. No sugarcoating.
🔹 1. Time Cycles
These are based on the idea that price behaves in a similar way over specific time intervals — whether it’s 90 days, 4 years, or a custom Fibonacci count.
They show up in seasonal patterns, halving cycles (like Bitcoin), or through tools like Gann, Hurst, or even basic cycle lines.
The problem?
– The exact timing is rarely clean. A 120-day cycle might play out in 87 days next time.
– Flat, choppy markets will destroy any cycle-based setup.
– Different timeframes show different "cycles," so good luck aligning them.
– Most cycle tools are complicated and impractical for real-time decision making.
🔹 2. Psychological Cycles
The famous emotional rollercoaster: Hope → Euphoria → Fear → Panic → Capitulation → Depression → Optimism.
Every bull and bear market goes through these in some form — in theory.
The problem?
– It’s almost entirely subjective. Everyone sees a different phase.
– You usually recognize the cycle only after it’s over.
– Emotions aren’t equal across all assets — BTC retail emotions ≠ S&P500 institutional sentiment.
– There’s no precise tool to measure this. You’re mixing vibes with candles.
🔹 3. Structural Cycles (e.g. Wyckoff)
This one’s more about price behavior itself — accumulation, markup, distribution, markdown. The idea is that markets rotate through these four structural phases again and again.
The problem?
– Identifying where you are in the structure is hard in real time.
– Markets don’t always follow the Wyckoff textbook. Sometimes they just... go.
– It relies heavily on volume — and that doesn’t always align.
– Traders love to force a structure where there isn’t one. Confirmation bias, anyone?
🔹 4. Macro Cycles
Classic economic boom and bust: Expansion → Peak → Recession → Trough.
These cycles move slow but shape everything — interest rates, employment, growth, and eventually, risk assets.
The problem?
– They’re way too slow to help short-term traders.
– Good luck timing the top or bottom of the economy.
– Governments and central banks constantly interfere with natural cycles.
– Most macro data is lagging, so you’re reacting to history, not forecasting the future.
🔹 5. Liquidity / Volume Cycles
This idea tracks capital flow: when liquidity comes in, prices rise. When it dries up, risk assets fall. Simple, right?
The problem?
– Volume isn’t universal. Crypto volume =/= stock volume =/= forex volume.
– You can’t always track capital flow accurately, especially in OTC markets.
– Low volume doesn’t always mean weakness — sometimes it’s just summer.
– Volume data can be misleading, especially on shady exchanges.
🔹 6. Fractal Cycles
Markets repeat — at every level. 5-minute looks like the 4-hour, which looks like the daily. Elliott wave, harmonic patterns, whatever — the idea is that patterns echo across timeframes.
The problem?
– Pattern recognition can be wildly subjective.
– The market doesn’t always care about geometry. Sometimes it’s just noise.
– By the time a pattern is “confirmed,” you missed the move.
– Focusing too much on pattern symmetry makes you blind to macro/fundamentals.
So after breaking all that down, let’s finally get to the chart in front of us.
Let’s take a closer look and see which cycle has actually played out here — and more importantly, which one actually helped :
As you can see on the chart, before every breakout above the previous all-time high, the market tends to form some sort of bottoming structure or reversal pattern.
And once that structure completes, the actual breakout usually leads to a solid price pump.
But here’s the key question:
Which one of the cycles we talked about earlier does this actually follow?
If you ask me, a professional trader will always try to use every tool available — not because any single one gives you the answer, but because combining them gets you closer to what's likely to happen.
And that’s what separates a well-rounded trader from a one-dimensional one.
Why do I say “one-dimensional”?
Because if you insist on looking at the market through a single lens, you’re bound to make bad decisions. We’re not here to prove our personal theories — we’re here to profit from what actually happens in the market, not what we think should happen.
In the chart above, we actually see a mix of all the cycles we talked about.
But I’d love to hear from you as well — let’s brainstorm together.
What do you see here as a trader?
And what’s your take on this setup?
Bottom Line
Yes, markets repeat.
But repetition doesn’t equal reliability.
Every cycle has its use — and its blind spot.
Know the difference. Use what fits your style.
And don’t romanticize a model just because it looks clean on a chart from six months ago.
_____________________________________
🐺 Discipline is rarely enjoyable ,
But almost always profitable 🐺
TElEGRAM CHANNEL : t.me/KIU_COIN
_____________________________________
🐺 Discipline is rarely enjoyable ,
But almost always profitable 🐺
TElEGRAM CHANNEL : t.me/KIU_COIN
_____________________________________
関連の投稿
免責事項
これらの情報および投稿は、TradingViewが提供または保証する金融、投資、取引、またはその他の種類のアドバイスや推奨を意図したものではなく、またそのようなものでもありません。詳しくは利用規約をご覧ください。
_____________________________________
🐺 Discipline is rarely enjoyable ,
But almost always profitable 🐺
TElEGRAM CHANNEL : t.me/KIU_COIN
_____________________________________
🐺 Discipline is rarely enjoyable ,
But almost always profitable 🐺
TElEGRAM CHANNEL : t.me/KIU_COIN
_____________________________________
関連の投稿
免責事項
これらの情報および投稿は、TradingViewが提供または保証する金融、投資、取引、またはその他の種類のアドバイスや推奨を意図したものではなく、またそのようなものでもありません。詳しくは利用規約をご覧ください。