Technical Analysis and Outlook:
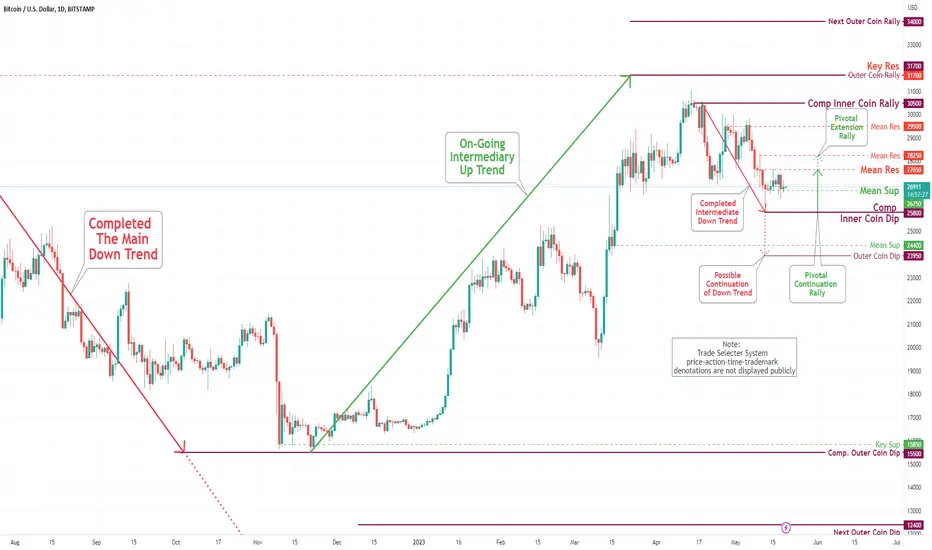
Throughout the week, the coin's prices remained relatively stable, fluctuating between the Completed Inner Coin Dip of $25,800 and the Mean Res of $27,650. However, the emergence of a new, less significant Mean Sup of $26,750 indicates the possibility of a drop in price to the Inner Coin Dip of $25,800 or even lower to the Outer Coin Dip of $23,950. Conversely, there is currently no indication of an increase in price action to and beyond the Mean Res of $27,650 and $28,250.
Throughout the week, the coin's prices remained relatively stable, fluctuating between the Completed Inner Coin Dip of $25,800 and the Mean Res of $27,650. However, the emergence of a new, less significant Mean Sup of $26,750 indicates the possibility of a drop in price to the Inner Coin Dip of $25,800 or even lower to the Outer Coin Dip of $23,950. Conversely, there is currently no indication of an increase in price action to and beyond the Mean Res of $27,650 and $28,250.
免責事項
これらの情報および投稿は、TradingViewが提供または保証する金融、投資、取引、またはその他の種類のアドバイスや推奨を意図したものではなく、またそのようなものでもありません。詳しくは利用規約をご覧ください。
免責事項
これらの情報および投稿は、TradingViewが提供または保証する金融、投資、取引、またはその他の種類のアドバイスや推奨を意図したものではなく、またそのようなものでもありません。詳しくは利用規約をご覧ください。