CARR’s chart is showing some very interesting price action setups. Let’s break it down step by step, moving from the higher timeframe to the lower timeframe for better clarity.
📊 Weekly Timeframe Analysis
On the weekly chart, price has approached a fresh demand zone. This zone stands out because:
🔎 Daily Timeframe Confluence
When we move down to the daily chart, the picture becomes even more convincing:
🎯 Trading Plan Perspective 🎯
Currently, price is still trading inside the daily demand zone. This creates a potentially favorable risk-to-reward opportunity.
✨ Stay patient, follow your plan, and let the market come to you. 🚀
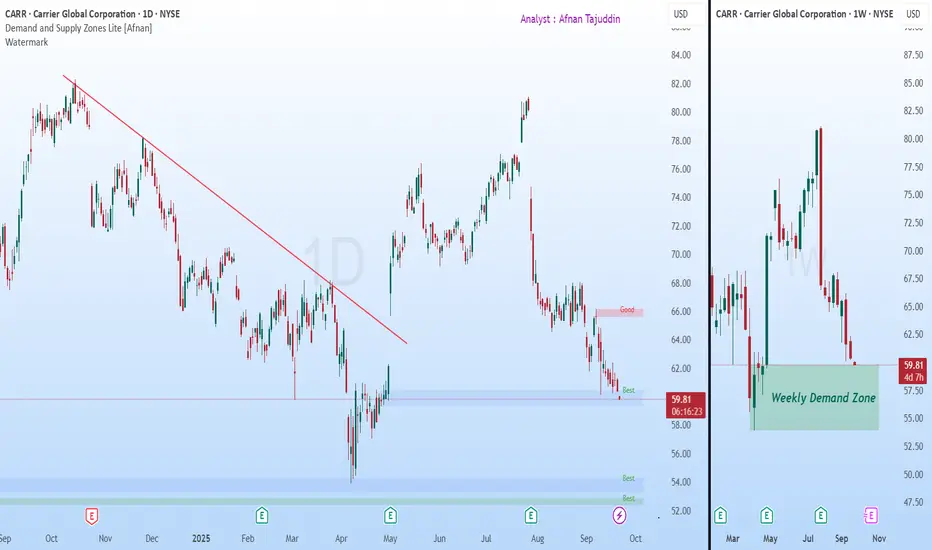
📊 Weekly Timeframe Analysis
On the weekly chart, price has approached a fresh demand zone. This zone stands out because:
- It was created by a very strong leg-out candle, showing institutional strength.
- The size and momentum of the move away from this level suggest it’s a high-quality zone.
🔎 Daily Timeframe Confluence
When we move down to the daily chart, the picture becomes even more convincing:
- Price has halted exactly at the daily demand zone.
- This daily zone is nested inside the weekly zone, giving a strong confluence.
- The formation candle of this daily demand zone was a sharp move up, confirming quality.
- The follow-through candle was a gap-up, showing aggressive buying interest.
- The follow-through candle from the daily demand zone has broken the downtrend trendline. This is a strong achievement of this zone, making it very good.
🎯 Trading Plan Perspective 🎯
Currently, price is still trading inside the daily demand zone. This creates a potentially favorable risk-to-reward opportunity.
- Wait for a clear sign of strength, such as a bullish candlestick pattern.
- Enter a long trade once confirmation is seen.
- Place your stop loss just below the demand zone.
- Target at least a 1:2 risk-to-reward ratio.
“Opportunities don’t come every day in trading, but when price aligns across timeframes, it’s worth paying close attention.”
✨ Stay patient, follow your plan, and let the market come to you. 🚀
Access the powerful Demand and Supply Zone Pro indicator at:
marketup2date.com
Stay updated on Telegram:
t.me/MarketUp2Date
Join our WhatsApp channel:
whatsapp.com/channel/0029Va6ByyH0LKZCc4Az4x0u
marketup2date.com
Stay updated on Telegram:
t.me/MarketUp2Date
Join our WhatsApp channel:
whatsapp.com/channel/0029Va6ByyH0LKZCc4Az4x0u
関連の投稿
免責事項
この情報および投稿は、TradingViewが提供または推奨する金融、投資、トレード、その他のアドバイスや推奨を意図するものではなく、それらを構成するものでもありません。詳細は利用規約をご覧ください。