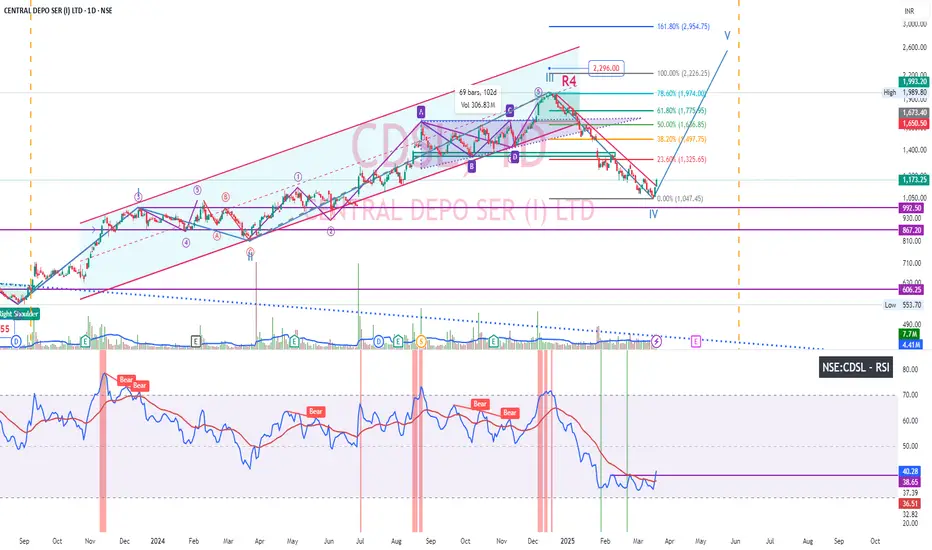
CDSL after reaching ascending triangle target exited parallel channel and corrected 37% and now taking up bullish reversal. Could see breakout in price chart of Daily timeframe. Also RSI breaking out after base formation. Weekly chart Bullish engulfing candlestick pattern.
トレード稼働中
Increased positionノート
CDSL if you've observed, it has bottomed out at bad results meaning market factored it. Hence didn't correct much on result day. Riding final wave関連の投稿
免責事項
これらの情報および投稿は、TradingViewが提供または保証する金融、投資、取引、またはその他の種類のアドバイスや推奨を意図したものではなく、またそのようなものでもありません。詳しくは利用規約をご覧ください。
免責事項
これらの情報および投稿は、TradingViewが提供または保証する金融、投資、取引、またはその他の種類のアドバイスや推奨を意図したものではなく、またそのようなものでもありません。詳しくは利用規約をご覧ください。