**Ceinsys Tech Ltd. (CEINSYS) | BSE**
**1. Fundamentals Snapshot**
* **Quarterly growth:** Q1 FY 2025–26 delivered ₹157 Cr in sales (+112% YoY), EBITDA of ₹30.3 Cr (+129%), and net profit ₹31.6 Cr (+166%). EPS came in at ₹18.14 vs ₹7.29 last year ([Moneycontrol][1], [Trendlyne.com][2]).
* **Valuation:** Trades at \~47× trailing P/E (median \~47–49), PB \~7×, Price/Sales \~5.7×–7× ([The Economic Times][3], [Reuters][4]). High growth priced into a small-cap (\~₹3,100 Cr) ([Reuters][4], [The Economic Times][3]).
* **Debt & Structure:** Low leverage (total debt/equity under 1.2), efficient operation, but long debtor cycle (\~221 days) may impact working capital ([screener.in][5]).
**2. Technical Setup & Chart Analysis**
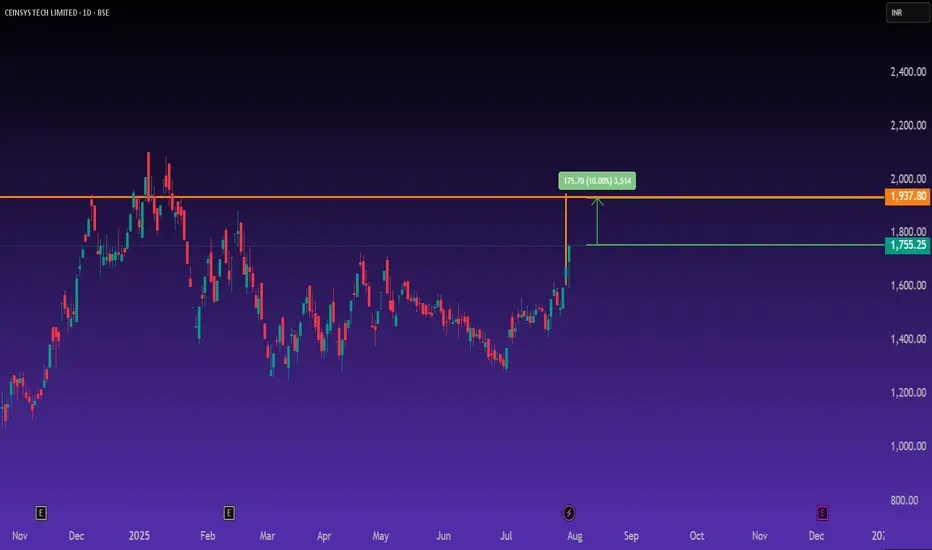
* **Trend:** The stock recently broke out strongly from a multi-month consolidation base around ₹1,400–1,500. At \~₹1,755, it has gained \~10% in recent session and volume spiked significantly ([investing.com][6]).
* **Momentum:** Technical ratings from TradingView classify it as Strong Buy across daily, weekly and monthly frames ﹘ a clear bullish bias driven by moving averages, MACD, RSI and Ichimoku alignments ([tradingview.com][7], [tradingview.com][8]).
* **Support/Resistance:** MarketScreener flags near-term support at ₹1,444, mid‑term support around ₹1,287; immediate resistance lies near ₹1,807 and then ₹2,011 (long-term) ([MarketScreener][9]).
* **Chart Tone:** The daily chart shows a series of higher highs and higher lows, marking a classical breakout—ideal for momentum traders with tight stops just below breakout origin (\~₹1,700).
**3. Risk‑Reward Outlook**
* **Upside potential:** Room to run to ₹1,937–2,000 if momentum sustains. That’s \~10–15% from current levels.
* **Risks:** High valuation leaves little margin for error; any slowdown in growth, expanding working capital, or adverse sentiment could lead to sharp pullbacks. Earnings surprises or delays may shake momentum.
**4. Trading Execution Plan**
* **Entry range:** ₹1,740–1,780 (on strength or retest of breakout zone).
* **Stop‑loss:** ₹1,685–1,700, just below prior congestion zone.
* **Target zones:** Take profits near ₹1,937–2,000, trail partial positions to capture extended move.
---
## 🖼️ Chart Interpretation
The chart clearly shows a bullish extension off a sideways base. The green line marks the breakout price (\~₹1,755), and the orange line above signals the next resistance zone near ₹1,937. Volume spiked markedly at breakout, highlighting institutional accumulation. The overall structure supports continuation toward ₹2,000, while recent consolidative levels form logical stop-loss zones.
---
**Summary:** Ceinsys Tech’s stellar Q1 earnings and breakout technical setup align well for momentum-based long strategies. With earnings momentum, improving margin, and strong price action, there’s a low‑risk entry for a measured upside. Valuation is rich but growth trajectory underpins it—for traders aligned to momentum, this remains a clear opportunity with tight risk control.
This analysis is for educational and informational purposes only. It is not investment advice or a recommendation to buy, sell, or hold any securities. Please do your own research (DYOR) and consult a SEBI‑registered financial advisor before making any investment or trading decisions. I am not SEBI registered.
免責事項
これらの情報および投稿は、TradingViewが提供または保証する金融、投資、取引、またはその他の種類のアドバイスや推奨を意図したものではなく、またそのようなものでもありません。詳しくは利用規約をご覧ください。
免責事項
これらの情報および投稿は、TradingViewが提供または保証する金融、投資、取引、またはその他の種類のアドバイスや推奨を意図したものではなく、またそのようなものでもありません。詳しくは利用規約をご覧ください。