Hello Traders,
Oil is at a true crossroads, testing whether the bull thesis shall be ruled correct.
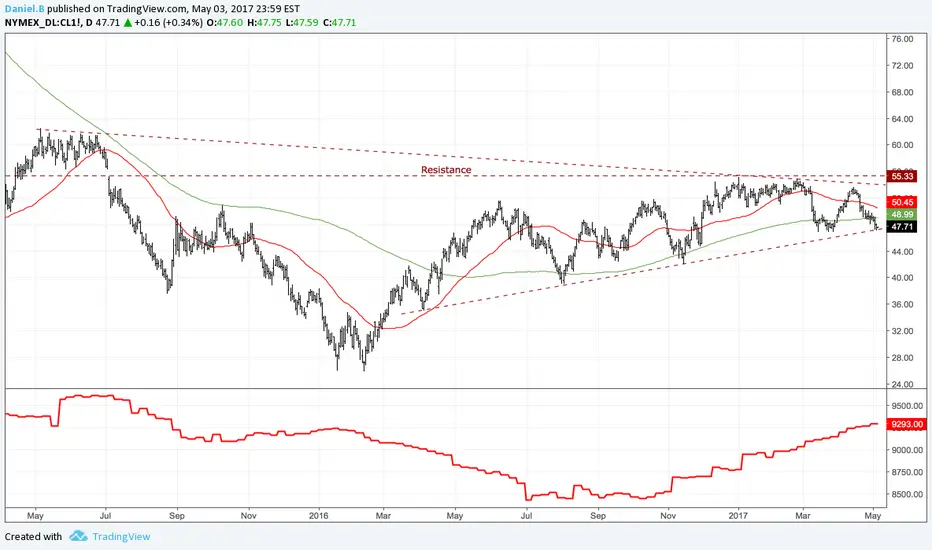
We have had a daily close below the 200ma and as P.T.J says,“One principle for sure would be: get out of anything that falls below the 200-day moving average.”
With that being said, oil has tested the uptrend multiple times and we are seeing some weakness across commodity markets as a whole. We are awaiting longer term short positions to trigger when all our filters are met, oil being one of them.
If I was looking to enter bullish then oil would have to close above YTD resistance at $55. That seems an unlikely scenario, but if oil can manage a close above there even though the fundamental narrative does not align then that is a clear display of momentum being skewed to the upside and we are long for a short period. For any bullish positioning on a break higher the immediate resistance level to monitor would be $60.
If we break lower and out of the triangle then I would be more inclined to short with some key support areas where I will shave some of the position off. Key support areas: $37-$39, $26, anything after $26 then I just hold on to the trend until it stops and reverses thus trailing me out of a position.
Please see the linked "related ideas" for some more info or proxy to the oil trade which has already begun. I also tend to update thoughts and technical analysis more often on my twitter page. Feel free to follow me: https://twitter.com/DannyB_NYC
Weekly Bar Chart: Wedge Continuation?

Oil is at a true crossroads, testing whether the bull thesis shall be ruled correct.
We have had a daily close below the 200ma and as P.T.J says,“One principle for sure would be: get out of anything that falls below the 200-day moving average.”
With that being said, oil has tested the uptrend multiple times and we are seeing some weakness across commodity markets as a whole. We are awaiting longer term short positions to trigger when all our filters are met, oil being one of them.
If I was looking to enter bullish then oil would have to close above YTD resistance at $55. That seems an unlikely scenario, but if oil can manage a close above there even though the fundamental narrative does not align then that is a clear display of momentum being skewed to the upside and we are long for a short period. For any bullish positioning on a break higher the immediate resistance level to monitor would be $60.
If we break lower and out of the triangle then I would be more inclined to short with some key support areas where I will shave some of the position off. Key support areas: $37-$39, $26, anything after $26 then I just hold on to the trend until it stops and reverses thus trailing me out of a position.
Please see the linked "related ideas" for some more info or proxy to the oil trade which has already begun. I also tend to update thoughts and technical analysis more often on my twitter page. Feel free to follow me: https://twitter.com/DannyB_NYC
Weekly Bar Chart: Wedge Continuation?
トレード稼働中
Triggered into a short position.Trade smart, and with a plan.
ノート
Current Fibonacci Levels *Daily Bars*Still trading well below Daily 200ma = Bearish Bias.
関連の投稿
免責事項
これらの情報および投稿は、TradingViewが提供または保証する金融、投資、取引、またはその他の種類のアドバイスや推奨を意図したものではなく、またそのようなものでもありません。詳しくは利用規約をご覧ください。
免責事項
これらの情報および投稿は、TradingViewが提供または保証する金融、投資、取引、またはその他の種類のアドバイスや推奨を意図したものではなく、またそのようなものでもありません。詳しくは利用規約をご覧ください。