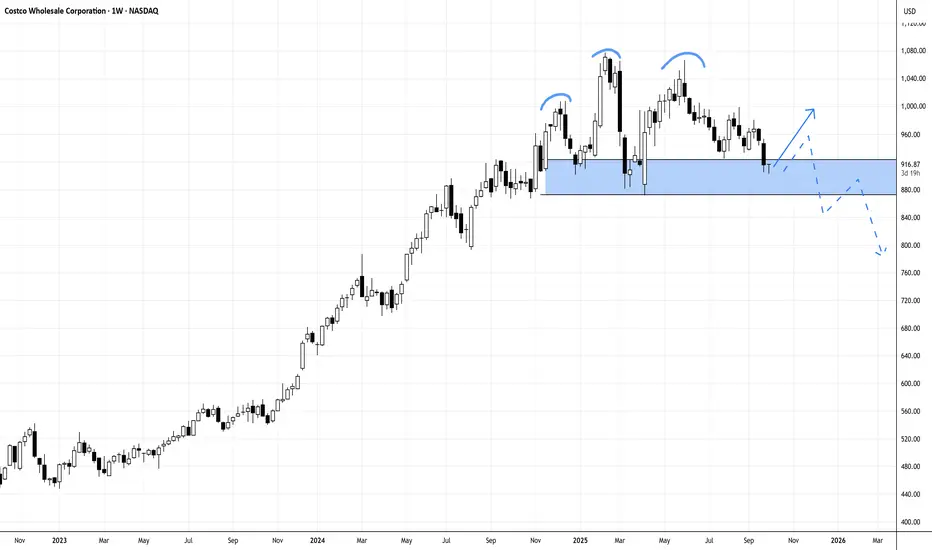
Costco (COST) has posted another strong fiscal year, with revenue climbing to $86.2B and net income up to $5.49B. However, the weekly chart is showing a developing head-and-shoulders pattern threatens the upside momentum, and price must hold above 871 with a rejection candle this week to avoid a deeper breakdown. A close below that level could confirm bearish continuation, despite Costco’s solid fundamentals.
N.B!
- COST price might not follow the drawn lines . Actual price movements may likely differ from the forecast.
- Let emotions and sentiments work for you
- ALWAYS Use Proper Risk Management In Your Trades
#cost
#nasdaq
#nyse
N.B!
- COST price might not follow the drawn lines . Actual price movements may likely differ from the forecast.
- Let emotions and sentiments work for you
- ALWAYS Use Proper Risk Management In Your Trades
#cost
#nasdaq
#nyse
Smart Monies trade on Emotions and Sentiments. Let them work for you in taking calculated risks...
-YouTube Channel: @bullbearmkt331
-Telegram: t.me/BullbearMkts
-YouTube Channel: @bullbearmkt331
-Telegram: t.me/BullbearMkts
免責事項
これらの情報および投稿は、TradingViewが提供または保証する金融、投資、取引、またはその他の種類のアドバイスや推奨を意図したものではなく、またそのようなものでもありません。詳しくは利用規約をご覧ください。