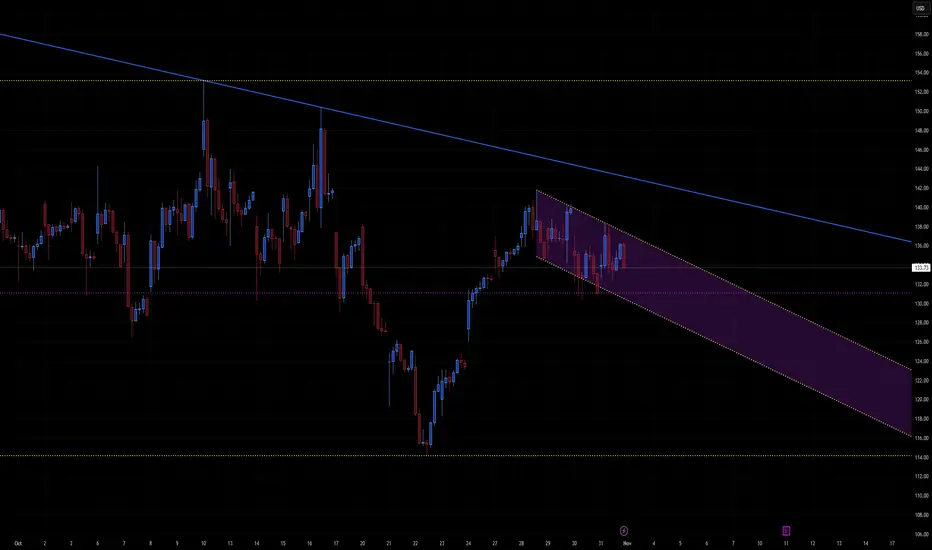
A descending parallel channel (purple shaded region) starting from the recent local high.
Current price near 133.7 USD, trading mid-channel.
Major horizontal supports around 130 and 116 (yellow dotted lines).
Overhead resistance near 138–140 USD and the top of the falling channel (~136–137 USD short-term).
This indicates controlled pullback within a bearish channel after a strong prior rebound — a typical flag pattern structure, which can resolve in either direction.
📈 Bullish Scenario
Setup:
Price has stabilized inside the descending channel and could stage a rebound if momentum returns.
Confirmation Triggers:
Break and daily close above 136–138 USD (channel breakout).
Volume pickup confirming accumulation rather than short covering.
Upside Targets:
144–146 USD → short-term resistance zone (top of previous consolidation).
150–154 USD → major target and measured-move projection from the flag pattern.
Catalysts:
Broader market risk-on sentiment (tech rebound, softer yields).
Positive company-specific or sector news.
Invalidation:
Daily close below 130 USD, re-entering lower half of channel.
📉 Bearish Scenario
Setup:
If price keeps respecting the descending channel and fails to reclaim 136–138 USD, the downtrend continues.
Confirmation Triggers:
Breakdown below 130 USD (support + midpoint of channel).
Bearish continuation with increasing volume.
Downside Targets:
122–124 USD → lower channel boundary (first logical support).
116 USD → key horizontal support and measured-move objective.
108–110 USD → extended bearish target if momentum accelerates.
Catalysts:
Market rotation out of growth / risk assets.
Rising yields or stronger dollar.
Invalidation:
Break and sustained close above 138 USD.
⚖️ Neutral / Range-Bound Outlook
Until price escapes 130–138 USD, expect choppy sideways trading within the channel.
Momentum indicators (RSI, volume) likely to flatten, signaling indecision before a larger move.
🧩 Summary Table
Bias Confirmation Target Zone Invalidation Notes
Bullish Close > 138 USD 144 → 150 → 154 USD < 130 USD Breakout of flag
Bearish Close < 130 USD 122 → 116 → 110 USD > 138 USD Continuation down
Neutral Range 130–138 USD — — Coiling phase
🕒 2–3 Week Projection
Bullish path: Price stabilizes 132–133 → breaks above 136 → targets 144 by mid-November.
Bearish path: Rejection at 136 → slips below 130 → tests 122–124 within next two weeks.
免責事項
この情報および投稿は、TradingViewが提供または推奨する金融、投資、トレード、その他のアドバイスや推奨を意図するものではなく、それらを構成するものでもありません。詳細は利用規約をご覧ください。
免責事項
この情報および投稿は、TradingViewが提供または推奨する金融、投資、トレード、その他のアドバイスや推奨を意図するものではなく、それらを構成するものでもありません。詳細は利用規約をご覧ください。