Current Chart Structure in CVOPRL:
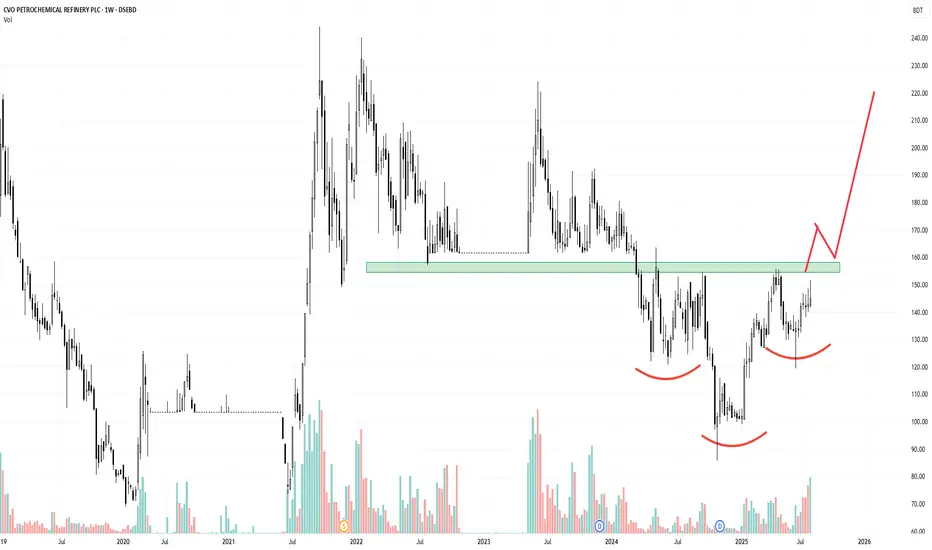
CVOPRL has been in a downtrend, but recently it's showing signs of reversal.
The price has formed a clear inverted head and shoulders pattern.
The neckline resistance is currently being tested.
Volume behavior shows early accumulation, which supports a bullish bias.
Momentum indicators (RSI/MACD) are starting to turn positive, suggesting bullish divergence with price.
Trading Plan & Strategy:
Don’t jump in early. Wait for confirmation.
What to watch for:
Breakout above the neckline with convincing volume.
Retest of the neckline support (previous resistance).
Bullish candle formation (like a hammer, bullish engulfing) during retest.
Entry Point: After a breakout and successful retest confirmation.
免責事項
これらの情報および投稿は、TradingViewが提供または保証する金融、投資、取引、またはその他の種類のアドバイスや推奨を意図したものではなく、またそのようなものでもありません。詳しくは利用規約をご覧ください。
免責事項
これらの情報および投稿は、TradingViewが提供または保証する金融、投資、取引、またはその他の種類のアドバイスや推奨を意図したものではなく、またそのようなものでもありません。詳しくは利用規約をご覧ください。