EOS Rising wedge pattern 1 hr chart
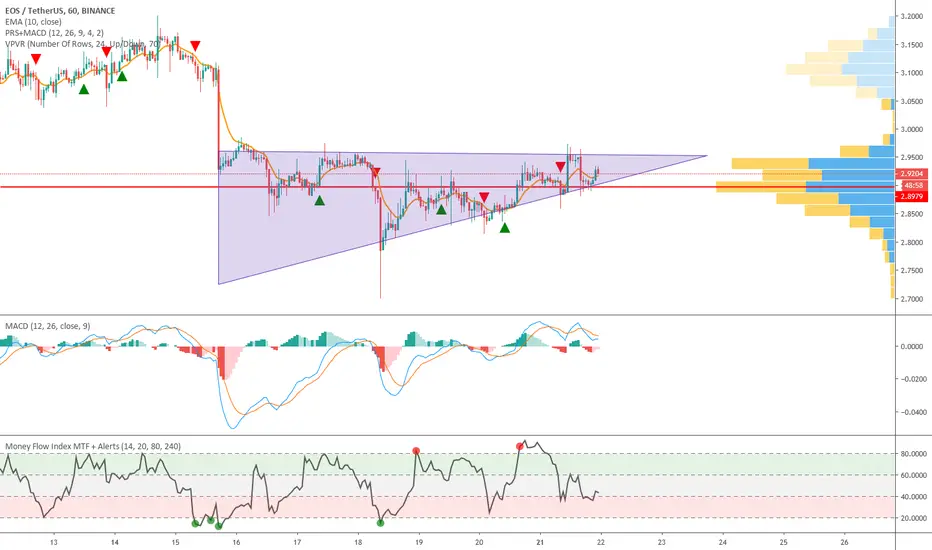
The weekly MACD giving postive outlook with the Money Flow index showing us a weekly bottom. The 12 hour chart looking like a MACD Cross over will occur and the 1hr chart showing a immediate crossover to take place now. There is a rising wedge patter taking place which can only be positive if we get a break out within the next 12 hours to the upside. There are many targets on the way up.
免責事項
これらの情報および投稿は、TradingViewが提供または保証する金融、投資、取引、またはその他の種類のアドバイスや推奨を意図したものではなく、またそのようなものでもありません。詳しくは利用規約をご覧ください。
免責事項
これらの情報および投稿は、TradingViewが提供または保証する金融、投資、取引、またはその他の種類のアドバイスや推奨を意図したものではなく、またそのようなものでもありません。詳しくは利用規約をご覧ください。