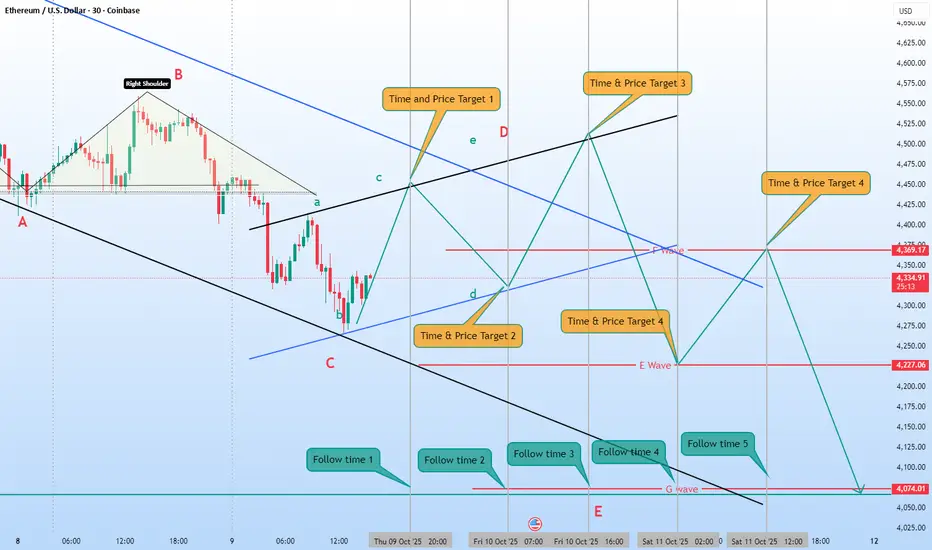
🔍 Key Chart Patterns & Structures
Head and Shoulders pattern marked at the top (with "Right Shoulder" labeled).
An ABCDE Elliott Wave structure is labeled (A to E).
Final movement projected as a G Wave toward the bottom.
📍 Major Time & Price Targets Identified
These are marked by orange labels:
Time & Price Target 1 — around 4,425 near intersection of trendlines D and e.
Time & Price Target 2 — lower target, around 4,275.
Time & Price Target 3 — higher target (~4,550), suggesting a bullish scenario.
Time & Price Target 4 — this label is duplicated at two different locations:
One around 4,275 again.
One higher near 4,425 (possibly indicating uncertainty between scenarios).
🕒 Follow Time Zones (Blue Labels)
These mark specific times to watch for possible market reactions or wave completions:
Follow Time 1–5 span from Oct 10 to Oct 11, potentially marking the development of wave E and G.
🔴 Support & Resistance Levels
4,369.17 and 4,227.06 are key horizontal price levels (likely S/R).
4,074.01 appears to be a final target for the bearish wave G.
Technical Analyst BY Passion
免責事項
これらの情報および投稿は、TradingViewが提供または保証する金融、投資、取引、またはその他の種類のアドバイスや推奨を意図したものではなく、またそのようなものでもありません。詳しくは利用規約をご覧ください。
Technical Analyst BY Passion
免責事項
これらの情報および投稿は、TradingViewが提供または保証する金融、投資、取引、またはその他の種類のアドバイスや推奨を意図したものではなく、またそのようなものでもありません。詳しくは利用規約をご覧ください。