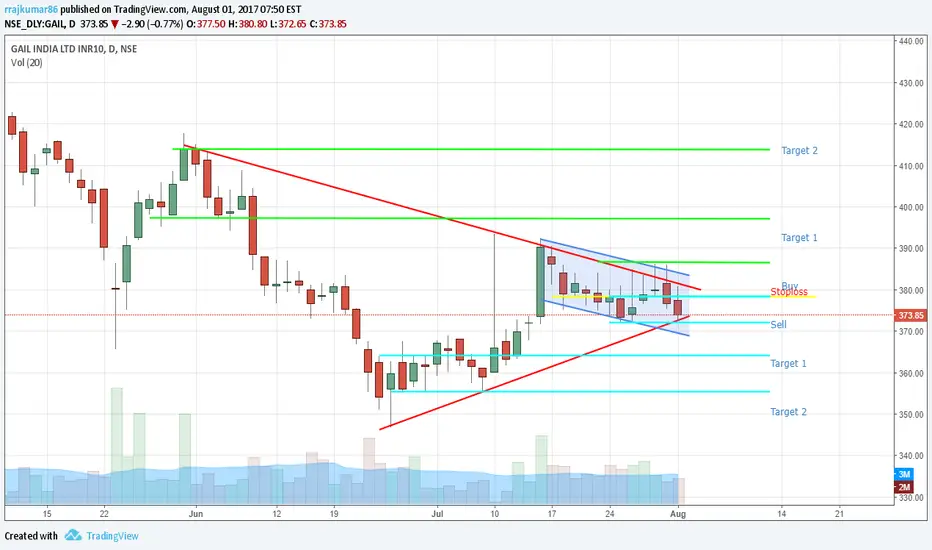
Symmetrical Triangle Formation have been observed in GAIL.
Buy Above 387 for the Targets of 392 397 404 413.
Sell Above 372 for the Targets of 368 364 355 348.
Stoploss for both Buy and sell 378.
You can not follow waves in my chart. If breakout then its breakout. Follow the levels. if Stoploss Hit exit.
Buy Above 387 for the Targets of 392 397 404 413.
Sell Above 372 for the Targets of 368 364 355 348.
Stoploss for both Buy and sell 378.
You can not follow waves in my chart. If breakout then its breakout. Follow the levels. if Stoploss Hit exit.
トレード稼働中
02/08 13:17 Sell Activeトレード稼働中
First Target 368 made 368.1 Revise Stoploss to Cost手動でトレードを終了しました
Trailing stoploss at cost hit.免責事項
これらの情報および投稿は、TradingViewが提供または保証する金融、投資、取引、またはその他の種類のアドバイスや推奨を意図したものではなく、またそのようなものでもありません。詳しくは利用規約をご覧ください。
免責事項
これらの情報および投稿は、TradingViewが提供または保証する金融、投資、取引、またはその他の種類のアドバイスや推奨を意図したものではなく、またそのようなものでもありません。詳しくは利用規約をご覧ください。