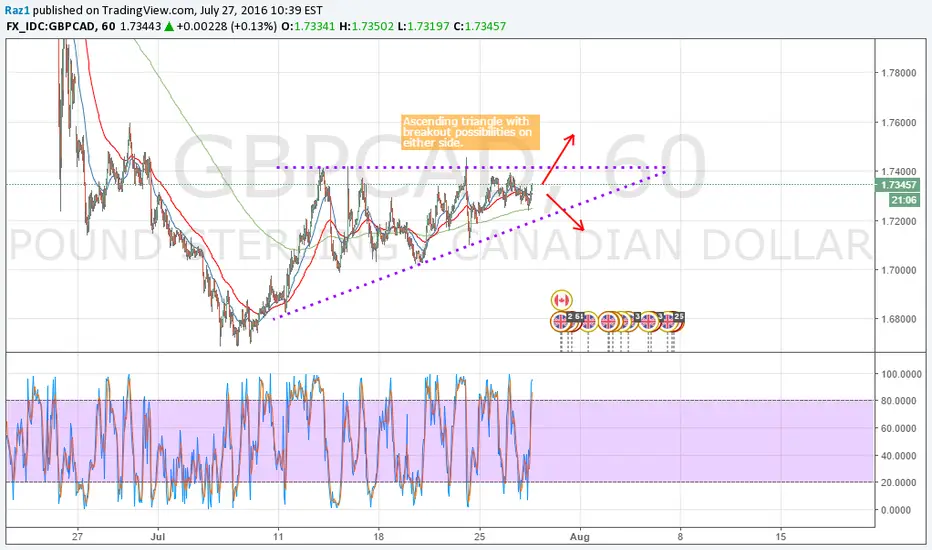
GBPCAD has formed an ascending triangle. Usually these patterns represents a bullish trend however in this case, it is hard to tell and the possibilities of direction can go either way.
ノート
It seems GBPCAD may be breaking out towards the downside of the triangle, if this is the case, wait for it to retest and look for some bearish confirmation before shorting.関連の投稿
免責事項
これらの情報および投稿は、TradingViewが提供または保証する金融、投資、取引、またはその他の種類のアドバイスや推奨を意図したものではなく、またそのようなものでもありません。詳しくは利用規約をご覧ください。
免責事項
これらの情報および投稿は、TradingViewが提供または保証する金融、投資、取引、またはその他の種類のアドバイスや推奨を意図したものではなく、またそのようなものでもありません。詳しくは利用規約をご覧ください。