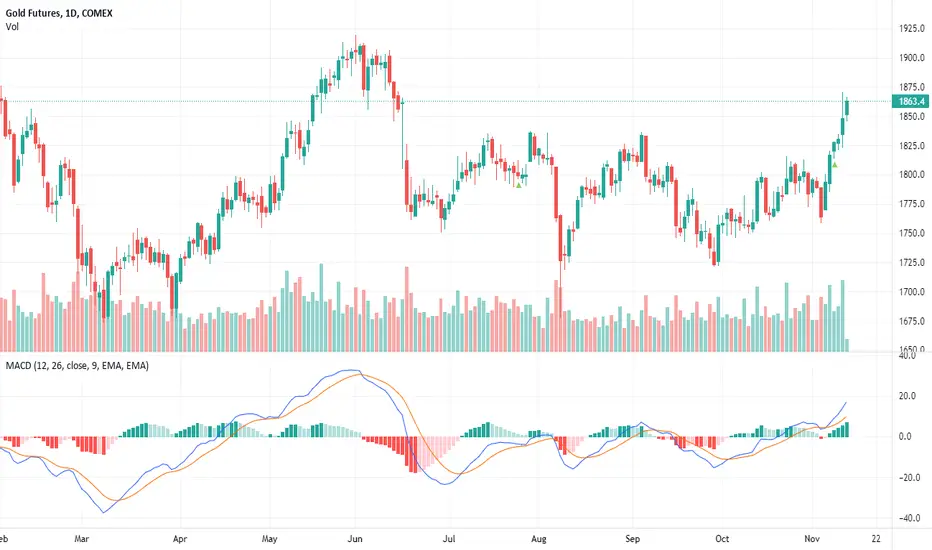
"Megaphone Bottom" chart pattern formed on Gold. This bullish signal indicates that the price may rise from the close of$1854 to the range of $1951-2000. The pattern formed over 150 days which is roughly the period of time in which the target price range may be achieved, according to standard principles of technical analysis.The recent broadening action tells us that trading has been out of control, but a breakout on the upside suggests we're starting a more decisive uptrend. With its broadening price swings, the Megaphone represents a market that's unstable and out of control. It typically consists of two successively higher highs between three lower lows, and the reversal signal occurs when the price breaks up above the second peak (the highest high) as a sign of a more decisive bullish move.
ノート
The megaphone bottom is now larger and does not invalidate the callトレード終了: 利益確定目標に到達
免責事項
これらの情報および投稿は、TradingViewが提供または保証する金融、投資、取引、またはその他の種類のアドバイスや推奨を意図したものではなく、またそのようなものでもありません。詳しくは利用規約をご覧ください。
免責事項
これらの情報および投稿は、TradingViewが提供または保証する金融、投資、取引、またはその他の種類のアドバイスや推奨を意図したものではなく、またそのようなものでもありません。詳しくは利用規約をご覧ください。