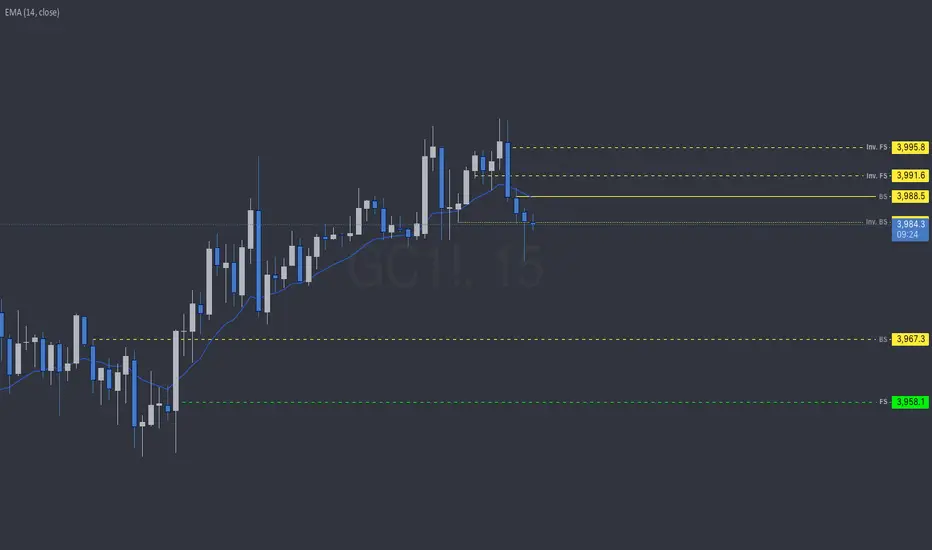
Just marked the hourly resistance levels as Inv.FS and the solid line BS
support is below price BS dashed line is the hourly level and the green dashed line is the 5min timeframe FS
support is below price BS dashed line is the hourly level and the green dashed line is the 5min timeframe FS
免責事項
これらの情報および投稿は、TradingViewが提供または保証する金融、投資、取引、またはその他の種類のアドバイスや推奨を意図したものではなく、またそのようなものでもありません。詳しくは利用規約をご覧ください。
免責事項
これらの情報および投稿は、TradingViewが提供または保証する金融、投資、取引、またはその他の種類のアドバイスや推奨を意図したものではなく、またそのようなものでもありません。詳しくは利用規約をご覧ください。