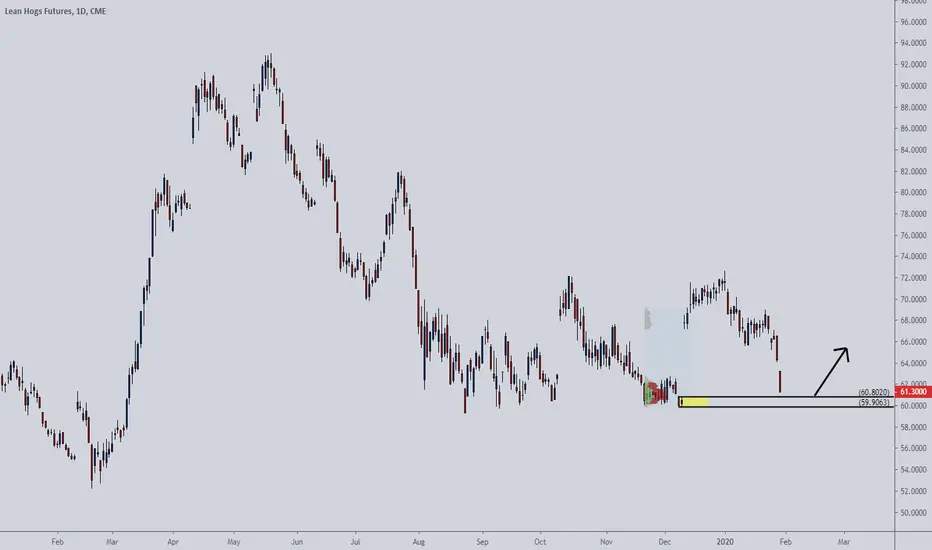
A long red candle has formed on the daily chart. A strong gap down, however, I identified a volume cluster just below the current price. If buyers are strong, they will push the price up again. A strong demand zone is also just below the current price.
Our target is 1 to 1, and the stop is a close, on the daily chart, below the lower line.
Our target is 1 to 1, and the stop is a close, on the daily chart, below the lower line.
免責事項
この情報および投稿は、TradingViewが提供または推奨する金融、投資、トレード、その他のアドバイスや推奨を意図するものではなく、それらを構成するものでもありません。詳細は利用規約をご覧ください。
免責事項
この情報および投稿は、TradingViewが提供または推奨する金融、投資、トレード、その他のアドバイスや推奨を意図するものではなく、それらを構成するものでもありません。詳細は利用規約をご覧ください。