Trend line Resistance:
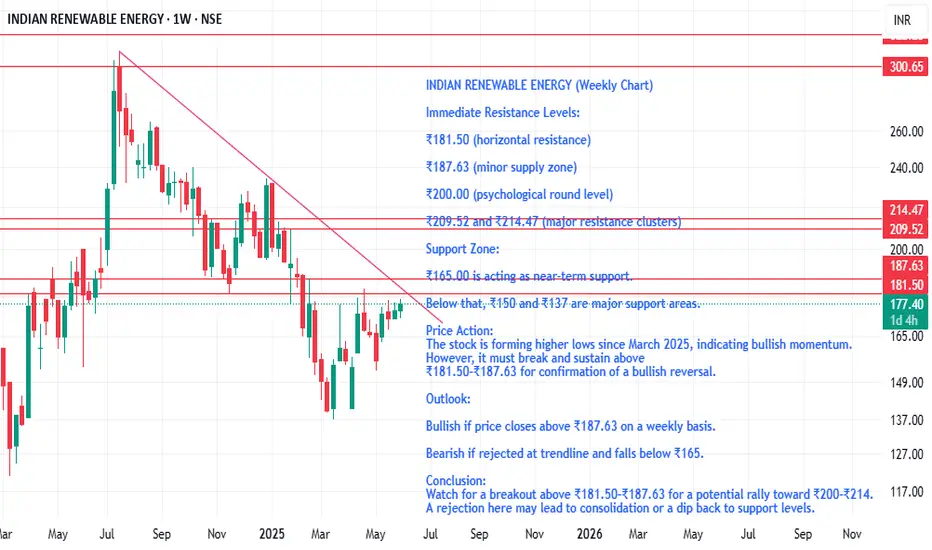
The price is approaching a descending trend line resistance drawn from the July 2024 highs. It is currently testing this line, indicating a crucial breakout or rejection zone.
Immediate Resistance Levels:
₹181.50 (horizontal resistance)
₹187.63 (minor supply zone)
₹200.00 (psychological round level)
₹209.52 and ₹214.47 (major resistance clusters)
Support Zone:
₹165.00 is acting as near-term support.
Below that, ₹150 and ₹137 are major support areas.
Price Action:
The stock is forming higher lows since March 2025, indicating bullish momentum. However, it must break and sustain above ₹181.50–₹187.63 for confirmation of a bullish reversal.
Outlook:
Bullish if price closes above ₹187.63 on a weekly basis.
Bearish if rejected at trendline and falls below ₹165.
Conclusion:
Watch for a breakout above ₹181.50–₹187.63 for a potential rally toward ₹200–₹214. A rejection here may lead to consolidation or a dip back to support levels.
免責事項
これらの情報および投稿は、TradingViewが提供または保証する金融、投資、取引、またはその他の種類のアドバイスや推奨を意図したものではなく、またそのようなものでもありません。詳しくは利用規約をご覧ください。
免責事項
これらの情報および投稿は、TradingViewが提供または保証する金融、投資、取引、またはその他の種類のアドバイスや推奨を意図したものではなく、またそのようなものでもありません。詳しくは利用規約をご覧ください。