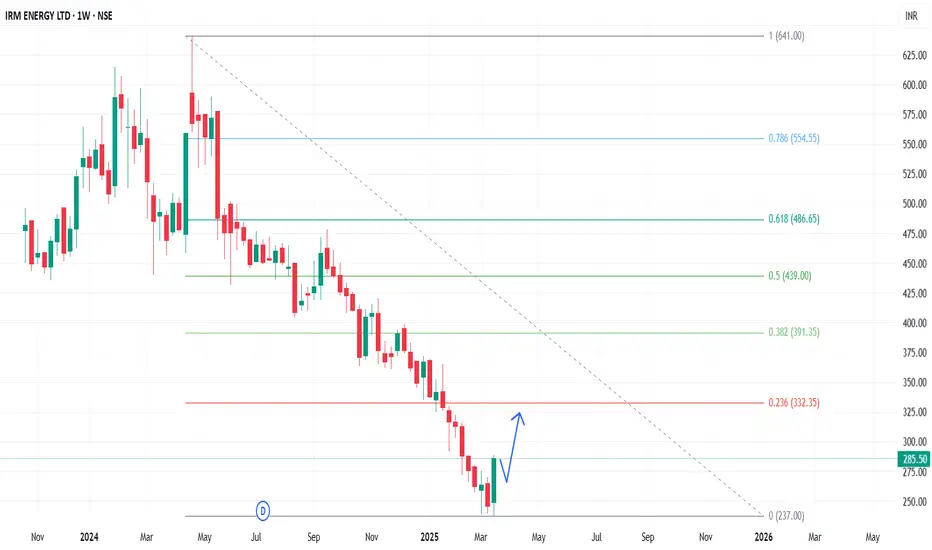
In the Weekly Chart of IRMENERGY ,
we can see that; it has given a W shape recovery from 240 levels.
Let it create a halt candle and then enter with SL & Targets.
Expected momentum is shown in chart.
we can see that; it has given a W shape recovery from 240 levels.
Let it create a halt candle and then enter with SL & Targets.
Expected momentum is shown in chart.
免責事項
この情報および投稿は、TradingViewが提供または推奨する金融、投資、トレード、その他のアドバイスや推奨を意図するものではなく、それらを構成するものでもありません。詳細は利用規約をご覧ください。
免責事項
この情報および投稿は、TradingViewが提供または推奨する金融、投資、トレード、その他のアドバイスや推奨を意図するものではなく、それらを構成するものでもありません。詳細は利用規約をご覧ください。