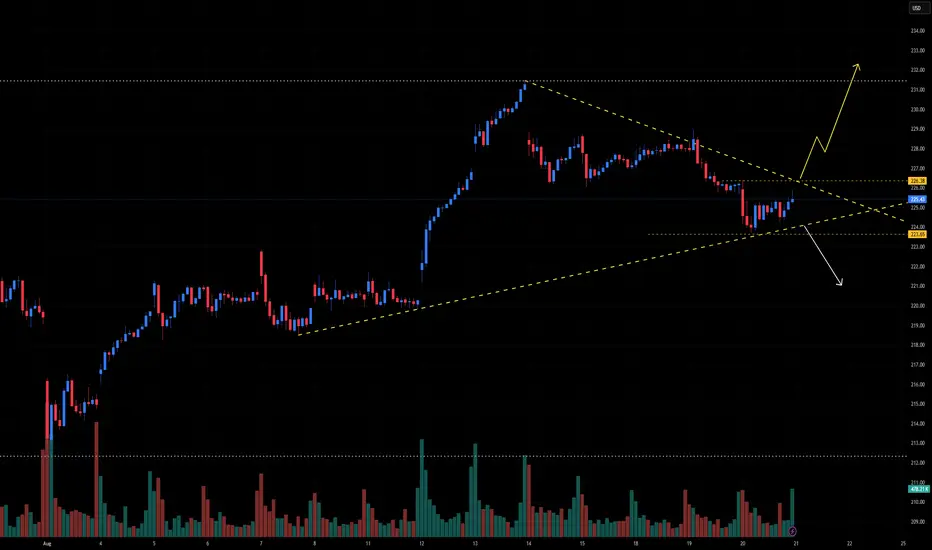
📈 IWM Technical Outlook – Wedge Break Imminent
Ticker: IWM (Russell 2000 ETF)
Timeframe: 30-minute candles
🔍 Current Setup
IWM has formed a symmetrical wedge, with price compressing between a descending resistance line (~227) and an ascending support line (~223.65). This pattern reflects a balance of buyers and sellers — and it’s nearing its apex, signaling that a decisive breakout is likely very soon.
📊 Breakout Levels
🚀 Upside (Bullish Scenario)
Trigger: Close above 227.00 with volume
Intermediate Targets:
231.50–232.00 → Prior swing high resistance
235.00–236.00 → Momentum continuation zone
Measured Move Target: 237.00
🔻 Downside (Bearish Scenario)
Trigger: Close below 223.65 with volume
Intermediate Supports:
221.00 → Local demand area
217.00 → Previous consolidation base
Measured Move Target: 213.50
📈 Volume Analysis
Recent candles show a pickup in volume, a classic sign that markets are preparing for a strong move.
Whichever side breaks first is likely to carry momentum, with follow-through expected.
⚖️ Probability Bias
Current price action suggests buyers are defending the rising trendline, but momentum has slowed since the last rally.
A strong close above 227 would put bulls firmly in control.
Conversely, failure to hold 223.65 opens the door for a deeper correction.
✅ Takeaway
The wedge is tight, and the breakout is imminent:
Bullish Break > 227: Look for 231.50 → 235 → 237
Bearish Break < 223.65: Look for 221 → 217 → 213.50
Stay alert — volume will confirm the true direction.
免責事項
これらの情報および投稿は、TradingViewが提供または保証する金融、投資、取引、またはその他の種類のアドバイスや推奨を意図したものではなく、またそのようなものでもありません。詳しくは利用規約をご覧ください。
免責事項
これらの情報および投稿は、TradingViewが提供または保証する金融、投資、取引、またはその他の種類のアドバイスや推奨を意図したものではなく、またそのようなものでもありません。詳しくは利用規約をご覧ください。