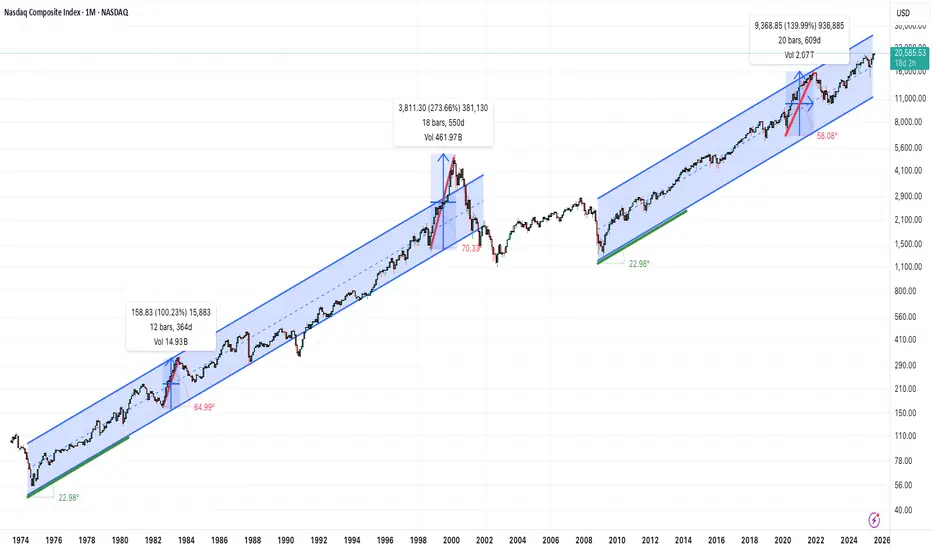
On the monthly timeframe, there are no signs of an over-extended, parabolic condition for the Nasdaq Composite(IXIC).
It's interesting to note that for a 25 year period from 1974 to 1999 the overall trend was roughly a positive 23 degree angled climb. We see that again in the current 16 year trend that started in 2009.
Much steeper parabolic periods can be seen in shorter time frames like the 1998-2000 move, where the angle reached 70 degrees. That didn't end well. It's also worth noting that in 1982 and 2020 we saw similar behavior, though slightly less frothy. Both of those periods were also followed by significant retracements.
Maybe we are at the beginning of one of those multi-month, over-extended runs. But not seeing it today. If we are trading at 45,000 or more in 2026, that's a different story...
免責事項
この情報および投稿は、TradingViewが提供または推奨する金融、投資、トレード、その他のアドバイスや推奨を意図するものではなく、それらを構成するものでもありません。詳細は利用規約をご覧ください。
免責事項
この情報および投稿は、TradingViewが提供または推奨する金融、投資、トレード、その他のアドバイスや推奨を意図するものではなく、それらを構成するものでもありません。詳細は利用規約をご覧ください。