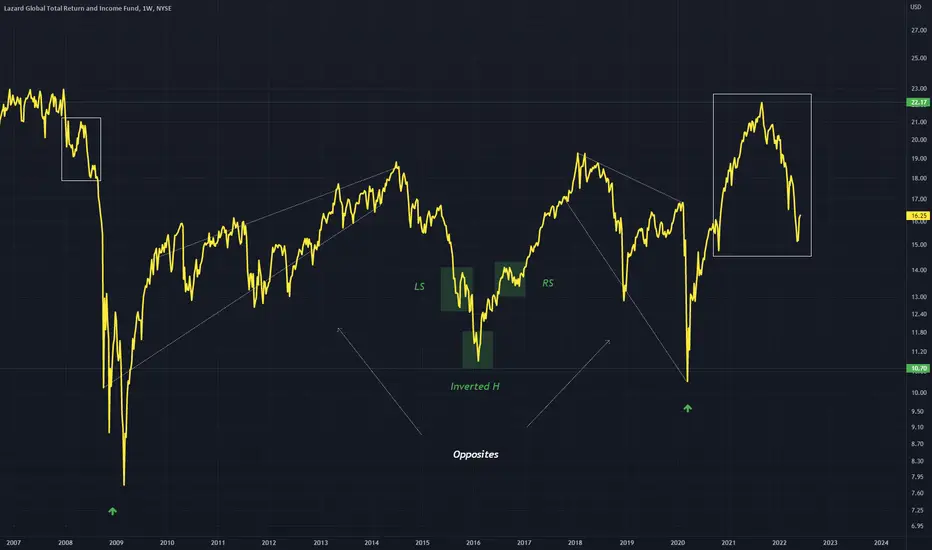
A chart for LGI, price is in a relatively tight range on this Weekly timeframe, it has repeated a chart pattern in an inverted fashion
White rectangle is where we are currently with price and should retest green as it did in the first situation inversely on the first white rectangle
Both are wedge patterns
White rectangle is where we are currently with price and should retest green as it did in the first situation inversely on the first white rectangle
Both are wedge patterns
免責事項
これらの情報および投稿は、TradingViewが提供または保証する金融、投資、取引、またはその他の種類のアドバイスや推奨を意図したものではなく、またそのようなものでもありません。詳しくは利用規約をご覧ください。
免責事項
これらの情報および投稿は、TradingViewが提供または保証する金融、投資、取引、またはその他の種類のアドバイスや推奨を意図したものではなく、またそのようなものでもありません。詳しくは利用規約をご覧ください。