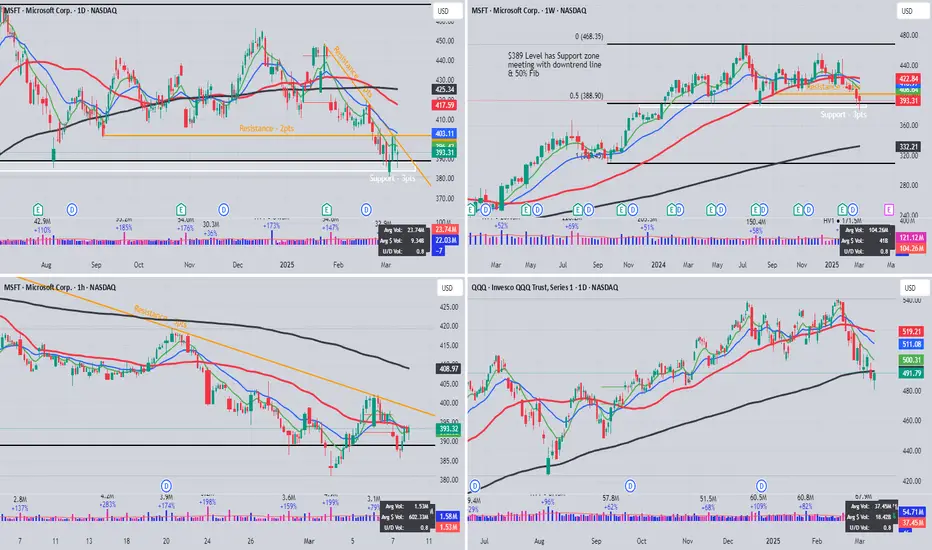
MSFT Charts showing confluence at the $389 level. There are support & resistance lines meeting with 50% Fib.
Volume is higher at trendline touches but not extreme.
Volume is higher at trendline touches but not extreme.
免責事項
この情報および投稿は、TradingViewが提供または推奨する金融、投資、トレード、その他のアドバイスや推奨を意図するものではなく、それらを構成するものでもありません。詳細は利用規約をご覧ください。
免責事項
この情報および投稿は、TradingViewが提供または推奨する金融、投資、トレード、その他のアドバイスや推奨を意図するものではなく、それらを構成するものでもありません。詳細は利用規約をご覧ください。