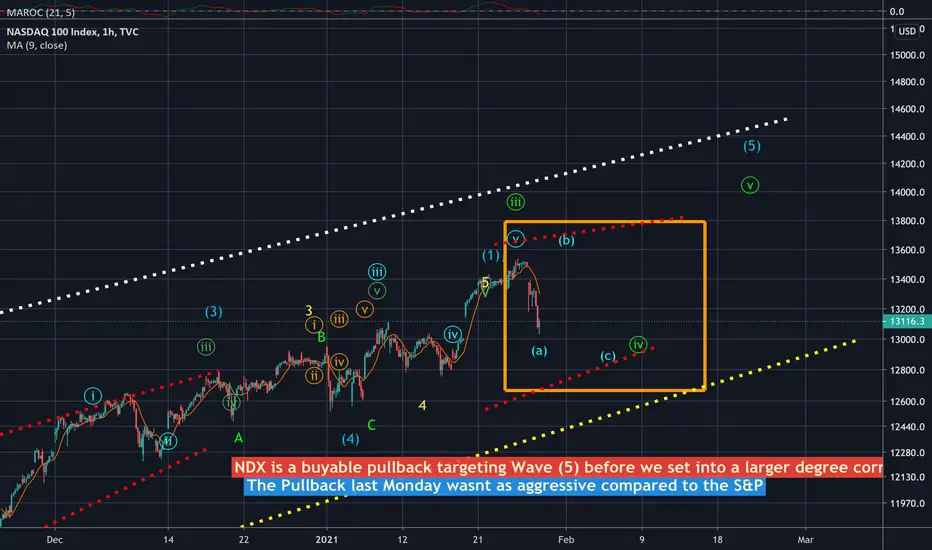
The same predicament exists in the NDX as the SPX. On the hourly chart, we’re seeing a corrective (a), (b), (c) pullback and we may be contained within in the highlighted range in W/ Orange rectangle before completing once terminal move higher into wave v.
免責事項
これらの情報および投稿は、TradingViewが提供または保証する金融、投資、取引、またはその他の種類のアドバイスや推奨を意図したものではなく、またそのようなものでもありません。詳しくは利用規約をご覧ください。
免責事項
これらの情報および投稿は、TradingViewが提供または保証する金融、投資、取引、またはその他の種類のアドバイスや推奨を意図したものではなく、またそのようなものでもありません。詳しくは利用規約をご覧ください。