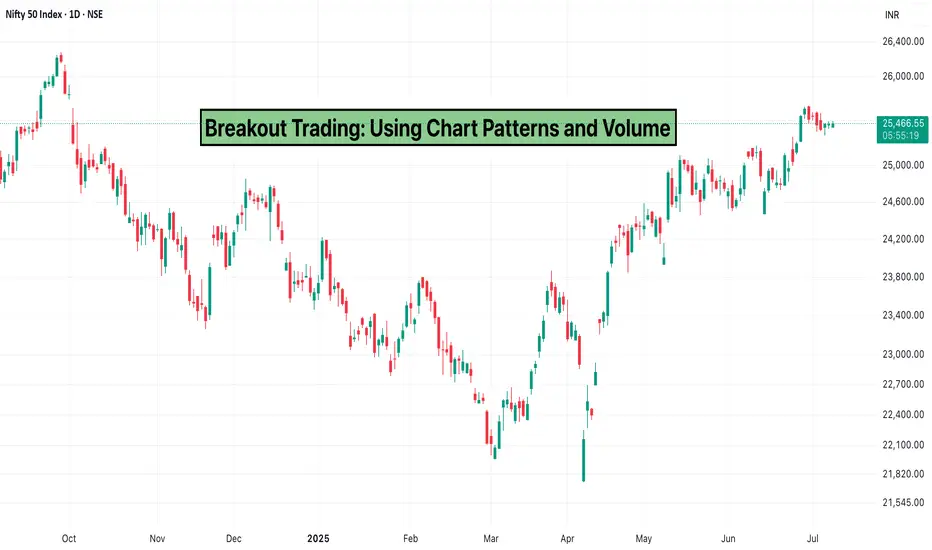
Breakouts are one of the most exciting moments in a chart—they often signal the beginning of a strong move, whether upward or downward. But not every breakout is real. Some fizzle out. Others turn into fakeouts. So how do you improve your odds?
The key lies in combining chart patterns with volume analysis. When used together, they help you spot breakout opportunities with more clarity and confidence.
What Is Breakout Trading?
Breakout trading is a strategy that focuses on entering a trade when the price breaks above a resistance level or below a support level. The idea is to catch the beginning of a new trend while momentum is building up.
But here’s the catch: breakouts without volume often don’t hold. That’s why traders watch for confirmation usually in the form of increased volume to validate the move.
Chart Patterns That Signal Breakouts
Certain patterns often lead to breakout setups. Some of the most popular include:
Triangles (Ascending, Descending, Symmetrical)
Price tightens and forms a triangle shape, with a breakout expected at the apex.
Flags and Pennants
After a sharp move (the flagpole), the price consolidates briefly in a small range before continuing in the same direction.
Rectangles (Consolidation Zones)
Price moves sideways within a range. A breakout above or below the range signals the next move.
Cup and Handle
A rounded bottom forms the cup, followed by a small pullback (the handle). A breakout from the handle often signals bullish continuation.
Why Volume Matters in Breakouts
Volume is the fuel behind the breakout. It tells you if there’s real interest behind the price movement.
Breakout + High Volume = Strong Confirmation
When volume increases along with the breakout, it means buyers (or sellers) are stepping in with conviction.
Breakout + Low Volume = Warning Sign
A breakout without volume might not last. These are often fakeouts that trap traders.
Volume gives weight to the breakout. It confirms that the price isn’t just drifting out of a zone—it’s being pushed.
Conclusion
Breakout trading becomes far more reliable when you combine chart patterns with volume. Patterns give structure. Volume gives conviction.
If you're just watching price without volume, you're only seeing half the story. On TradingView, you can easily overlay volume on any chart and use drawing tools to highlight patterns—so there’s no reason to trade breakouts blindly.
Elevate your Trading Experience 🚀
📱 Download Dhan App on iOS and Android and Start Trading.
📱 Download Dhan App on iOS and Android and Start Trading.
免責事項
これらの情報および投稿は、TradingViewが提供または保証する金融、投資、取引、またはその他の種類のアドバイスや推奨を意図したものではなく、またそのようなものでもありません。詳しくは利用規約をご覧ください。
免責事項
これらの情報および投稿は、TradingViewが提供または保証する金融、投資、取引、またはその他の種類のアドバイスや推奨を意図したものではなく、またそのようなものでもありません。詳しくは利用規約をご覧ください。