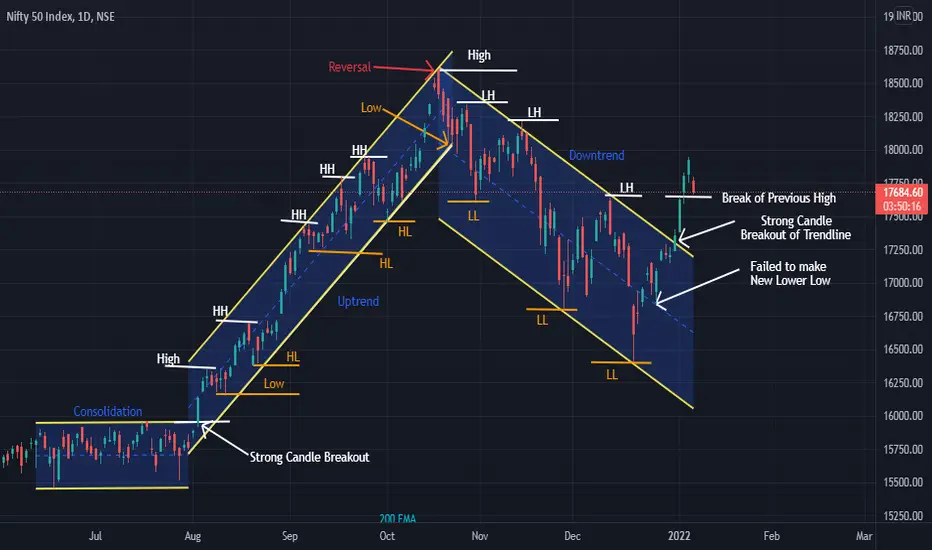
Beautiful Example of Price Action shown by Nifty on Daily chart.
First you can see Consolidation before BULL run.
When BULL run started you can see HH & HL forming in Uptrend Channel
once it reaches the Top it showed Reversal with Continuous red candles
After that a Downtrend with HL & LL forming
and it broke the channel upside - Showing Breakout of Resistance Line
Understanding Simple Price Action in one Chart Shown by Nifty
please do correlate by yourself also on charts. This is for educational and paper trading purpose only. Please consult your financial advisor before invest
免責事項
これらの情報および投稿は、TradingViewが提供または保証する金融、投資、取引、またはその他の種類のアドバイスや推奨を意図したものではなく、またそのようなものでもありません。詳しくは利用規約をご覧ください。
免責事項
これらの情報および投稿は、TradingViewが提供または保証する金融、投資、取引、またはその他の種類のアドバイスや推奨を意図したものではなく、またそのようなものでもありません。詳しくは利用規約をご覧ください。