📈 Chart Structure Overview
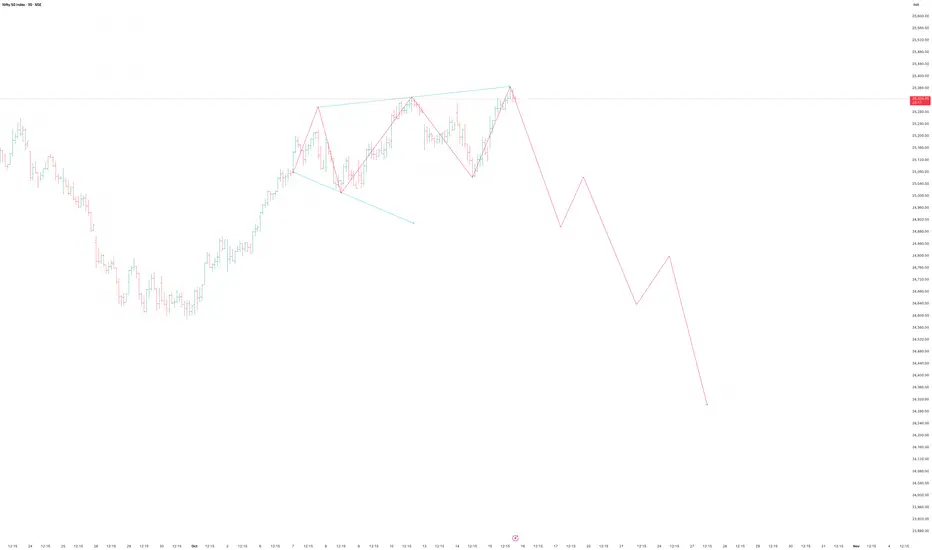
The chart clearly shows a rising wedge formation — a bearish reversal pattern typically appearing at the end of a bullish rally.
✅ Summary View
Aspect Observation
Pattern Rising Wedge (Bearish)
Bias Short-term corrective / bearish
Key Resistance 25,380–25,420
Key Breakdown Zone 25,120
Targets 24,900 → 24,700 → 24,400
Stop-loss (for short) 25,450
Conclusion
Nifty’s price action suggests distribution and exhaustion at the top.
A confirmed breakdown below 25,120 could open up a short-term correction of 500–700 points.
Stay cautious of false breakouts above 25,400 unless backed by strong volume.
Disclaimer:
This analysis is for educational and technical insight purposes only.
Trading decisions should be based on your own confirmation strategy, volume validation, and risk management.
トレード稼働中
ノート
Fall from here is impulsive. 免責事項
これらの情報および投稿は、TradingViewが提供または保証する金融、投資、取引、またはその他の種類のアドバイスや推奨を意図したものではなく、またそのようなものでもありません。詳しくは利用規約をご覧ください。
免責事項
これらの情報および投稿は、TradingViewが提供または保証する金融、投資、取引、またはその他の種類のアドバイスや推奨を意図したものではなく、またそのようなものでもありません。詳しくは利用規約をご覧ください。