Magical numbers - 30,60,90,120,180,240,270, and 360.
Take Nifty chart and go to daily chart.
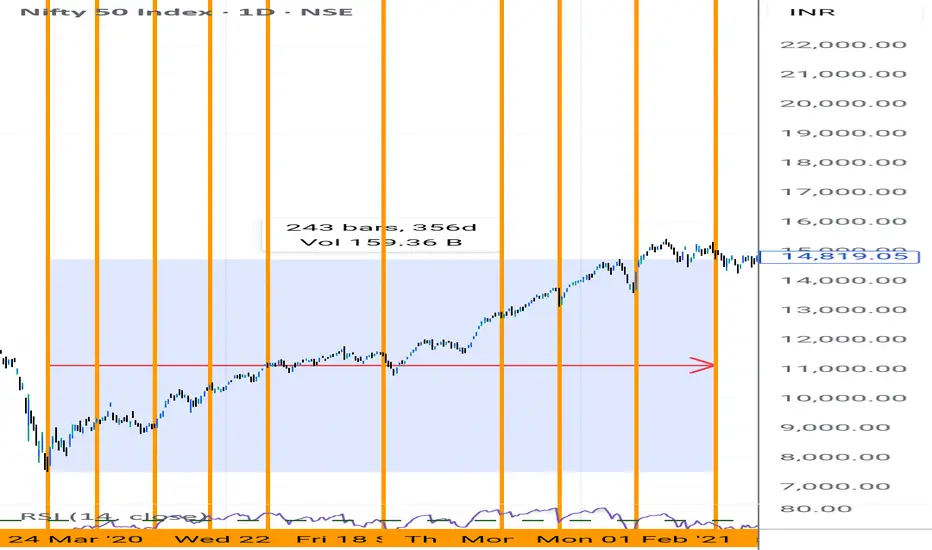
Now check previous major swing high and swing low. In other terms top and bottom.
Now take a date range tool from drawing mode and start counting the days as mentioned above.
You will see the Magic of these numbers. Let me as you where did it came from? Its 3,6,9 rule theory of Gann.
For better confluence, take previous two top and two bottoms. If many verticals lines alligned on the same date something big is going to happen.
Check and Verify by yourself.
Note - Above charts shows I marked only from one bottom till 360 days.What if I added 2 tops and one more bottom? Mathematics is magic!
Take Nifty chart and go to daily chart.
Now check previous major swing high and swing low. In other terms top and bottom.
Now take a date range tool from drawing mode and start counting the days as mentioned above.
You will see the Magic of these numbers. Let me as you where did it came from? Its 3,6,9 rule theory of Gann.
For better confluence, take previous two top and two bottoms. If many verticals lines alligned on the same date something big is going to happen.
Check and Verify by yourself.
Note - Above charts shows I marked only from one bottom till 360 days.What if I added 2 tops and one more bottom? Mathematics is magic!
免責事項
これらの情報および投稿は、TradingViewが提供または保証する金融、投資、取引、またはその他の種類のアドバイスや推奨を意図したものではなく、またそのようなものでもありません。詳しくは利用規約をご覧ください。
免責事項
これらの情報および投稿は、TradingViewが提供または保証する金融、投資、取引、またはその他の種類のアドバイスや推奨を意図したものではなく、またそのようなものでもありません。詳しくは利用規約をご覧ください。