This is an update to our last post:
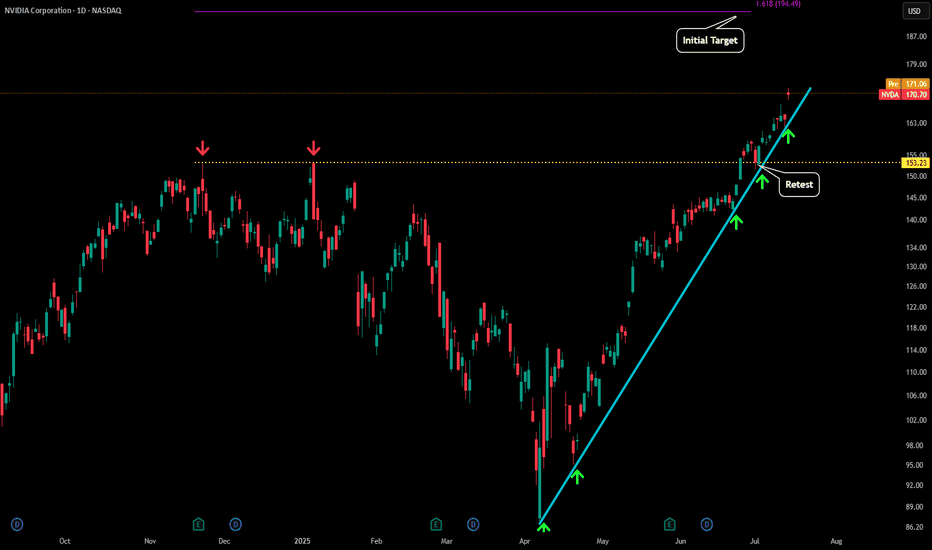
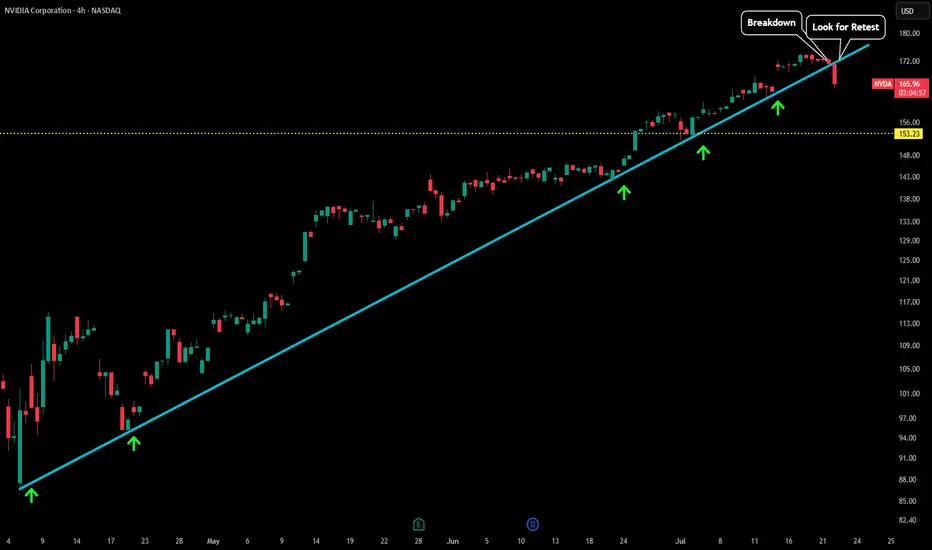
After finding support upon this trendline for so many test we are now seeing the first signs of weakness. As soon as price fell below our trendline we saw a very sharp decline in price.
Now that trendline could act as a new level of resistance. Any test back to the upside could be a test of blue trendline as resistance + test of last high (which could create some sort of double top). Will update this post when more developments occur.
免責事項
これらの情報および投稿は、TradingViewが提供または保証する金融、投資、取引、またはその他の種類のアドバイスや推奨を意図したものではなく、またそのようなものでもありません。詳しくは利用規約をご覧ください。
免責事項
これらの情報および投稿は、TradingViewが提供または保証する金融、投資、取引、またはその他の種類のアドバイスや推奨を意図したものではなく、またそのようなものでもありません。詳しくは利用規約をご覧ください。